Preface
Was 2016 the year everything changed? It will certainly be remembered as a year of many “surprises,” from “Brexit” to President-elect Trump. The political winds have clearly shifted against the free-trade consensus that has underpinned the global economy for the past 30 years, and signs are emerging that markets have had their fill of expansionary monetary policy.
We and others have remarked that over the past several years markets have hung on the words of central bankers to an unhealthy degree. Even after the UK vote to leave the European Union, while equities sold off in the immediate aftermath, they rebounded strongly based seemingly on optimism central bankers would do “more.” Yet the ongoing rally in risk assets is hard to pin solely on central banks, especially in the wake of the November 8 US presidential election. Indeed, since the election the US Federal Reserve has doubled down on its promises of a December rate hike, and equity markets loved it! After years of investors buying into “don’t fight the Fed” (or the ECB, or the BOJ…), the futility of negative interest rates may have finally sunk the narrative that has been hanging over markets for far too long.
We can’t dismiss the possibility that recent events herald a positive change for economies and markets. What if growth (and moderate inflation) return, and improving corporate fundamentals driven by organic growth take precedence? Seven years into a US economic expansion, and an incredible equity bull market run, it does seem odd to consider what could go right. But cycles do not die of old age, and the nascent global reflation trade suggests the current one may not yet be over. Thus, as we review the outlook for major asset classes, we do see the potential for a break in the clouds.
Of course, the sun doesn’t shine forever, and overall our views are little changed. The things we have been worried about for some time—high valuations for certain risk assets, record-low interest rates, slow economic growth—have not gone away. We remain concerned that investors are stuck in a low-return world where they will struggle to earn 5% in real terms. As we look across asset classes in the pages ahead, we see moderate to expensive valuations, solid but not spectacular fundamentals, and wildcards such as geopolitical shocks.
By far the biggest wildcard for the 2017 outlook is the rise of protectionism and an anti-globalization backlash across the developed world. The most important point for investors is this: no one knows what will unfold. We have been nonplussed at the remarkable confidence many (most?) market observers seem to have in their post–US election predictions. For our part, we are content to take the evidence as it comes.
On this point, the recent increase in dispersion, both among countries and sectors, is a positive sign. While still early, this could herald a (long overdue) shift from passive outperformance to active. Few things have been more hated in recent quarters than active managers, particularly hedge fund managers, and if there is one thing that being steeped in market history has taught us, it is that no trend lasts forever.
Color us cautiously optimistic, but still toting an umbrella.
— Capital Markets & Investment Strategy Research, December 8, 2016
Executive Summary
- Developed markets equities would appear poised for decent gains in 2017 given starting valuation levels and healthy earnings growth prospects, were it not for recent political developments that have clouded the outlook. Ironically, given the many current uncertainties on the policy front, an outlook calling for US equities to once again outperform peers seems the surest call to make. The outlook for developed markets equities outside the United States in 2017 is less certain despite more supportive valuations and equally or more attractive earnings growth expectations. Broadly speaking, an environment of improving economic growth and still historically low bond yields, along with largely absent equity valuation extremes, should be supportive of equity market performance, but downside risks remain elevated. As long as these risks remain at bay, the global reflation trade that has driven the rotation from defensive to cyclical sectors and from growth to value should enjoy further legs.
- Emerging markets equities are reasonably valued, both in absolute terms and relative to developed markets, parti-cularly more richly valued US equities. Fundamentals have improved, as have valuations of emerging markets currencies. But Chinese debt could once again raise investor hackles, and the potential for the United States to seek aggressive postures toward trade partners could continue to cause volatile markets. We still prefer emerging markets equities to overvalued US equities, but given risks to the emerging markets outlook for 2017 as well as our cautiously more constructive take on US equities, we are watching this recommendation closely and recommend appropriately conservative position sizing.
- Within credits, high-yield bonds seem unlikely to have another banner year in 2017 given current yields and macro headwinds. Leveraged loans seem better positioned, and could even outperform equities in a risk-off environment. Investors that can tolerate short-term volatility (and, in some cases, are willing to lock up capital) may find richer pickings, especially if they are willing to look at niches like structured credit, bank subordinated debt, and private credit strategies. A different approach is allocating to opportunistic funds, the best of which should be able to seize on relative value opportunities and even go short when markets look overheated. These funds may prove especially interesting if macro volatility increases, whether due to tighter monetary policy or political risks going from simmer to boil.
- Prospects for real assets are broadly positive for 2017, given investors are likely to place value in assets offering income, diversification, and inflation-protection potential in the changing political environment. Across real assets, our favorable view is backed by solid or improving fundamentals, from the tight real estate construction pipelines in the United States and continental Europe to the declines in energy and mining capital expenditures. While our optimism doesn’t extend to all real asset categories—clear near-term weaknesses exist in UK property and commodity futures—investors with positions that are low relative to policy should consider whether that call remains appropriate.
- Sovereign bonds are on the move, and market dynamics mean investors should make sure deflationary hedges are sufficiently low duration to withstand a larger-than-expected short-term spike in yields. The end to the 35-year bull market in US bonds may have been seen in 2016, and rising Treasury yields will pull up yields globally as other countries import inflation via depreciating currencies. Investors should stay alert and poised to lock in higher bond yields if and when the rise proves self-defeating (i.e., causes growth to stall). Not only could nominal bonds soon be trading at fair value, but the opportunity may present itself to lock in attractive long-term real yields in TIPS if they enter the lower bound of our fair value range.
- Rising interest rates and rising political uncertainty should benefit the US dollar relative to European and emerging markets currencies over the next year or so, as history implies the path of least resistance for the dollar is up. Yet the rally in the US dollar will not be a straight line and the currency may have already risen too far and too fast following the US election in the absence of concrete policy proposals from the new administration. But a period of near-term consolidation aside, additional USD strength is likely in 2017.
- Taking into account our views across asset classes, and considering the number of economic and political wildcards, suggests that investors should make sure portfolios are aligned with risk tolerance and return objectives and positioned to persevere in a variety of environments. Periods of volatility surrounding elections and referendums should be expected, making diversification and liquidity provisioning critical. This includes stress-testing portfolios, principally with regard to liquidity, in varied stressed environments. Even with their recent increase, bond yields remain low, dragging down prospective returns for a variety of asset classes. We remain concerned that capital markets are unlikely to deliver most investors’ long-term return objectives over the next five to ten years. To improve the likelihood of meeting return objectives while maintaining adequate defense, we recommend investors seek value-added returns in a variety of private investments, maintain neutral allocations to risk assets and limit tactical positioning in global equities, revisit defensive positions, allocate some capital to real assets that offer attractive return prospects even if commodity prices stay flat, and consider the prospects for reducing spending to maintain purchasing power.
Developed Markets Equities: Looking for Upside Potential
Michael Salerno, Senior Investment Director
The current outlook for developed markets equities is cautiously constructive, as prospects for more balanced economic policies, better economic growth, and a global earnings recovery—along with reasonable valuations outside the United States—are all positives. Such developments, if realized, would give further legs to the global reflation trade that has supported the outperformance of cyclical sectors and value equities in recent months. However, risks to the outlook are tilted toward the downside given a high level of uncertainty, particularly on the political and policymaking front, and most notably in Europe, where valuations appear most attractive.
2016 in Brief
Developed markets equities have seen modest gains in 2016 (MSCI World +6.1% through November 30 in local currency terms). Across the major regions, UK equities (+13.2%) and US equities (+8.9%) did the best, even as both regions suffered from a difficult earnings picture. Investors moved quickly to price in potential benefits of pound sterling weakness and higher commodity prices for UK large-cap earnings, and were not put off by high valuations for US equities given an improving earnings outlook and their relative safety in times of uncertainty. In contrast, earnings disappointments and heightened uncertainty led stocks in the Eurozone (-2.4%) and Japan (-4.0%) to underperform, notwithstanding attractive valuations.
Economic and political developments in 2016 have led to a global reflation trade with important consequences for global equities from both a factor and a sector standpoint. The seismic shifts observed in the bond market in recent months have contributed to a rotation within the equity market away from lower-beta, defensive stocks—whether the quality growth names or the high-yielding bond proxies that investors have favored in recent years—and into higher-beta, cyclical names geared to higher growth, inflation, and interest rates. The outperformance of value indexes over their growth counterparts in 2016 accelerated in October and was concentrated in cyclical sectors like financials (Figure 1). Bank stocks in particular have significantly outperformed, as recent events suggest that some relief may soon come from the heavy regulatory burden and financial repression that has characterized the post–global financial crisis environment.

Figure 1. Relative Cumulative Performance of MSCI World Value Index vs MSCI World Growth Index
February 29, 2000 – November 30, 2016 • Rebased to 100 on February 29, 2000
Sources: MSCI Inc. and Thomson Reuters Datastream. MSCI data provided “as is” without any express or implied warranties.
Note: Performance data are local currency total returns, net of dividend taxes.
The global earnings recession continued in 2016, with double-digit declines in trailing real EPS from recent peaks across all major markets. Slowing economic growth in emerging markets, the commodity price collapse, sluggish recoveries in developed markets, and extraordinary monetary policies have all contributed to the fall, with profits of natural resources producers and banks declining the most. For some markets, like Japan and the United States, recent earnings declines mark a somewhat modest setback from record levels achieved less than two years ago, while for the Eurozone and United Kingdom, profits are still far from all-time peaks set prior to the global financial crisis.
Looking Ahead to 2017
Analysts remain optimistic in their forward earnings estimates, with double-digit growth expectations across most regions for 2017, and forward earnings revision ratios have meaningfully improved since early 2016. However, we’d note the rosy outlook analysts are penciling in for 2017 tends to be the norm, and such estimates are often downgraded—sometimes to a large degree—as the year progresses (Figure 2).

Figure 2. Comparing EPS Growth Forecasts
As of November 30, 2016 • Year-Over-Year Percent (%) Growth
Sources: I/B/E/S, MSCI Inc., and Thomson Reuters Datastream. MSCI data provided “as is” without any express or implied warranties.
Notes: Fiscal year ends on December 31 for all regions except for Japan. Fiscal year for Japan ends on March 31 of the subsequent year.
In US equities, many observers are predicting good things from President-elect Donald Trump’s policy proposals, with some Wall Street strategists upgrading their earnings outlooks. The market appears to have quickly priced in some of the potential upside, particularly for US small caps. However, the ultimate implications of a Trump presidency for US corporate earnings are hardly clear, and near-term effects will depend on what gets prioritized. Corporate tax cuts would certainly be accretive to US equity earnings overall and, given the potential for a one-time tax holiday on repatriated cash and profits currently held offshore, could free up cash for debt reduction, reinvestment, or shareholder distributions. Major infrastructure and defense spending initiatives would boost aggregate demand, supporting top-line growth, while lighter regulation could prove beneficial to financial, energy, and health care sector profits, in particular. On the other hand, further strengthening in the US dollar would mean ongoing headwinds for large-cap multinationals. Similarly, higher interest rates, while supportive of bank net interest margins, translate into higher debt servicing costs for leveraged balance sheets and those companies with high exposure to floating-rate debt instruments, which are most prevalent among small caps. Stricter immigration enforcement against undocumented workers could stoke wage inflation in certain sectors, putting another pressure on elevated margins, as would protectionist trade measures via higher domestic labor costs. On balance, the prospective policy mix of the incoming administration would seem to support corporate profits, but the devil is in the details, which have been sorely lacking. The market consensus is for a near-term earnings boost from tax cuts and deregulation, which seems a reasonable expectation that should support US equity performance. Trade policy, given the executive branch’s power to act without congressional approval and Trump’s protectionist rhetoric, will remain an important risk to the outlook.
The outlook for UK equities differs depending on the market segment in question. Large-cap stocks would benefit further from any improvement in global and domestic economic growth, and the more competitive currency should remain an important tailwind for earnings. However, the potential for UK large caps to outperform again in 2017 mainly rests on the extent to which markets have already priced in the potential gains from expected earnings improvements. If either global economic growth surprises to the upside or the British pound depreciates more than the market currently anticipates, UK large caps would benefit from the related earnings upgrades. Prospects for UK mid caps are less constructive. Given a higher exposure to the domestic economy, mid caps would be vulnerable to any drop in economic activity stemming from a deterioration in business and consumer confidence if negotiations with the European Union become contentious, as they likely will. Currency weakness is also problematic for domestic-facing stocks given the risks to profit margins from higher import price inflation.
Political wildcards also will be important to watch in the Eurozone, given the heavy slate of national elections on the calendar in 2017. The rising tide of populism in Europe could derail efforts toward further Eurozone integration and weaken the euro, with Italian voters’ resounding rejection of constitutional reforms in the December 4, 2016, referendum the first potential domino. On the other hand, such a threat could result in fiscal stimulus regardless of the outcome of upcoming elections, as politicians of all stripes tend to make campaign promises aimed at boosting economic growth. Politics aside, though results in 2016 have significantly lagged analysts’ expectations, Eurozone earnings have been reasonably resilient relative to other European markets, and third quarter results have shown some improvement. Negative interest rates, flat yield curves, and elevated NPL exposure, among other headwinds, have weighed on bank profits, but cost cutting measures and a recent jump in trading revenues have started to help the bottom line for some institutions. Operating leverage has yet to meaningfully kick in for other sectors, but could begin to do so if economic growth continues to print above trend. A weaker euro would also support corporate earnings. Ultimately, expectations for continued improvement in economic data, ongoing monetary support, and expanded fiscal policy hinge to a large degree on how political developments play out. A renewed political crisis would no doubt hurt economic activity, and corporate profits and valuations would suffer accordingly.
In Japan, negative interest rates and a stronger yen—combined with still lackluster economic performance—have offset some of the progress made by President Shinzō Abe’s government on the corporate governance front with respect to capital allocation decisions and, therefore, profitability. Still, recent developments have improved the outlook for Japanese stocks. Prospects for Japanese bank earnings have risen with the BOJ’s decision to adjust its negative interest rate policy; its new yield-targeting policy is specifically meant to ease the burden on net interest margins through a steeper curve, although the effects so far have been modest. One related potential earnings growth driver is the yen, which has weakened considerably in recent weeks in response to the widening yield spread between JGBs and US Treasuries. The ruling party’s success in summer elections also means more fiscal stimulus could be announced in the coming months, on the heels of the supplemental budget introduced over the summer. Recent improvements in economic data suggest policy changes may be boosting demand, even if deflation risks remain at the forefront. Rising share buybacks and continued rotation of local institutions into equities, meanwhile, should provide some support for earnings and share prices alike.
Overlaying Valuations. As of November 30, normalized P/E ratios for developed markets equities as a whole had not budged much from the start of 2016 and remain within our historical fair value range (Figure 3). Valuations for US and UK equities have ticked up, those for Eurozone stocks have become more attractive, and Japanese equity valuations are virtually unchanged. Among major developed markets, only US equities are overvalued. Valuations for stocks in the Eurozone, Japan, and the United Kingdom remain undemanding by comparison, with all three at or below their historical medians—reflecting heightened risks and providing some cushion against further earnings disappointments, should they occur. In contrast, US equity valuations are the most reliant on a strong earnings recovery and continued low bond yields, and they would be the most vulnerable were the earnings recovery to fail to materialize, or if bond yields were to continue rising sharply. US stocks remain expensive in both absolute and relative terms, but some would argue for good reasons. The growth outlook and company fundamentals appear strongest and most certain in the United States, and therefore the current valuation premium assigned to US equities could be vindicated again in 2017.

Figure 3. Composite Normalized Price-Earnings Ratios by Region
As of November 30, 2016
Sources: MSCI Inc. and Thomson Reuters Datastream. MSCI data provided “as is” without any express or implied warranties.
Notes: The composite normalized P/E ratio is calculated by dividing the inflation-adjusted index price by the simple average of three normalized earnings metrics: ten-year average real earnings (i.e., Shiller earnings), trend-line earnings, and ROE–adjusted earnings. We used the post-2001 ROE-adjusted P/E for Japan.
Relative valuations for non-US developed equities appear compelling. Most markets trade at substantial discounts to US equities, but these largely reflect the risks associated with upcoming political events and current economic policies. Historically wide profitability differentials with the United States are also a factor. MSCI EAFE ex Japan trades at a 36% discount to MSCI US on a relative composite normalized P/E basis, just below the all-time high set in June 2016. Discounts for UK (43%) and Eurozone (35%) equities to US equivalents are not far below their highest recorded levels either, and Japanese stocks also look cheap on a relative basis. Such relative undervaluation for European and Japanese equities suggests the potential for longer-term outperformance over US stocks, but the uncertainties are too great today to bet much on near-term mean reversion, especially since absolute valuations fail to offer significant value and currencies remain vulnerable, as discussed later in this report.
Summary
Developed markets equities would appear poised for decent gains in 2017 given starting valuation levels and healthy earnings growth prospects, were it not for recent political developments that have clouded the outlook. Ironically, given an election result that surprised many observers and the many current uncertainties on the policy front, an outlook calling for US equities to once again outperform peers seems the surest call to make. The outlook for developed markets equities outside the United States in 2017 is less certain despite more supportive valuations and equally or more attractive earnings growth expectations, so investors considering tactical bets toward Europe and Japan and away from the United States should proceed with caution.
Broadly speaking, an environment of improving economic growth and still historically low bond yields, along with largely absent equity valuation extremes, should be supportive of equity market performance, but downside risks remain elevated. As long as these risks remain at bay, the global reflation trade that has driven the rotation from defensive to cyclical sectors and from growth to value should enjoy further legs. Investors should consider tilting portfolios to value stocks more broadly in light of signs that headwinds to bank profits from central bank policies and regulations could diminish going forward, particularly in the United States.
Emerging Markets Equities: Can Fundamentals Trump Risks?
Sean McLaughlin, Managing Director
Over the course of 2016, emerging markets equities have finally delivered the performance many investors had been hoping for, and moved from being very undervalued to merely undervalued. The outlook for 2017 is uncertain—fundamentals are better, but political risks cast a long shadow. Beyond watching how the trade policies of the new US administration unfold, investors should also keep an eye on Chinese debt, a long-simmering issue that could erupt into a problem in 2017. For now, we remain positive on the case for modest overweights to emerging markets equities versus overvalued US equities.
2016 in Brief
Emerging markets equities played to form in 2016, delivering higher volatility than developed markets. Early in the year, shares and currencies followed the prices of oil and other commodities lower, only to rebound along with said prices as changing leadership in Brazil and improving economic data in China boosted investor confidence. Shares hit multi-year lows in January, then rallied 34% from those levels through September, before losing steam amid concerns about US President-elect Donald Trump’s constrictive trade talk and the rise in both the US dollar and global bond yields.
Looking Ahead to 2017
Fundamentals for emerging markets firms are recovering together with their share prices. After contracting 8% in 2014 and an additional 5% in 2015, analysts expect earnings to rebound 9% in 2016, with growth in all sectors save telecom and utilities. Analysts have also penciled in 14% further earnings growth in 2017 (with all sectors and nearly all countries in the black ); however, as we noted in discussing developed markets equities, consensus expectations a year out tend to be optimistic. ROE is running at 10%, the lowest since the financial crisis, but well above the 8% level for non-US developed markets. Even as fundamentals are stronger going into 2017, two factors we are keeping an eye on are the potential for Chinese debt to erupt into a problem, and relations with the United States. China’s debt binge has been a recurring fear for investors, and debt levels continue to soar. Even if, as some predict, corporate debt as a percentage of GDP levels off, the potential for an eruption deserves consideration. On trade, the United States is a key importer for many countries, and trade relations are suddenly a wildcard, though not yet, ahem, a trump card. USD strength poses additional risks for export-dependent markets, for countries with large dollar-denominated debt burdens, and for dollar-based investors concerned about further currency depreciation.
Chinese Corporate Debt. Chinese corporate debt levels may peak in 2016 as a percentage of GDP, according to sell-side strategists at Citi and independent analysts at GaveKal Dragonomics, who believe that with firms becoming more conservative in their borrowing and industrial sectors facing overcapacity, corporate demand for credit may be waning. What does a stable corporate debt/GDP level look like in China? One of the more important factors to consider is that given China’s level of growth and inflation, a stable debt ratio does not translate to a stable debt level. Debt has soared to more than 200% of GDP today from just 145% of GDP five years ago, but while the ratio increased by about 55 ppts of GDP, the outstanding debt level has doubled, a remarkable 17% growth rate (Figure 4).

Figure 4. Chinese Corporate Debt
First Quarter 2006 – Second Quarter 2016 • Percent (%) of GDP
Sources: Bank for International Settlements, Bloomberg L.P., Institute of International Finance, The People’s Bank of China, and Thomson Reuters Datastream.
Notes: Corporate debt as a percent of GDP data for second quarter 2016 is an estimate. In the Total Corporate Debt Outstanding inset, “2020 Projection” assumes that debt levels continue to grow at the same rate as nominal local currency GDP from December 31, 2011, to June 30, 2016.
Assuming the current corporate debt ratio—about 200% of GDP—is the peak and it stays flat from here, what does this mean for the size of Chinese debt markets? If the Chinese economy maintains the same roughly 7% annual GDP growth rate over the next five years as it did over the past five, with similar levels of inflation, then 200% debt to GDP would translate to a remarkable $32 trillion debt pile.[1]It is worth noting that many observers do not believe the official Chinese growth numbers. This would rival the US total.[2]The analysis applies the same simple methodology to project US debt outstanding—increasing it by the country’s trailing five-year nominal GDP growth.
We highlight debt levels because (1) we believe investors may be surprised to find that the Chinese corporate debt market is already three-fourths the size of the US corporate debt market and may eclipse it in a few years, and (2) put gently, we have some concerns about the quality of underwriting given the frantic pace of debt growth. Chinese corporations have added an eye-watering $11 trillion in debt over the past five years, a monthly net average of $183 billion.[3]We earlier shared our views on Chinese debt growth in Tim Hope, “A Matter of Trust(s): Chinese Banks’ Wealth Management Products,” Cambridge Associates Research Brief, May 2014, and Aaron … Continue reading
Many cracks are starting to show, notwithstanding the miniscule percentage of loans officially flagged as non-performing. Reported NPLs and special-mention loans totaled about 5.5% of loans at the end of 2015, a level that has held relatively steady for years even as the coal and steel industries have been decimated.[4]The increase in debt is concentrated in the coal, steel, and electricity industries, which has seen liability-to-equity ratios increase from about 140% to 190% over the past five years, even as they … Continue reading The IMF, using bottom-up estimates from corporate data, finds that nearly three times as many loans are at risk, with potential losses totaling 7% of GDP. Loans within “shadow” products such as trusts could be even lower quality, and total 58% of GDP.[5]Please see Wojciech Maliszewski et al., “Resolving China’s Corporate Debt Problem,” IMF Working Paper WP/16/203, International Monetary Fund, October 2016. When tabulating the loans in … Continue reading While “evergreening” of problematic loans is likely to remain the norm, it is clear debt levels are unsustainable for many issuers. A Reuters analysis of 93 large Hong Kong–listed Chinese firms found that one-quarter had insufficient profits to cover debt-servicing obligations.[6]Umesh Desai, “Road to Stagnation: China Inc. Gets a Break From Lenders,” Reuters, October 4, 2016.
On the positive side, research firm BCA notes that assets have risen along with debt; for example, the total assets–to-GDP ratio for industrial firms has increased from 135% of GDP to 142% over the past five years, and the liabilities-to-assets ratio has declined.[7]Please see Yan Wang et al., “Rethinking Chinese Leverage,” China Investment Strategy, BCA Research, October 27, 2016. However, given that at least part of the reason for this is that companies are less profitable and less efficient (lower return on assets), the rise in assets is hardly an unalloyed good.
What are the implications of all this? We and many other observers continue to expect a portion of corporate debts will “transform” into central government debts, as China’s government debt–to-GDP level is only slightly larger than that for emerging markets as a whole (Brazil’s debt-to-GDP ratio, by comparison, is about 30 ppts higher). Further, China’s foreign debt liabilities only sum to about 13% of GDP, so the government likely has some flexibility in the event corporate bailouts become necessary, provided the government is vigilant about stopping the continued kudzu-like buildup of corporate debt now. Depending on the pace of credit deterioration, and on how the government manages it, the risk of a hard landing remains modest (although not as remote as we would like). A more likely scenario is prolonged sclerosis as recognition and write-downs of problem loans (and the subsequent recapitalization of banks) are spread out over many years, limiting the availability of credit to worthwhile borrowers.
Political Risks. While emerging markets have plenty of problems of their own making, November’s US presidential election handed them another worry. Trump secured victory in part by promising to tear up existing trade deals like NAFTA and planned ones like the Trans-Pacific Partnership. Worries about the trade deals and a sharp rise in the US dollar and interest rates dealt a blow in November to many emerging markets shares and currencies. The president-elect has not been consistent about his specific intentions on trade and immigration policies, and in either case, he will need the support of others in Washington. Particularly given the uncertainty of what Trump will be able to accomplish (and indeed, what he even wishes to do), at present we would not advise major alterations to emerging markets holdings based on election results. The potential for protectionist policies is certainly a risk to the outlook, and one we are watching closely.
Overlaying Valuations. In February, the composite normalized P/E multiple for the MSCI Emerging Markets Index hit 10.5, its lowest since early 2003, and valuations remain cheap even after the subsequent recovery.
Emerging markets valuations are also well below those of developed markets, with the MSCI Emerging Markets Index trading at a steeper discount to the MSCI World and MSCI US indexes than is typical. As of November 30, emerging markets as a whole traded at a normalized composite earnings multiple of 11.6, in the 11th percentile over the past two decades (Figure 5). Our ROE-adjusted P/E ratio indicates that emerging markets are modestly below fair value, while the Shiller P/E ratio and trendline P/E ratio indicate much deeper undervaluation.

Figure 5. Absolute and Relative Valuations of Emerging Markets Equities
September 30, 1995 – November 30, 2016
Sources: MSCI Inc. and Thomson Reuters Datastream. MSCI data provided “as is” without any express or implied warranties.
Notes: The composite normalized price-earnings (P/E) ratio is calculated by dividing the inflation-adjusted index price by the simple average of three normalized earnings metrics: ten-year average real earnings (i.e., Shiller earnings), trend-line earnings, and return on equity–adjusted earnings. Relative valuations are based on the MSCI Emerging Markets composite normalized P/E versus the MSCI World composite normalized P/E. All data are monthly.
Summary
Emerging markets equities are reasonably valued, both in absolute terms and relative to developed markets, particularly more richly valued US equities. Valuations of emerging markets currencies have also improved, as we note later in this report, and we believe indebted emerging markets borrowers are now less vulnerable to dollar strength and diminished liquidity than they have been in recent years. Corporate fundamentals may also be turning the corner. But Chinese debt could once again raise investor hackles, and the US president-elect’s unpredictability and potential to seek aggressive postures toward trade partners could continue to cause volatile markets. We still prefer emerging markets equities to overvalued US equities, but given risks to the emerging markets outlook for 2017 as well as our cautiously more constructive take on US equities described in the previous section, we are watching this recommendation closely and recommend appropriately conservative position sizing.
Credits: Be Nimble and Opportunistic
Wade O’Brien, Managing Director
Many credit strategies surprised with strong returns in 2016, rebounding after a rough 2015, as fears over rising interest rates, sinking commodity prices, and slowing global growth proved overdone. While companies may have avoided worst-case scenarios in 2016, conditions are likely to grow more challenging going forward. Lower starting yields and weakening fundamentals are known headwinds; the possible shift to less accommodating monetary policy in key economies is a wildcard. Investors should stay nimble in this environment, favoring opportunistic strategies and exploring what for some may be new niches.
2016 in Brief
Contrary to expectations, many higher-beta credit assets generated attractive returns in 2016 (through November 30) as worst-case macro scenarios did not materialize and market dislocations eased (Figure 6). Whereas depressed prices of high-yield bonds and leveraged loans baked in high expected default rates, the trailing 12-month default rate for high-yield bonds of 3.7% at the end of October was only slightly above its historical average. Excluding commodity sectors the picture looked even healthier, as default rates for both US high-yield bonds and leveraged loans stood at less than 1%. Less encouraging is the fact that recovery rates were much lower than in past years, a result of concentration in commodity sectors and the need for cash from new creditors during restructurings.

Figure 6. Year-to-Date 2016 Fixed Income Returns
As of November 30, 2016 • Percent (%) • USD Terms
Sources: Barclays, Bloomberg L.P., Credit Suisse, J.P. Morgan Securities, Inc., and Thomson Reuters Datastream.
Notes: Asset classes represented by: Bloomberg Barclays US Corporate High Yield Bond Index (US HY Bonds), Bloomberg Barclays Global High Yield Bond Index (Global HY Bonds), J.P. Morgan Corporate Emerging Markets Bond Index (Corp EM Bonds), J.P. Morgan EM Government Bond Index (EM Gov Bonds), Credit Suisse Leveraged Loan Index (Leveraged Loans), Bloomberg Barclays Global Aggregate Bond Index (Global Agg Bonds), Bloomberg Barclays US Aggregate Bonds Index (US Agg Bonds), J.P. Morgan Global Government Bond Index (Global Gov Bonds), US Benchmark 10-Year Datastream Government Index (10-Yr US Treasury), Bloomberg Barclays European Aggregate Bond Index (Euro Agg Bonds), and Bloomberg Barclays Municipal Bond Index (US Muni Bonds).
Fundamentals have weakened across a variety of credit markets, with leverage ratios for US high-yield borrowers rising to record highs; the picture excluding commodity sectors is only slightly more encouraging (Figure 7). US investment-grade corporate data have also softened, as companies rely on low-yielding debt to help maintain generous payouts to shareholders. Current gross leverage (debt/EBITDA) for investment-grade companies at 2.3 times is also near 15-year highs. Debt service ratios (EBITDA/interest expense) for both high-yield and investment grade look healthier, but are flattered by low yields and have seen some recent deterioration given weak profit growth.

Figure 7. US High Yield ex Commodities Leverage and Interest Coverage Ratios
June 30, 1997 – September 30, 2016
Source: BofA Merrill Lynch.
Notes: Leverage ratio measures net debt to trailing 12-month EBITDA. Interest coverage ratio measures trailing 12-month EBITDA to trailing 12-month interest exposure.
Looking Ahead to 2017
Monetary policy in 2016 has been very supportive for credit, with central banks across the globe pushing interest rates into negative territory and aggressively buying sovereign (and in some cases corporate) bonds, creating spillover effects that drove credit spreads lower. Tighter monetary policy in 2017 would remove a key tailwind for credit. Rising US inflation has increased the odds of a December rate hike, and more hikes seem probable in 2017 if President-elect Donald Trump fulfills his promises of fiscal stimulus. Rising sovereign yields would not only reduce the crossover bid that has pushed income-sensitive investors into credit in recent years, but could also weaken debt servicing ratios and boost defaults.
Please see Wade O’Brien et al., “The Consequences of Negative Interest Rates,” Cambridge Associates Research Brief, October 10, 2016.
Even in regions like the Eurozone and Japan, where inflation remains contained, rates may start to rise given political pushback from negatively affected groups like savers, pension funds, and local banks. The BOJ recently suggested it will allow the curve to steepen, and the ECB has sounded out markets about tapering its asset purchases. While higher rates would strain debt affordability, Japanese and European companies have not boosted leverage like their US peers, and are thus more insulated against rising rates.
Drilling down to the sector level, energy defaults have soared given low oil prices and the excess investment of previous years. While the sector, at least in the United States, could receive a boost from lighter regulatory oversight (for example, over US pipelines), the direction of oil prices remains a big wildcard. Still, given around 25% of US high-yield energy issuers have defaulted in just the last 12 months, the contribution by the sector to the overall index default rate is likely to drop going forward. In a similar vein, financial sector profits across markets have been battered by low rates and rising regulatory burdens, but both headwinds could fade in 2017. Structured credit has benefited from rising US real estate prices and household formation in recent years, but higher mortgage rates—assuming the recent rise in long-term Treasury yields is not quickly reversed—will temper this growth. Meanwhile, various economic and political unknowns (European elections, Trump administration policies, central bank activities, etc.), seem likely to boost market volatility in 2017.
Many of the major credit betas are not priced to generate attractive risk-adjusted returns, even if fundamentals have stabilized (Figure 8). These include US high-yield bonds (6.5% yield) and European equivalents (yielding just over 4%). Leveraged loans seem better value in both markets, as current yields are not markedly lower (discount margins on US loans are around 500 bps and Libor is rising), loans are higher in the capital structure, and loans provide some protection against rising rates via their Libor-linked coupons.[8]Although this can be easily offset by higher default risk as rates rise. Investment-grade bonds (which yield around 3.4% in the United States and just under 1% in the Eurozone) are unattractive, particularly in light of rising US leverage levels. Low-yielding credit will also be hampered by the recent rise in sovereign yields, as investors will be less tempted to reach for yield now that they can find it via instruments like long-dated US Treasuries.

Figure 8. Debt Markets by Yield, Rating, and Market Value
As of November 30, 2016
Sources: Barclays, Bloomberg L.P., and J.P. Morgan Securities, Inc.
Notes: The area of each bubble represents the current market value of each index, shown in USD billions.”Bank Preferreds” are represented by the Bloomberg Barclays Global Contingent Capital Index, CLO BB by the J.P. Morgan CLO BB Index, CMBS by the Bloomberg Barclays Global Aggregate Securitized Index, Corp Inv Grade by the Bloomberg Barclays Global Aggregate Index, EM Sovereign Debt by the J.P. Morgan EMBI Global Diversified Index, European HY by the Bloomberg Barclays Pan European High Yield Index, Leveraged Loans by the J.P. Morgan Leveraged Loans Index, US Corp HY by the Bloomberg Barclays US Corporate High Yield Index, and US Treasuries by the Bloomberg Barclays US Treasury Index.
Exploring Niche Opportunities. Investors in 2017 may be better served exploring niches in the credit markets that have higher barriers to entry, or are currently being disrupted by regulatory change. In the United States, these include a variety of structured credit instruments—non-Agency mortgage bonds (where credit analysis is complex and the necessary IT infrastructure requires large upfront investments), lower-rated CLO debt (where new risk-retention rules mean managers are paying higher spreads to execute deals), and some commercial real estate debt (where bespoke transaction terms, a pullback by banks, and the need for swift execution create an opportunity for private credit funds). Clearly, any large change in the regulatory environment could mean the opportunity set for some of these managers shrinks; investors will need to keep a careful eye on announcements emanating from Washington.
In Europe, bank contingent convertible securities (a type of deeply subordinated debt also known as bank preferreds) offer yields of around 7% despite improving credit fundamentals. European banks have boosted capital ratios in recent years and seem far less likely to default than similarly rated but lower yielding comparables like high-yield bonds. Private credit (lending) funds focused on middle-market loans in the United States and Europe are also interesting.[9]On the opportunity in Europe, please see Wade O’Brien et al., “Opportunities Arising from Banking Sector Stress in Europe,” Cambridge Associates Research Brief, August 24, 2016. Commercial banks now play a reduced role in this market due to higher capital requirements, new restrictions regarding leverage levels,[10]See the November 2016 edition of Quarterly Regulatory Update for more discussion on these restrictions. and general risk aversion; the result is that middle-market-focused private equity firms are paying elevated interest rates to finance deals. Investors should monitor policy changes as well as the volume of capital being raised across these opportunities to ensure it does not outpace the opportunity set, and as always, careful manager selection is paramount.
Given reduced liquidity in credit markets in general and particularly in some of the strategies discussed, investors should think carefully about credit investments’ ability to serve their intended role in the portfolio and be prepared for potential volatility. In 2016, assets like energy debt and structured credit saw large early sell-offs before their eventual strong recoveries; 2017 may see the same pattern re-emerge, but potentially in different credit asset classes.
Opportunistic credit funds that dynamically allocate across asset classes may also prove an attractive way to take advantage of market choppiness. The best of these managers should be able to rotate into underpriced assets, as they did earlier in 2016 when structured credit suffered from technical pressures, or go short when exuberant markets mean credit has become too expensive.
Summary
High-yield bonds seem unlikely to have another banner year in 2017 given current yields and macro headwinds. Leveraged loans seem better positioned, and could even outperform equities in a risk-off environment. Investors that can tolerate short-term volatility (and, in some cases, are willing to lock up capital) may find richer pickings, especially if they are willing to look at niches like structured credit, bank subordinated debt, and private credit strategies. A different approach is allocating to opportunistic funds, the best of which should be able to seize on relative value opportunities and even go short when markets look overheated. These funds may prove especially interesting if macro volatility increases, whether due to tighter monetary policy or political risks going from simmer to boil.
Real Assets: Prospects Remain Broadly Positive
Kevin Rosenbaum, Investment Director
We see upside to real assets from current levels. Although this view is set against a litany of concerns—including a mature real estate cycle, near unprecedented levels of crude oil inventories, and uneven global growth—we expect investors will continue to place value in real assets as a source of income, diversification, and (possible) protection from inflation, particularly in the current low rate environment.
2016 in Brief
Performance across real assets generally fared well in 2016 relative to broad equities. Natural resources equities (+25.8% through November 30 in USD terms) led broad real assets categories, due in part to a substantial rebound in mining equities (+55.8%) and crude oil prices (+32.9%). The jump in crude oil prices to near $50 after hitting mid-$20 lows in early 2016 calmed bankruptcy fears among US energy companies, helping energy MLPs (+13.3%) to bounce back. In addition to oil’s rebound, significant moves in industrial metals, precious metals, and softs sent broad commodity futures (+9.8%) into positive territory for the first time in five years.
The laggard among real assets was real estate. After stellar returns through much of the year, owing in part to positive fundamentals, US REITs (+4.0% through November 30) fell victim to changing interest rate expectations in the latter part of 2016. Developed property securities’ USD performance (+1.9%) proved to be slightly worse than US REITs, with the difference linked to declines in UK property securities and the pound.
Looking Ahead to 2017
US Real Estate—More Room to Run. US commercial real estate prices have risen strongly in recent years, with the Moody’s/RCA CPPI national all-property composite index showing capital values have doubled since their 2010 lows. While such a rapid increase is a red flag, fundamentals have rarely been so healthy, and with expectations for modest US growth and a glacial pace of rate hikes, we expect real estate has more room to run.
Much of our optimism stems from the fact that for much of this cycle the supply pipeline has been virtually closed (Figure 9). While recent trends in space efficiency—particularly in the office subsector—have limited demand growth, new supply has been easily absorbed, with national occupancy rates now at their highest level since 2001, according to NCREIF data.

Figure 9. US Commercial Real Estate Construction
Fourth Quarter 1966 – Third Quarter 2016 • Percent (%) of GDP
Source: US Department of Commerce – Bureau of Economic Analysis.
Notes: Data are quarterly and reflect aggregate new real estate construction spending in “Commercial and Healthcare,” as well as “Multifamily” BEA categories.
Pockets of weakness do exist, including apartments in gateway cities and e-commerce-disrupted retail but, in our opinion, these are offset by the aforementioned lack of supply. That said, given already high occupancy levels, any growth will be driven primarily by rental rate increases. As a result, we generally agree with the current Urban Land Institute real estate consensus forecast, which predicts total returns for private investments will dip to mid-single digits.
Ultimately, we think investors should be measured in adding any risk to real estate portfolios, given the length of this cycle, the uncertainties related to President-elect Donald Trump’s broad policy preferences, and the recent increase in financing costs. Further, transaction volumes have slowed slightly of late. While there is close to US$160 billion in uncalled capital committed to global real estate funds, according to our data, and reason to think much of that could find its way to the United States, transaction activity may further decline.
European Real Estate—Opportunities in Uncertainty. In the months following the “Brexit” vote, investors continue to lack real clarity about the UK government’s negotiation priorities. That uncertainty, along with expectations for reduced economic activity, has led capital values across Britain to fall by close to 4% from May to October, according to the unlevered IPD UK Monthly Property Index. While vulnerability varies by property type, quality, and location, with central London offices most at risk, we expect capital values in aggregate to continue to moderate in 2017 to reflect cooling demand.
Bold investors may find opportunities in the UK market. Although much depends on the long-term impact of the leave vote, property fundamentals are healthy, with vacancy rates near lows and inventory expected to remain limited. Given both the compelling gap between property and gilt yields and the weakened state of the pound, we think property fund managers could surprise with solid, single-digit total returns in the longer term.
The best opportunities in 2017 reside in continental Europe, where Brexit-related risks are less pronounced. In recent quarters, fundamentals in various European real estate markets have continued to improve, as economic indicators have remained broadly positive. With little new supply expected to hit markets and few yield alternatives available on the Continent, we expect investor appetite to remain healthy. Still, political risks abound, and investors should look to the fallout from December’s Italian referendum as a gauge on broader EU concerns.
Global Energy Equities—Shale in the Driver’s Seat. OPEC’s decision at its November 30 meeting to follow through with proposed production cuts reduced concerns about downside risks in oil prices, although it is reasonable to question both members’ willingness to stick to the agreement, and the price impact even if they do. The 14-nation cartel had been ramping up production, hitting a record high of 33.6 million barrels per day in October, which is nearly 1.2 million barrels higher than the newly agreed quota. Still, the organization’s shift away from its previous pump-at-will policy and toward a market-management strategy should be seen as a positive development for oil markets, particularly US shale.
US shale producers have already made tremendous strides in lowering breakeven prices—by one estimate, the average initial oil production of a new well has more than quintupled across the four major basins in the last five years (Figure 10)—and such gains seem poised to continue. Some of the reduction in breakevens is linked to cyclical factors, such as cost deflation and high grading, which have helped global competitors as well. But much of the reduction is structural, resulting from reduced drilling and completion times, lower total well costs, and increased well performance. In a 2016 study, the global information company IHS said it expects new efficiencies to drive down costs a further 7% to 22% in the 2017–18 period.
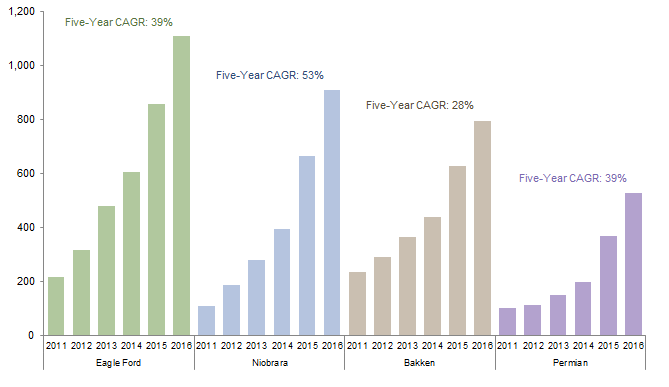
Figure 10. US New-Well Oil Production
As of September 30, 2016 • Average Barrels per Day, per Rig
Source: US Department of Energy – Energy Information Administration.
Notes: Data are from the October 17, 2016, edition of EIA’s Drilling Productivity Report. New-well oil production per rig is the barrels per day average of a new rig’s production in its first full month.
The reduction in breakeven prices coincided with better-than-expected well performance, particularly in the Permian basin, which has seen acreage prices soar. Close to half of all rigs operating in the United States, both on-shore and off, are located in the West Texas basin, helping the Permian’s production hit a new high in recent months despite the oil market downturn. The Permian has also seen a jump in its drilled but uncompleted well count in 2016, the only build across major US basins, and many of the basin’s most prolific producers are forecasting double-digit production growth for years to come.
Early indications suggest energy could be one of the main beneficiaries of the new administration’s policies, given Trump is widely expected to follow through on promises to deregulate the industry. Although Trump has walked back his comments on tearing up the nuclear deal with Iran in recent weeks, some observers worry he may ultimately seek to further isolate the country, an eventuality that would likely send oil prices higher.
In any case, structural forces are healing oil markets. Global investment in exploration and production has declined significantly, with declines in 2015 and 2016 expected to be the first back-to-back drops in two decades. While resiliency in US shale may prolong the rebalancing process, it will not derail it. We expect investors in actively managed natural resources and MLP strategies as well as private oil & gas opportunities will benefit as new signs emerge in 2017 that the days of excess supply are numbered.
Global Mining Equities—Pace of Rebound Moderates. Mining equities’ recovery is likely to slow after the blistering pace set in 2016. Through November, on an index basis, the asset class has returned more than 55% year-to-date, as industrial metals prices surged. Of course, this followed a brutal multi-year downturn linked to excess investment during the 2000s Chinese boom years. The long-term future looks bright, due in large part to the severely restricted flow of capital to the industry over the past few years, but short-term challenges may mean better entry points are still to come.
Industrial metals saw some of the biggest post-US election bounces, with copper, iron ore, and zinc up double digits in November as markets seemed to focus on Trump campaign promises to invest heavily in metals-intensive infrastructure, as opposed to his stated preference for protectionist policies, particularly the threat of tariffs on China (Figure 11).

Figure 11. Industrial Metals Price Changes in 2016
January 1, 2016 – November 30, 2016 • Rebased to 0 on January 1, 2016
Sources: London Metal Exchange and Thomson Reuters Datastream.
Notes: Data are daily. Commodities quoted in US Dollars.
Miners of various metals also face supply-side concerns. While zinc should benefit from significant supply tightening due to the upcoming closure of several large mines, the International Copper Study Group says copper supply will exceed demand by as much as 160,000 metric tons in 2017, even with increased Chinese demand. Many observers expect copper and aluminum markets will remain oversupplied for the next few years as new capacity comes online.
Still, supply excesses have eased from recent peaks, and we believe the market offers long-term value. At the end of third quarter 2016, the metals and mining industry made up a paltry 1.5% of the MSCI World Index, below its 20-year average of 2.3%. While we expect performance to moderate in 2017, given how fast prices have rebounded, long-term selective investors in mining equities are likely to be rewarded.
Commodity Futures—Exposure Remains Expensive. Although commodity futures appear set to end their string of negative annual performance in 2016, driven in large part by outsized gains from industrial metals, precious metals, and softs, we continue to think investors seeking commodity exposure will fare better with natural resources equities. In weighing the risks, we doubt commodity spot price improvements will sufficiently compensate for the asset class’s implementation headwinds.
Consisting of negative roll yields and listless collateral yields, those implementation headwinds have cost the Bloomberg Commodity Index more than 10 ppts of return in the trailing 12-month period. Some markets characterized by steep levels of contango have moderated in recent months, as supply/demand fundamentals have tightened, but high levels of inventory in a host of markets appear set to weigh down prices of near-month contracts for at least the near term.
Further, the positive performances in some commodity markets post-US election—no doubt tied in part to the expectation of large infrastructure spending in the United States—would be at risk if the policies pursued by the Trump administration resulted in new restrictions on global trade or a further strengthening in the US dollar. While several commodities are trading near or below long-term inflation-adjusted levels, other real asset options are more compelling.
Summary
Prospects for real assets are broadly positive for 2017, given investors are likely to place value in assets offering income, diversification, and inflation-protection potential in the changing political environment. Across real assets, our favorable view is backed by solid or improving fundamentals, from the tight real estate construction pipelines in the United States and continental Europe to the declines in energy and mining capital expenditures. While our optimism doesn’t extend to all real asset categories—clear near-term weaknesses exist in UK property and commodity futures—investors with positions that are low relative to policy should consider whether that call remains appropriate.
Sovereign Bonds: Return of the Bond Vigilantes
Stephen Saint-Leger, Managing Director
After years of expansionary monetary policies, markets began to signal in 2016 that they had had their fill. Major developed markets sovereign bond yields are on the rise, though with yield curves shifting in different ways in different markets, investors will need to consider carefully the impacts to their deflation-hedging portfolios.
2016 in Brief
The year was neatly divided into two halves, with the first six months providing a continuation of the great bond bull market—by early July, ten-year US Treasury yields plunged to record lows around 1.37% in the wake of fears over China, unexpectedly weak US growth, the expansion of the ECB’s QE program, and finally the UK’s referendum on EU membership. As desperate attempts by central banks in continental Europe and Japan to boost credit creation (and therefore leverage) through an “Alice in Wonderland” world of negative interest rates on cash continued to be ineffectual, markets assumed the risk of higher rates had been banished for years to come. In Germany, investors paid for the privilege of lending to the government at a fixed rate for ten years, and the entire Swiss yield curve went negative. UK gilts plumbed three-century lows after the “Brexit” referendum.
Please see Aaron Costello, “Is the Bond Bull Market Over?,” CA Answers, November 15, 2016.
Less than six months on, the outlook is diametrically opposed (Figure 12). Gilt yields have nearly round-tripped, and even yields on German bunds and JGBs have made feeble attempts at rising. In the United States, while considerable uncertainty still surrounds the actual changes in policy President-elect Donald Trump will be able to make, there are some near certainties. Just as a vote for Brexit was very likely to cause a big fall in sterling, the imminent Trump presidency seems a good bet to have finally killed off the great (three-decade plus) bull market in US Treasuries.
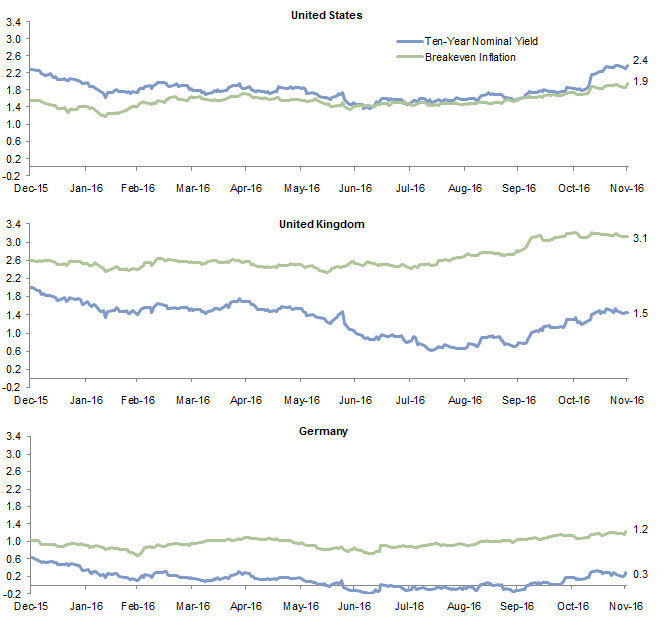
Figure 12. Ten-Year Nominal Yields and Breakeven Inflation
December 31, 2015 – November 30, 2016 • Percent (%)
Sources: Bank of England, Barclays, Bloomberg L.P., Federal Reserve, and Thomson Reuters Datastream.
Note: Data are daily.
Even before November 8, sovereign bonds were beginning to show signs of weakness and implied breakeven inflation moved up, particularly in the United Kingdom and United States (Figure 12). Benchmark yields for ten-year US Treasuries had risen about 50 bps above their summer lows, mirroring a stealth rally in inflation and some signs of rising wages. While commentators remained fixated on the risk of deflation, the US CPI quietly ratcheted up to 1.6% year-over-year in November, while so-called core inflation was 2.1%. In Europe, meanwhile, inflation trended up to 0.6% in November.
Looking Ahead to 2017
In the immortal words of US political strategist James Carville, “I used to think, if there was reincarnation, I wanted to come back as the president or the pope . . . . But now I want to come back as the bond market. You can intimidate everybody.”
The US long bond lost around 5% of its value on November 9, the second-worst fall since records began, as yields on 30-year Treasuries soared close to 25 bps, potentially setting the stage for a prolonged tussle between the bond market and the incoming administration.
The Trump agenda includes both personal and business tax cuts and increased spending on infrastructure—financed by cheap debt and public-private partnerships—adding up to an expansionary fiscal policy. What this means for public finances and increased supply of new Treasuries is less clear. The Tax Policy Center estimates the tax cuts will lead to a rise in the federal debt of more than $7 trillion over ten years, while Anthony Scaramucci, a member of the president-elect’s economic advisory council, cites estimates that infrastructure spending has a 1.6 economic multiplier (i.e., every dollar of spending results in $1.60 in growth). While neither of these numbers will prove precise—plans are rarely implemented as proposed and models purporting to show their impact are often inadequate—larger federal deficits in the years ahead seem a safe bet.
Still, if the new administration is able to entice the estimated $2.5 trillion that US corporations have stashed abroad into coming home by putting a one-off 10% levy in place, as well as reducing corporate tax rates from 35% to 15%, the actual increase in budget deficits will likely be lower than the sum of the announced measures. In short, the bet is whether the United States can repeat the trick of the post–World War II era and grow itself out of the high debt/GDP cul-de-sac it has been trapped in since the financial crisis.
On the inflation front, it is also reasonable to assume the era of cheap imports from emerging markets taking an ever greater market share of sales in the United States has hit an inflection point, unless trade partners accept the need for greater reciprocity and access to their markets as a price worth paying. As noted, inflation has returned in Europe, and UK inflation is also on the rise. If protectionist policies are implemented in the United States and elsewhere, that probably spells much higher inflation than the still modest market-implied rates. These potential changes argue for the increased attractiveness of inflation-linked bonds in investors’ portfolios relative to conventional bonds, particularly US TIPS.
So, we come back to the final arbiter of all these shifts—the bond market. While higher nominal yields will increase the attractiveness of US bonds to foreigners still mired in the old deflationary policy mix (essentially Europe)—especially if the US dollar is rising—US investors will want to avoid the capital hit on bonds with minuscule protection from coupons. Worse, to the extent that rising real yields reflect stronger economic growth, the nominal jump in yields should be even greater than the rise in inflation.
In short, the US bond market is at risk of a stampede of money trying to exit at the same time, causing yields to (temporarily?) spike to levels that could cut the grass from under the feet of any rally in highly valued and leveraged risk assets. Such a turbulent period would create its own feedback loop, with the new administration possibly needing to acknowledge the power of the bond market to derail its plans. This could mean watering down the extent of the fiscal boost by reducing the scope of the infrastructure program, giving a higher weight to public-private partnerships, or softening the pace of tax cuts.
In Europe, core sovereign bond yields are being pulled up by the prospect of a weaker euro as the principal transmission mechanism of higher growth and inflation rather than a change in policy mix. This spells a continuation of the widening yield gap to US Treasuries. Yield spreads on some non-core European sovereign bonds are expected to continue to widen as the region grapples with a full calendar of political events, including general elections in France and Germany, that could ratchet up anxiety again regarding the survival of the single currency.
In the United Kingdom, the government’s room to maneuver is hemmed in by deterioration in public finances relative to expectations, due to sub-par growth. The continuing uncertainty over the timing and circumstances for the triggering of the exit process under Article 50 means gilts are reacting to newsflow. While there has been little evidence of a Brexit hit to the economy so far, this could change once the exit process is actually underway. For this reason, UK gilts are likely to follow a volatile path, torn between the fear of rising imported inflation and the likelihood of continuing financial repression administered by the BOE, should the arrival of Brexit damage growth.
Investors will also want to keep an eye on gold. After a stellar first half of 2016, gold has been under pressure, and will continue to be so in the near term as real rates rise and the US dollar strengthens. But the probability that some monetary assistance will once again be needed to keep the bond vigilantes from running rampant means that real yields may be suppressed again at some point, and the last hedge remaining will be gold.
Summary
The implication of these dynamics for investors are, first and foremost, making sure deflationary hedges are sufficiently low duration to withstand a larger-than-expected short-term spike in yields. If nominal growth rises to 4% over the next ten years, ten-year Treasury yields will not stay close to 2%. Second, rising Treasury yields will pull up yields globally as other countries import inflation via depreciating currencies. Third, investors should stay alert and poised to lock in higher bond yields if and when the rise proves self-defeating (i.e., causes growth to stall). Not only could nominal bonds soon be trading at fair value, but the opportunity may present itself to lock in attractive long-term real yields in TIPS if they enter the lower bound of our fair value range around 0.7% real yield.
Currencies: The Path of Least Resistance
Aaron Costello, Managing Director
Currency markets are likely to remain volatile given rising political uncertainty and diverging monetary policies, yet ultimately we see the US dollar remaining strong in 2017 as European and emerging markets currencies face renewed downward pressure. The renminbi, in particular, may weaken as China seeks to keep rates low at home and offset the impact from potential protectionist policies in the United States. How markets respond to RMB weakness remains to be seen, but ultimately we see the US dollar remaining a safe haven despite the uncertainty presented by President-elect Donald Trump’s incoming administration.
2016 in Brief
Currency markets were highly divergent in 2016 (Figure 13). For most of 2016, the Japanese yen surged versus the US dollar and emerging markets currencies rallied, while the euro was relatively flat and the UK pound plummeted following the “Brexit” referendum in June. The dominant theme of a dovish US Federal Reserve and consequent weak US dollar began to reverse in September, and especially in the wake of the November US elections. The US dollar has sprung back to life on the belief that the Fed will hike rates in December and a Trump-sized fiscal stimulus package will boost US growth and inflation.

Figure 13. Year-to-Date 2016 Currency Movements
As of November 30, 2016 • Rebased to 100 on December 31, 2015
Sources: MSCI Inc. and Thomson Reuters Datastream. MSCI data provided “as is” without any implied or express warranties.
Notes: Data are daily. EM Currencies is based on the implied basket of 23 countries that make up the MSCI Emerging Markets Index.
Looking Ahead to 2017
While there are many uncertainties facing markets, the path of least resistance in the near term is for the US dollar to grind higher amid rising political uncertainty in Europe and the prospect of additional Fed hikes. Market-implied probabilities for a hike in December are very high, and expectations for 2017–19 have also jumped. Whether a December hike translates into further increases in 2017 remains to be seen (we’ve seen this movie before), especially given the lack of policy details from the incoming administration. Yet given Republican control of Congress, some combination of tax cuts and infrastructure spending seems likely, even if much lower than initially advertised. The Fed will likely view this as potentially inflationary and thus be willing to tolerate a strong dollar as an offset; in other words, we do not expect renewed USD strength to prevent the Fed from hiking.
Please see Eric Winig, “Brexit: Outlier or Harbinger?,” Cambridge Associates Research Brief, July 20, 2016.
Additionally, with the upcoming elections across Europe (particularly France and Germany), and the fact that negotiations over Brexit have yet to start in earnest, the US dollar begins to look like a relative safe haven. As a result, we expect the euro to remain weak in 2017, as the potential for electoral gains by anti-establishment and anti-EU parties cannot be dismissed. Indeed, the European Union and even the euro itself might face a renewed existential crisis in 2017. At a minimum, this will keep the ECB on the dovish side until the political uncertainty lifts.
Please see Aaron Costello, “Has the GBP Bottomed? Not Likely,” Cambridge Associates Research Brief, July 20, 2016.
The same goes for the pound; we expect continued weakness versus the US dollar with a move below 1.20 likely, given that although the recent sell off is large, it is not yet extreme. Thus, we don’t view the pound as fully-priced for the risk of a “hard Brexit.” Uncertainty over the actual terms of the UK’s exit from the European Union, especially in regard to trade and financial market access, will weigh on the pound over 2017. Yet, given the steep fall already seen in the pound, the downside may be limited, particularly versus the euro. Said differently, we expect the pound to weaken, and the euro may weaken even more.
Regarding the Japanese yen, the currency has only given up half of its 2016 gains versus the US dollar, implying a return to the USD/JPY 120 level is quite feasible should US rates continue to rise. This is especially the case given that the BOJ has pledged to keep ten-year JGBs at 0% until inflation overshoots its target, further widening the yield spread in favor of USD assets.
Indeed, if history is a guide, the USD bull market has more to run. The previous two cycles were roughly seven years in duration, two years longer than the current rally (Figure 14). While the US dollar may have more to rise on the back of rising US growth, it is worth noting prior USD peaks occurred during rate hike influenced recessions.

Figure 14. US Dollar Bull Markets
As of October 31, 2016
Source: Thomson Reuters Datastream.
Yet nothing says history must repeat. Perhaps the biggest wildcard for the economic and currency outlook is the rise of protectionism and an anti-globalization backlash across the developed world. Trump won votes largely on the back of pledges to renegotiate US trade deals and bring industrial jobs back to hard-hit US communities. It remains to be seen to what extent he will fulfill those promises, but it is clear the political winds have shifted against the free-trade consensus that has underpinned the global economy for the past few decades.
Protectionism is by nature inflationary as it increases the costs of imported goods, while also reducing supply and pushing up domestic prices. At best, protectionist policies will create modest inflation that will require modest monetary tightening. At worst, they can create the conditions for “stagflation” should a global trade war erupt, hitting global growth while pushing prices higher.
For now, all we can surmise is that rising protectionism will likely weigh further on emerging markets currencies, halting the rally seen over much of 2016. While emerging markets currencies appear slightly undervalued versus the US dollar in real terms, they are far from the depressed valuation levels seen in 2000–02. Thus, downside risks remain.
Please see Aaron Costello, “RMB Risks,” Cambridge Associates Research Brief, February 5, 2016.
Investors will need to keep a particularly close eye on China, which finds itself in a difficult position as the PBOC needs to keep rates low to support the economy and help roll over large debts in the corporate sector. Figure 15 shows how the RMB/USD exchange rate follows the China-US two-year yield spread. If China hikes rates in tandem with the Fed to support the RMB, that will put downward pressure on the Chinese economy, risking a “hard landing.” While keeping rates low and the RMB weak could trigger tariffs from the Trump administration, the PBOC may reason this will happen anyway, so it might as well continue to let the RMB weaken. Our view remains that China will prioritize keeping interest rates low, and therefore we expect continued RMB weakness. For much of 2016, investors have been blasé about a weakening RMB. That calm will be tested in 2017, particularly if the Trump administration decides to make good on its campaign promises of taking a tough stance on trade, toward China in particular.

Figure 15. USD/CNY Exchange Rate and the Two-Year Yield Spread
July 31, 2007 – November 30, 2016
Source: Thomson Reuters Datastream.
Summary
Rising interest rates and rising political uncertainty should benefit the US dollar relative to European and emerging markets currencies over the next year or so, as history implies the path of least resistance for the dollar is up. Yet the rally in the US dollar will not be a straight line, and the currency may have already risen too far and too fast following the US election in the absence of concrete policy proposals from the Trump administration. But a period of near-term consolidation aside, additional USD strength is likely in 2017.
Please see Himanshu Chaturvedi and Kate Miller, “Strategic Currency Hedging Policy: A New Framework,” Cambridge Associates Research Report, 2016.
The currency swings of 2016 showed how rock-bottom rates make currencies very sensitive to changes in monetary policy. This volatility has raised the issue of currency exposures and hedging. In general, we advise investors to develop a strategic currency policy before trying to make tactical calls on currencies, in light of the sharp reversals seen in many currency pairs in 2016. A strategic hedging policy (which may include the decision to not hedge foreign currency exposure) provides a framework to deal with rising currency volatility, instead of being whipsawed by it.
Putting It All Together: Hedge Your Bets
Celia Dallas, Chief Investment Strategist
Change is in the air and the prospect for a bit of sunshine to break through the overhang of slow growth and lower-for-longer yields is palpable. Since late summer, markets have begun to price in reflation expectations with bond yields rising, financials firming, and cyclicals generally outperforming on expectations that fiscal policy will take over the reins from monetary policy.
Will fiscal stimulus be able to meaningfully increase global economic growth? Will firmly entrenched deflationary forces shift to inflationary pressures as the deflationary winds of globalization are reversed under more protectionist policies? What are prospects for these policies to offset any growth? And what should investors make of all the potential wildcards on the horizon related to geopolitical risk, including prospects for the maintenance of European institutions as Italian banks struggle, the United Kingdom negotiates its exit from the European Union, and at least 60% of the Eurozone faces important elections in 2017? The surest call to make for 2017 is that higher growth expectations will be paired with the distinct possibility of negative outcomes, putting a premium on diversification and liquidity management.
In our review of the outlooks for major asset classes, we’ve noted that an environment of improving economic growth and still historically low bond yields, along with largely absent equity valuation extremes, should be supportive of developed equity market performance, but downside risks remain elevated. In emerging markets equities, valuations are still low, particularly on a relative basis, but risks including a Chinese debt crisis keep us watching these markets closely. Within credits, more niche opportunities seem better positioned than traditional high-yield bonds. Commodity-related assets, which may stand to benefit the most from President-elect Donald Trump’s policy agenda, have seen many of the potential benefits quickly priced in. The early July low that may have marked the end of the 35-year bull market in US Treasuries creates the need to carefully review deflation-hedging portfolios. And strong currency moves could continue, with US dollar strength over 2017 the most likely possibility.
These views, combined with the number of economic and political wildcards, suggest that investors should make sure portfolios are aligned with risk tolerance and return objectives and positioned to persevere in a variety of environments. Periods of volatility surrounding elections and referendums should be expected, making diversification and liquidity provisioning critical. This includes stress-testing portfolios, principally with regard to liquidity, in varied stressed environments. For US investors in particular, this includes evaluating the ability to navigate a period of rising rates in which inflation exceeds expectations.
Even with their recent increase, bond yields remain low, dragging down prospective returns for a variety of asset classes. We remain concerned that capital markets are unlikely to deliver most investors’ long-term return objectives over the next five to ten years. To improve the likelihood of meeting return objectives while maintaining adequate defense, taking into account our views on the outlook for individual asset classes, we recommend the following:
- Seek value-added returns in a variety of private investments, expanding beyond traditional venture capital and private equity into less economically sensitive strategies (e.g., royalties) as well as private credit strategies seeking to take advantage of regulatory change and banking disintermediation, particularly in Europe. A variety of opportunities in public credits (e.g., lower-rated CLO debt, bank contingent convertible securities) also offer reasonable opportunities that may prove competitive with equities.
Please see the fourth quarter 2016 edition of VantagePoint, published October 17, 2016, and Gene Lohmeyer et al., “Befriend the Trend: An Overview of Managed Futures Investing,” Cambridge Associates Research Report, 2014.
- Revisit defensive positions, while maintaining a neutral allocation to risk assets. We would hold the bare minimum of sovereign bonds (outside of those hedging long-dated liabilities) supplemented by cash. The advantage of cash is it can serve as a liquidity reserve under most negative environments for risk assets and can serve as dry powder for investing in cheap assets as opportunities develop. However, with a steeper yield curve, the opportunity cost compared to bonds is higher, making a barbell portfolio strategy that includes allocation to higher returning assets (e.g., private investments, lower quality credits) essential to reduce cash drag on performance. Trend-following strategies, such as those executed by CTAs, can provide a helpful second line of defense in a diverse range of economic environments.
- Allocate some capital to real assets that offer attractive return prospects even if commodity prices stay flat. Such investments provide some potential to boost portfolios in the event that markets discount higher inflation risks to the detriment of both risk assets and sovereign bonds. Natural resources equities, energy MLPs, and select private investments in energy as well as metals and mining offer the potential to fill such a role in portfolios.
- Limit tactical positioning within global equities, as the heightened uncertainty and lack of very cheap valuations limit the prospects for outsized, risk-adjusted gains. We would tread carefully in emerging markets equities, which are somewhat cheap, but no longer at extreme discounts, and face potential headwinds from a strong US dollar and higher rates. Modest overweights relative to more expensive US equities are still reasonable, particularly for patient, long-term investors.
See the second quarter 2016 edition of VantagePoint, published April 21, 2016.
- Small tilts toward value may be attractive today, but we would limit such overweights at this time. In April, we had expressed a preference to overweight value through exposure to the cheapest segments—natural resource equities and emerging markets. Value stocks were not particularly cheap relative to the broad market and we were skeptical that the reacceleration of global growth/earnings and the recovery in the financial sector that are both necessary for sustained outperformance would materialize. Today, we would broaden out value exposure to diversify the value overweight, as growth is now more likely to materialize and higher yields lift prospects for the financial sector and value stocks more generally. The outperformance of value from its recent bottom relative to developed markets as a whole has been just 4 ppts since the end of 2015, only a fraction of the outperformance seen in past value cycles.[11]The MSCI World Value Index outperformed the broad MSCI World Index by 26 ppts from March 31, 2003 to December 31, 2007; by 21 ppts from February 29, 2000 to August 31, 2001; by 13 ppts from December … Continue reading Relative valuations are near historical averages, providing room for this trend to run, should it persist. However, the nascent value cycle is vulnerable to a slowdown in growth, so we would size this accordingly small and be prepared to trim losses if threats to growth begin to materialize.
- Finally, in a low return environment, investors must consider prospects for reducing spending given the difficulties in meeting return objectives that would support current spending levels while maintaining purchasing power. Similarly, looking to cut costs, including negotiating for lower fees and improved terms from managers, is an appropriate and powerful means for improving portfolio returns.
List of Acronyms
BOE: Bank of England
BOJ: Bank of Japan
bps: basis points
CAGR: compound annual growth rate
CLO: collateralized loan obligation
CMBS: collateralized mortgage-backed securities
CPI: Consumer Price Index
CPPI: Commercial Property Price Index
CTA: Commodity Trading Advisor
EBITDA: earnings before interest, taxes, depreciation, and amortization
ECB: European Central Bank
EMU: European Monetary Union
EPS: earnings per share
EUR: euro
GBP: British pound
IMF: International Monetary Fund
JGB: Japanese government bond
JPY: Japanese yen
MLP: master limited partnership
NAFTA: North American Free Trade Agreement
NCREIF: National Council of Real Estate Investment Fiduciaries
NPL: non-performing loan
P/E: price-earnings ratio
PBOC: People’s Bank of China
ppts: percentage points
QE: quantitative easing
REIT: Real Estate Investment Trust
RMB: Chinese renminbi
ROE: return on equity
USD: US Dollar
Other contributors to this report include Anne Richardson, Eric Winig, Hope Brown, Stuart Brown, Joseph Comras, Jimmy Crivella, Alexandra Deceder, TJ Scavone, Brandon Smith, and Han Xu.
Footnotes