With stocks markets across the globe rallying in July, investors seem to have recovered from the “Brexit shock” triggered by the June 23 referendum on whether the United Kingdom should leave the European Union. The main casualty of the “Leave” vote has been the British pound (GBP), which tumbled from GBP/USD 1.48 on the eve of the referendum to $1.29 on July 6—a decline of 13% accompanied by some of the largest intra-day swings on record.[1]All exchange rates quoted are based on WM/Reuters 4pm London fixings, provided by Thomson Reuters Datastream. Intra-day highs and lows have been larger.
Since then the pound has staged a modest rally, reaching $1.33 on July 14 as Theresa May emerged as the new prime minister, helping to alleviate some of the political uncertainty the Brexit vote has unleashed. Still, the pound remains at levels versus the US dollar not seen since the mid-1980s.
Does this mean the pound has bottomed? Unfortunately, history implies there is more downside for the currency, potentially taking the pound toward $1.20, if not lower. The catalyst for renewed weakness will be how the Bank of England (BOE) responds to the economic impact of Brexit, and more importantly how the negotiation process with the EU unfolds and what sort of trade and financial market access is achieved. Ultimately, we expect the pound to remain volatile and range bound, as the long road to Brexit is just starting.
Recent Declines in Context
While the post-Brexit decline has rattled investors, the reality is that the pound has been weakening for the past two years. From the pound’s 2014 peak of $1.72 to its July 6 low, the currency has fallen 25% versus the US dollar. While this is a large move, it is still less than the 35% decline amid the global financial crisis in 2007–09 and the 29% fall over 1992–93 in the aftermath of the United Kingdom’s exit from the European exchange rate mechanism, when George Soros “broke” the BOE. The two largest declines in our dataset are 39% from 1972 to 1976 and a stunning 58% from 1980 to 1985. The latter period coincided with extremely high inflation in the United Kingdom and a rapidly rising US dollar amid the high interest rates imposed by the Paul Volcker–led US Federal Reserve.
Of the seven previous declines we analyzed, the median decline is 29%, while the average decline is 32%. Relative to the pound’s 2014 high, this implies a median decline to $1.21 (5.8% below the recent low) and an average decline to $1.17 (8.9% below the recent low). Thus any fall to or below $1.20 would put the current decline in line with history. Yet consensus forecasts do not see the pound falling quite so far. As of July 18, of the 30 forecasts submitted to Bloomberg since July 1, the median GBP/USD forecast for year-end 2016 is 1.26, with a high of 1.35 and a low of 1.16. Still, the consensus view remains that the pound has not yet seen its bottom.

Historical Declines in GBP/USD
January 1, 1972 – July 6, 2016 • Percent (%) Decline From Recent High
Sources: MSCI Inc. and Thomson Reuters Datastream. MSCI data provided “as is” without any express or implied warranties.
Notes: Data are daily. As of July 20, 2016, the recent low in the GBP/USD exchange rate was July 6. This does not imply the pair has reached a final low for this cycle.
What Is “Fair Value” for the Pound?
From a valuation perspective, the pound looked cheap on our real FX metric at its July 6 low, 10% below its historical median since 1971. The currency is approaching levels (in real terms) at which it has bottomed over the past 30 years.[2]Our primary valuation metric for currencies is real exchange rates using monthly history; thus, valuations at the absolute bottom are likely slightly lower. We create a real exchange rate history … Continue reading However, the United Kingdom has been part of the EU since 1973, raising the question of whether the past 30 years are relevant.
Said differently, does Brexit drastically lower the “fair value” for the pound, and could the downside be much greater than historical data suggest? Currently, our real FX framework implies a fair value for GBP/USD of 1.43. Valuations are only a partial guide under normal circumstances, and historical analysis is always at risk of missing structural changes—and an exit from the EU is nothing if not “structural.”

GBP/USD Valuations: Real Exchange Rates
January 31, 1971 – July 6, 2016 • Percent (%) From Historical Median
Sources: MSCI Inc. and Thomson Reuters Datastream. MSCI data provided “as is” without any express or implied warranties.
Notes: Data are monthly, except for most recent data point, which is as of July 6. Real exchange rates are based on relative consumer prices, which are as of June 30. Historical median is calculated from June 1971 onward.
Thus, at this juncture, estimating any notion of fair value for the pound is difficult, given that so much depends on the terms of the trade and financial market access agreements the United Kingdom reaches with the EU, and whether the United Kingdom actually decides to invoke Article 50, the formal process by which an exit can begin. Prime Minister May has stated that she will not invoke Article 50 this year, and markets have taken relief that the United Kingdom now has a prime minister and time before the nitty-gritty debate with the EU starts. But to think that the pound has bottomed before a deal has been formally discussed seems a bit premature, especially given that the recent fall in the pound is not especially large.
The United Kingdom is still at the beginning of this process, not the end. A fall in the pound to between $1.20 and $1.15 should be sufficient to price in an adequate level of uncertainty and allow the currency to stabilize once the inevitable political gridlock sets in.
Examining the Worst-Case Scenario
Is this view too naïve? History implies even larger declines could occur. What could the worst-case scenario be? One possibility is that Brexit leads to the dissolution of the United Kingdom itself, with Scotland separating from England and Wales to join the EU, and the potential for Northern Ireland to follow suit. The assumption is that the end of the United Kingdom would be bad for the pound, although during the 2014 Scottish referendum, some economists argued that Scotland leaving would be bullish for the pound, given the large fiscal transfers sent north.
But assuming a UK breakup is pound negative, how low could the currency go? When looked at as a whole, the period from 1980 to 1985 was a massive bear market for the pound, as rampant inflation and a strong US dollar saw the pound fall 58% (from $2.46 to $1.04). If such a move is the ultimate outcome of Brexit, this implies the pound wouldn’t bottom until $0.73. We have yet to see a forecast seriously considers such a level, although economist George Magnus was quoted in the Financial Times on July 7 stating that parity with the US dollar was possible, but $1.15 was his base case. Of course, anything is possible and the fact that no one has forecasted a value below parity doesn’t mean it couldn’t occur.
For now, a 40%–60% decline in the pound is not our base case because the two largest declines in the pound noted earlier occurred amid massive inflation and a serious negative interest rate differential versus the US dollar. Though not perfectly correlated, the general direction of the GBP/USD follows the UK–US ten-year government bond spread. While the spread today is negative, it is not yet on the level of 1984. And UK inflation was over 20% in the 1970s and early 1980s, versus under 2% today.
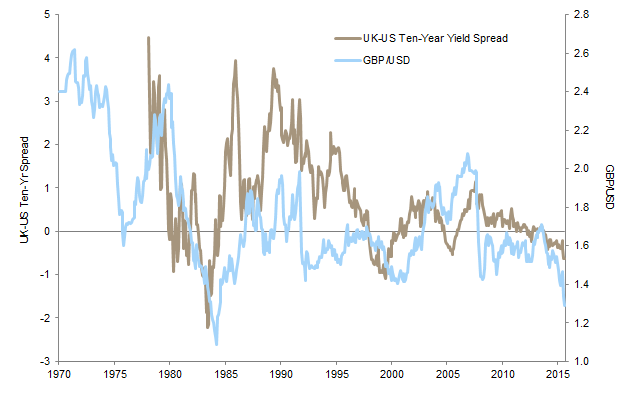
UK-US Ten-Year Yield Spread and the GBP/USD Exchange Rate
December 31, 1970 – July 6, 2016
Sources: MSCI Inc. and Thomson Reuters Datastream. MSCI data provided “as is” without any express or implied warranties.
Note: Data are monthly, except for most recent data point, which is as of July 6.
Notably, both of the major declines took more than four years and occurred in a series of large drawdowns punctuated with periodic 10%–20% rallies—it wasn’t a straight line down (although in hindsight it looks so). Such a decline could be the ultimate outcome of a messy political and economic divorce, but also one that will be years in the making, not months.
For more on the potential challenges facing the euro, please see Eric Winig, “Brexit: Outlier or Harbinger?,” Cambridge Associates Research Brief, July 20, 2016.
However, this analysis depends on the assumption that the EU itself stays intact. But what if Brexit also results in an EU breakdown, as member states try to renegotiate their terms or outright leave? Such an outcome could (1) prevent the United Kingdom from breaking up (what would Scotland join?), and (2) may result in the euro becoming the biggest casualty, which would soften the blow to the pound. In other words, the worst-case scenario for Europe may prevent the worst-case outcome for the United Kingdom.
And any scenario analysis must also consider the possibility the Brexit gamble pays off, with the EU striking a quick and favorable deal for the United Kingdom, or that the United Kingdom reconsiders and ultimately decides to stay in. In the recent past both Denmark and Ireland have held EU-related referendums that were initially defeated, only later to be approved with a second referendum.
Many Moving Parts
It should be clear that there are many moving parts, all of which are political in nature. With the decision on a prime minister settled, however, the key driver of the pound in the near term is the BOE. While the BOE did not cut rates at its July meeting, it did indicate monetary policy would be loosened in August. The BOE has already cut the capital requirements for banks in an attempt to ensure there is ample liquidity in the UK banking system.
Investors may gain some comfort from the reduced risk that Brexit will trigger a “Lehman moment”—when a financial institution goes under for lack of liquidity—in the United Kingdom, as the BOE has been very proactive here. While headlines of property funds invoking gates may remind some investors of 2008, such moves are actually a prudent, proactive step to avoid liquidity mismatches, rather than a reactive move amid a liquidity panic.
The Bottom Line
While the pound has recently rallied, the currency has not seen the bottom; a fall in the pound below $1.20 and toward $1.15 should be enough to price in uncertainty for now and put the current decline in line with history. From that point on, we expect the pound to remain in a wide range, perhaps between $1.15 and $1.40. Indeed, if $1.40 used to be the floor for the pound when it was in the EU, perhaps now it has become the ceiling.
Ultimately, political and economic uncertainty in Europe will help support the US dollar, even if the greenback remains weak for the rest of the year. The US presidential election will take center stage soon, adding a new dimension to the political drama this year. In the meantime, US economic data will be key to watch. If the US economy doesn’t falter, then the outlook for US rates may rapidly reprice, which could send the pound lower as UK–US bond yield spreads widen further.
Aaron Costello, Managing Director
Han Xu, Investment Associate
Footnotes