Advice in Brief
- Fears of a deflationary spiral to start the year dramatically shifted over the first quarter, and a belief that the world will muddle through returned. We continue to believe a slow growth environment will persist, and recommend a neutral exposure to risk assets coupled with adequate defense through diversifying assets that could provide a source of funding for spending needs and opportunistic investing as the cycle progresses.
- We are unenthusiastic about the growing use of negative rates. At the moment, we continue to recommend leaning into Eurozone and Japanese equities relative to US equities, but are watching developments in earnings carefully. Take a slow approach to rebalancing for now.
- The nascent leadership in value equities is dependent on sustained outperformance from financials and energy. Continue to own value, focusing on pockets that offer the best reward relative to risk rather than broad value equities. Energy-related assets and emerging markets equity seem a better way to obtain value-based exposures today. At the same time, we are keeping a close eye on credits in search of value opportunities.
- Bond markets are not pricing in adequate inflation expectations. TIPS offer modest opportunity to outperform relative to nominal Treasuries.
Portfolio Tilts from CA’s Chief Investment Strategist

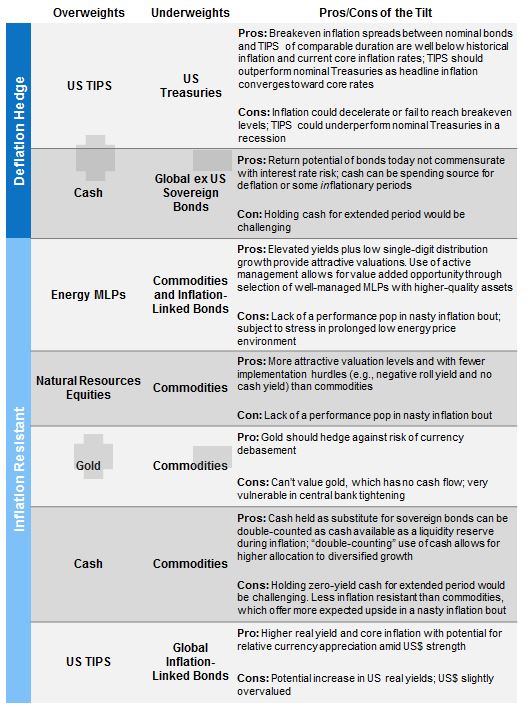
From maximum pessimism to meh. Fears of a deflationary spiral and recessionary pricing in many markets to start the year dramatically shifted over the first quarter, and a belief that the world will muddle through returned. Until late January, yields of high-quality sovereign bonds were pushed to fresh lows, commodities plummeted, credit spreads widened, and cyclical stocks sank well below defensive stocks only to sharply rebound after February 11. It is difficult to point to any singular cause of this reversal, as a confluence of prevailing trends and events in January and February pushed markets to hugely oversold positions that ultimately led to short covering and unwinding of hedges as news flow became less negative. The easing of US dollar strength after the European Central Bank’s (ECB) December announcement and subsequent pullback in US Federal Reserve tightening expectations, oil production declines outside of OPEC, improvement in growth in China, and firming of the renminbi helped emerging markets equity and debt, commodity currencies, commodities, and natural resources equities (NREs) snap back sharply. Despite the broad asset appreciation since February, we believe a slow growth environment will persist. We continue to recommend a neutral exposure to risk assets coupled with adequate defense through diversifying assets that could provide a source of funding for spending needs and opportunistic investing as the cycle progresses.
In this edition of VantagePoint, we discuss the potential implications of negative interest rate policy (NIRP). As a preview, we are not enthusiastic about prospects for negative rates and believe they will be counterproductive. In addition, we consider the potential for sustained outperformance in value stocks, which experienced a sharp revival in the second half of the first quarter. The ability of value to hold the lead depends on the degree to which economic and earnings growth reaccelerate, and, in particular, on outperformance of sectors dominating the value indexes. The latter has been unusually important in this cycle of value underperformance. Overall, despite the underperformance, value on the whole is not that cheap. The deepest value is concentrated in energy and financials, which must turn around, at least in relative terms, for value to outperform on a sustained basis. We would continue to own value in portfolios, but would not broadly overweight just yet. Energy-related assets and emerging markets equities seem a better way to obtain value-based exposures today. At the same time, we are keeping a close eye on credit markets in search of value opportunities. Finally, we review the outlook for Treasury Inflation-Protected Securities (TIPS), which we believe offer modest opportunity to outperform relative to nominal Treasuries should headline CPI follow the increase experienced in some of the stickier prices in the index.
No More Bazookas?
Please see the second quarter 2015 edition of VantagePoint, published April 10, 2015.
The policy playbook for investors was challenged in the first quarter. After seven years of monetary policy dictating winners and losers in risk asset performance, markets failed to applaud the ECB and Bank of Japan’s (BOJ) latest rounds of easing. Of course it is early days, but the BOJ’s move to negative rates at the end of January saw the yen appreciate sharply and asset prices fall, sending clear signals to the ECB to exercise caution in implementation of further easy money policies. However, the ECB still sought to provide shock and awe in mid-March after a lackluster market response to its monetary policy expansion announcement in December. By some accounts the ECB delivered, providing more stimulus including a new targeted long-term refinancing operations (TLTRO) program with a four-year maturity (far longer than seen in the past) that amounts to paying banks to make loans. Yet, like in Japan, the euro subsequently strengthened and equities have underperformed other major markets. Certainly a dovish Fed contributed to the market reaction by putting downward pressure on the US dollar and forward rate hike expectations. Further, a stronger current account surplus in the Eurozone and Japan against a growing deficit in the United States supports such currency moves. However, at least some of the credit should go to the most recent narrative influencing the markets, namely, that central banks are running out of ammunition and the unintended consequences of policies such as NIRP may slow growth and challenge banks’ profitability.
Please see Wade O’Brien et al., “Feeling Negative About Sub-Zero Interest Rates,” Cambridge Associates Research Brief, March 25, 2016.
Undoubtedly, countries with policy rates at zero or negative levels have less room to maneuver, posing challenges as growth remains sluggish. The balance of the data suggests NIRP has delivered less-than-desired results to date. Unintended consequences of very low and negative rates are also starting to show up. In Switzerland, there is evidence that banks are increasing the interest rates charged on mortgages and cross-subsidizing commercial deposits with the excess spread earned on those loans to avoid charging wholesale and household depositors and risk a wave of deposit redemptions. By charging more to long-dated borrowers due to negative rates, banks are effectively challenging the rationale behind the policy. Further, banks are facing more asset-liability duration mismatches. As interest rates fall, borrowers demand longer-maturity fixed-rate credit, which increases the maturity on the asset side of the balance sheet relative to the liability side. Banks are compensating for the mismatch by entering into increasingly expensive hedging strategies. These actions are further eroding banks’ net interest margin. To compensate for the decline in margins, banks are reportedly increasing the fees charged on money transfers, debit cards, and ATM transactions. If banks find that their margins become too thin to withstand even a small drop in credit quality, they may begin to cut back on lending or make loan covenants stricter, further defeating the purpose of current central bank policy.
We expect that the unintended consequences of NIRP will hold back economic growth prospects. NIRP is likely to promote mal-investment (as was the case with zero interest rate policy, or ZIRP)—debt levels and housing prices are rising in most countries with negative rates. Persistence of aggressive monetary policy, particularly if it does juice growth in the short term, would continue to restrain policymakers from the challenging task of implementing structural reforms. Fiscal policy has been constrained in recent years but could be used to boost growth in Japan this year. The tragic earthquake in Kyushu makes it even more likely that Prime Minister Shinzō Abe will request a supplementary budget and further delay the planned April 2017 consumption tax increase. Implications for equities are mixed, while the outlook for bonds and financials is negative. Lower yields may push investors out the risk curve into credits and equities, but they may also push investors to look abroad for better return prospects. Lower discount rates and borrowing costs could improve earnings prospects, but the tailwind of currency devaluations is at least on pause for now, and concerns over economic growth have trumped any positive views on stronger earnings growth or more attractive valuations than US equivalents in recent months.
For now, we continue to recommend leaning into Eurozone and Japanese equities relative to US equities, but are watching developments in earnings carefully and recommend taking a slow approach to rebalancing as developments unfold. US equities have stretched valuations and are relatively advanced in the earnings cycle, in contrast to more reasonably valued Eurozone and Japanese equities that appear to have more room for earnings expansion. US equities remain expensive, and earnings are challenged by cyclically high profit margins that peaked late last year. Pressure on profit margins may increase given slow revenue growth, higher debt servicing costs, and prospects for higher wage costs as labor markets tighten. Should a weaker US dollar and higher energy prices boost US earnings, US equities could continue to outperform, particularly if European and Japanese earnings start to weaken in the face of reduced demand growth, stronger currencies, and continued pressure on their banking sectors. Importantly, it is unclear how much further central banks will go down the path of negative rates. ECB President Mario Draghi made clear that he does not expect to push further down this path, electing to expand asset purchases and encourage lending through the TLTRO program. In contrast, the BOJ’s Haruhiko Kuroda has indicated further rate cuts will be made if necessary, but given the market’s vote of no confidence in this strategy, central bankers may look for other unconventional policies. Central banks may not be out of bazookas, as their creativity seems to have no bounds,[1]For a thorough discussion of potential tools central bankers may use, see Ben Bernanke’s three-part blog post, “What Tools Does the Fed Have Left?,” The Brookings Institution, March 18, March … Continue reading but investors will need to remain diligent in considering the possible implications of these policies and adapting the investment playbook accordingly.
Where’s the Value in Value?
One of the most eagerly awaited reversals—dominance of value over the broad market and other styles—showed up in the first quarter, raising hopes that value will end its long drought and reign supreme. The ability of value to hold the lead depends on the degree to which economic and earnings growth reaccelerate, and, in particular, that sectors dominating the value indexes outperform major sectors in growth indexes. The latter has been unusually important in this cycle of value underperformance. Overall, we find that despite underperformance, value on the whole is not that cheap. The deepest value is concentrated in energy and financials, which must turn around, at least in relative terms, for value to outperform on a sustained basis. We would continue to own value in portfolios, but would not broadly overweight just yet. Rather, we would focus on the pockets of value that offer the best reward relative to risk. Today, that means energy-related assets and emerging markets equities. Within energy, our advice is unchanged: we remain most constructive on private equity energy, neutral on NREs despite their apparent cheapness (though we do continue to prefer NREs to commodity futures), and constructive on energy midstream master limited partnerships.
Uninspiring Valuations
For more on value premium cycles, please see Kevin Ely et al., “Value Strategies Down, Not Out,” Cambridge Associates Research Brief, October 30, 2015.
Based on MSCI’s developed markets style indexes, over the decade ended 2015, value stocks had underperformed growth by just above 200 bps annualized, or a cumulative 33 percentage points, the widest gap over a ten-year horizon since the decade ended early 2000 when large-cap tech and telecom stocks were in a bubble and investors were questioning the validity of value investing. Similarly, value has underperformed momentum by over 200 bps annualized, or 35 percentage points on a cumulative basis, over the same period (Figure 1). Across global developed markets equities, the value style of investing has been in its most extended rout on record, failing to see a meaningful period of outperformance against the broad market and growth for about a decade, and against momentum for about six years (Figure 2). However, during first quarter 2016, value edged ahead of growth, showing particularly strong outperformance in the United States and emerging markets. Value outperformed growth by 210 bps in the United States and by 400 bps in emerging markets; the emerging markets lead was the widest in a quarter since second quarter 2009.
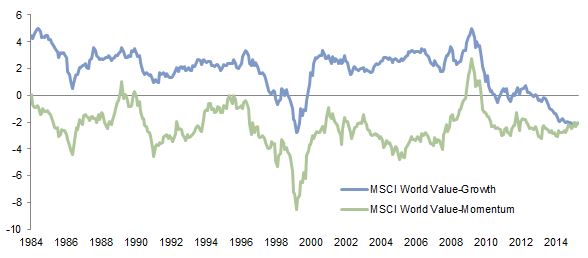
Figure 1. A Tough Decade for Value
December 31, 1984 – December 31, 2015 • Ten-Year AACR Differential (%) in Local Currency Terms
Source: MSCI Inc. MSCI data provided “as is” without any express or implied warranties.
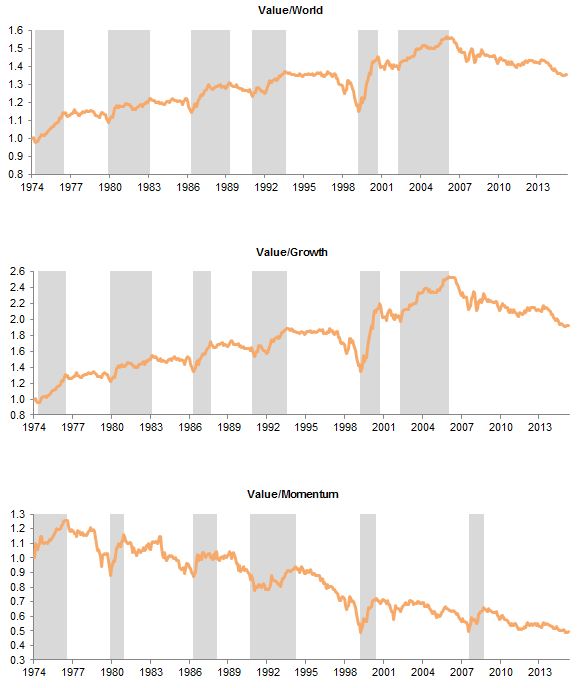
Figure 2. The Longest Period of Value Underperformance on Record
December 31, 1974 – March 31, 2016 • December 31, 1974 = 1.0
Source: MSCI Inc. MSCI data provided “as is” without any express or implied warranties.
Notes: Graphs represent relative cumulative wealth. Shading represents periods of value outperformance.
Please see Sean McLaughlin and Deborah Christie, “Alternative Beta Strategies: A ‘Smarter’ Way to Invest in Equities?,” Cambridge Associates Research Report, 2014; Sean McLaughlin et al., “Momentum: Replacing Growth Indexes as a Healthy Menu Option?,” Cambridge Associates Research Note, October 2014; and Gene Lohmeyer et al., “Befriend the Trend: An Overview of Managed Futures Investing,” Cambridge Associates Research Report, 2014.
Since 1974, value has experienced six major cycles of outperformance relative to the broad market, growth, and momentum. Value cycles were quite similar against the broad market and growth, but somewhat different against momentum, which has outperformed or kept pace with value better than either the broad market or growth. As we have discussed in previous research, momentum is a better diversifier to value than growth, as growth tends to underperform the broad market, while momentum (like value) earns a premium over time.[2]Of course, this is from the perspective of index performance, so investors should consider the ability of growth managers to add enough value to outperform the broad market over appropriate time … Continue reading
While value has underperformed growth and momentum, it is not yet at the sort of levels that historically have reliably seen reversals. Relative price-to-book (P/B) ratios today are above levels from which enduring cycles of value outperformance typically begin (Figure 3). Consider that the P/B ratio of the MSCI World Value Index is in the 50th percentile of historical valuations in absolute terms, the 47th percentile relative to the broad market, and the 49th percentile relative to growth. At current relative valuations, the historical ability of value to outperform over subsequent five-year periods has been mixed. Even relative to momentum, which is quite expensive relative to value at the 16th percentile, historical relative subsequent performance has been mixed. This is because the relationship between relative valuations and relative performance is weakest for the momentum style (Figure 4).[3]Given the momentum index has relatively high turnover, as underperformers are replaced with the best performers more frequently than stocks shift out of the growth and value indexes, it makes sense … Continue reading

Figure 3. Value Is Not Yet Cheap Enough to Signal a Turn
January 31, 1975 – March 31, 2016
Source: MSCI Inc. MSCI data provided “as is” without any express or implied warranties.
Note: Shading represents periods of value outperformance.
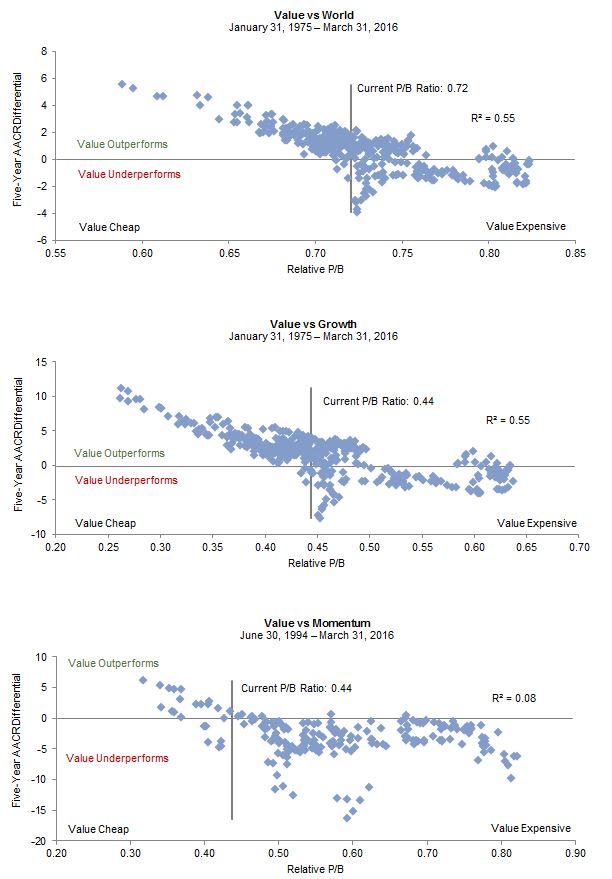
Figure 4. Relative Style Performance Is Mixed From Current Valuation Levels
Source: MSCI Inc. MSCI data provided “as is” without any express or implied warranties.
Flagging Fundamentals
A turn in the economy or the earnings cycle would be just what the doctor ordered to bring value stocks out of their funk. Historically, earnings of value stocks have tended to outpace earnings of growth stocks at inflection points in economic growth (Figure 5). In fact, relative earnings are at levels comparable to those experienced at the start of other cycles, suggesting a turnaround should be drawing near. However, performance cycles can lead, lag, or match earnings cycles. Sometimes the market moves coincident with earnings, as was the case in the value cycles that began in 1980, 1987, and 2002, sometimes the market leads the earnings/economic cycle (1991), and sometimes the market lags (2000). Further, the recovery from the global financial crisis saw value earnings sharply outpace growth, yet value’s lead was short lived and not significant enough to result in a new relative high against growth or the broad market.

Figure 5. Earnings of Value Stocks Are Relatively Depressed
First Quarter 1975 – First Quarter 2016
Sources: International Monetary Fund and MSCI Inc. MSCI data provided “as is” without any express or implied warranties.
Notes: GDP growth data are through December 31, 2015, and represent advanced economies, as defined by the International Monetary Fund. Data are quarterly. Shading represents periods of value outperformance.
Growth stocks, particularly high-quality growth stocks (also in momentum indexes at present), have been more appealing to investors in this lower-growth environment. When economic growth is slow, investors favor stocks that can produce higher rates of growth. This trend has been enhanced by investors moving out the risk curve in pursuit of higher returns in relatively safe assets in a low-yield environment. Ned Davis Research evaluated this phenomenon in the US equity market by looking at the relationship between the sensitivity of economic sector returns and their measure of coincident economic indicators. They found that faster growth favors cyclical sectors like financials and energy that are heavily overweight in value indexes, while slower growth favors consumer discretionary, consumer staples, and technology shares, which are significantly overweight in growth indexes. If the economy remains on its modest growth trajectory, value may continue to lag. However, should oil prices keep increasing and/or global economic growth surprise to the upside, value earnings should improve and the style should gain traction.
It’s All About the Sectors
Relative to growth, the vast majority of value’s underperformance can be explained by the degree to which financials and energy have lagged other sectors—particularly consumer discretionary, technology, health care, and consumer staples—that dominate the growth index. Financials, energy, and materials are the only three sectors that have not surpassed their pre–global financial crisis peak. All other sectors have surpassed that high water mark by 20% to as much as 90%. Relative to the MSCI World Growth Index, the Value Index has 2.5 times the weight to financials and 5.5 times the weight to energy. Performance attribution analyzing the impact of sector returns in explaining the difference between growth and value returns since the end of 2006 (when the last cycle of value outperformance ended) reveals that nearly 85% of the performance differential in developed markets was explained by economic sectors, with financials accounting for over half of the sector contribution (Figure 6). In US equities, the sector impact was somewhat lower, explaining 60% of the relative performance, with financials explaining over one-third of the sector contribution. This is unusual relative to history. According to a similar analysis by asset manager AJO, since the global financial crisis, 75% of value’s underperformance relative to growth was explained by differences in sector performance, in stark contrast to only 10% attribution from January 1979 to March 2009.

Figure 6. Financials Have Been the Key Driver of Value Underperformance
December 31, 2006 – December 31, 2015 • Percent (%)
Source: MSCI Inc. MSCI data provided “as is” without any express or implied warranties.
This strongly suggests that financials in particular, but also energy, will need to take leadership away from consumer staples, consumer discretionary, technology, and health care before a firm reversal in the cycle can take place. It is unclear what will improve prospects for financials, which are challenged by ZIRP and NIRP policies as discussed earlier and have been seeking to redefine their business models under increased pressure on net interest margins with a shifting regulatory landscape. On the positive front, expectations for financials are depressed. At 1.4%, 12-month forward earnings growth expectations are well below the most recent year-over-year growth of roughly 4%, which itself is low relative to the inflation-adjusted, post-2000 median of 6%. Energy and materials earnings and earnings expectations are massively depressed, but need commodity prices to rise for improvement. It appears that some commodity prices are stabilizing, although prices remain depressed and continue to spell trouble for many energy producers.
In short, value is not cheap on the whole, and prospects for an imminent turnaround are far from certain. We would focus on pockets of value across the entire portfolio rather than the value style within equities. Energy-related assets, particularly fresh capital put to work in private energy, and emerging markets equities offer the best value opportunities today.
Credit Watch
Investors are starting to get excited about credit. In a slow-growth, low-yield environment, relatively high yields on offer across much of the credit spectrum are tempting. Add in a strong reversal in performance since mid-February, and you can almost hear the stampede of inflows back into the liquid segments of the market. Like most temptations, a careful review of the label is advisable to evaluate if the rewards are worth the potential health hazards. The credit markets are bifurcated, making some credit opportunities a bit less tasty than is apparent at first glance. For example, a look at the distribution of high-yield bond market values reveals that the securities available at the index price are few and far between—over 75% of the index is priced above the 90 cents on the dollar quoted for the index as a whole (Figure 7). Further, while still below average, defaults are starting to rise and stress is leaking to areas beyond the troubled commodity-related sectors.

Figure 7. More than 75% of the US High-Yield Index Trades Above the Index Price (~90 Cents)
As of March 31, 2016 • Percent of Total Market Value (%)
Source: BofA Merrill Lynch.
Note: The chart represents the BofA Merrill Lynch US High-Yield Master II Index universe.
As risks have risen, pricing has improved, leaving us somewhat neutral on most credit strategies today provided close attention is paid to security selection and credit analysis. We now believe markets are late enough in the cycle that investors should develop a plan for moving (or not) into credit as the cycle progresses. Typically, direct lending, credit opportunities, and distressed offer the best potential as the economy moves past late-stage expansion into contraction. We are not there yet and cannot know with any certainty when the cycle will turn, but the cycle is far enough along that it is appropriate to consider how best to address the unfolding opportunity. Today, we recommend focusing on draw-down distressed and credit opportunity funds that can deploy capital as prospects develop. Committing to experienced, disciplined managers, particularly those that don’t charge fees on committed capital until the investment period begins, is a promising way to participate at this stage. Further, a lock-up structure better matches the reduced liquidity of credit securities in the post–global financial crisis regulatory environment. We would highlight that an outsized portion of the opportunity set is likely to be energy focused, which raises two caveats: (1) managers with experience in energy are a must, and (2) such opportunities should be evaluated in the context of the broad portfolio. For example, investors with sizeable dry powder (e.g., unfunded commitments) poised to target energy opportunities in private equity may already have sufficient energy exposure, and the exposure is in what we expect to be one of the best means to capture rewards from the distress hitting the sector.
At the same time, we counsel caution on leveraged loans and high-yield bonds. Leveraged loans have been pressured by both technical and fundamental factors since mid-2015. After a wild ride of spread widening and narrowing, high-yield bond spreads ended March about where they were at the end of 2015. Excluding energy, the US high-yield index option-adjusted spread is 588, not much above average.
Leveraged loans and direct lending are more appealing than high-yield, mezzanine, and capital-appreciation strategies because of their seniority. However, direct lending has two main advantages today over leveraged loans: a less liquid fund structure that better matches the liquidity of the underlying assets, along with more conservative, lender-friendly documentation. Despite this, we are cautious with direct lending given default risks are rising. Only managers with proven credit and workout credentials earned through multiple credit cycles are worth considering at this stage of the cycle.
Structured credit funds now offer investors the opportunity to acquire cash-flowing, diversified-asset pools at discounts to fair value. Price dislocations appear to be overdone in certain categories where poor technicals, the broader sell-off in risk assets, and liquidity concerns have overwhelmed solid fundamentals, producing the highest yields in several years. We expect volatility will persist and the opportunity set will shift, but today we see selective value in collateralized loan obligations (CLOs)—both the equity and junior liabilities—given segments of the market have cheapened amid regulatory uncertainty in the wake of risk retention rules in the United States and the related reduction in CLO formation. Opportunities are also opening up in commercial mortgage-backed securities and residential mortgage-backed securities as rating agency downgrades and some forced selling are improving value for select diversified cash flowing pools. As of mid-March, at least 25% of BBB CLO tranches were yielding more than 10%, with higher yields on offer for more junior tranches. All of these markets have seen spread widening amid volatility that brought spreads back to levels last seen in 2011. Skilled, nimble managers with flexible mandates covering multiple strategies and geographies have an opportunity to benefit as markets dislocate under stress and are challenged by lower liquidity and an evolving regulatory backdrop.
Tilting to TIPS
Even as headline inflation numbers increased just 0.9% year-over-year as of March, the core inflation index, excluding food and energy, increased 2.2%, down a tick from February, which was the largest annual increase since May 2012. Inflation expectations priced into the bond markets have picked up from their bottoms, but remain well below core inflation today (Figure 8). Should headline inflation increase toward core rates, as is typically the case, TIPS will benefit relative to nominal Treasuries.

Figure 8. Inflation Expectations Priced Into US Bonds Appear Too Low
January 31, 2003 – April 13, 2016
Sources: Federal Reserve Bank of St. Louis and Thomson Reuters Datastream.
Notes: Five-year breakeven inflation hit -1.40% in November 2008. The y-axis floor has been set to zero for graphing purposes.
Inflation expectations had fallen on the back of falling commodities (Figure 9). In fact, some Federal Open Market Committee members had expressed concern that inflation expectations could plummet if oil prices were to sink. While oil has recently moved in concert with inflation expectations, this has not been the case longer term. Movements in energy prices have tended to have only a transitory effect on inflation prices. Rather, headline inflation tends to move toward core inflation, which is more stable.
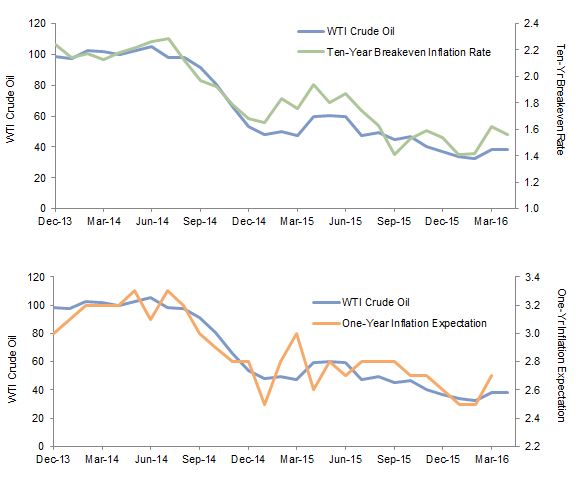
Figure 9. Commodities Influencing Inflation Expectations
December 31, 2013 – April 13, 2016
Sources: Federal Reserve Bank of St. Louis, Thomson Reuters Datastream, and University of Michigan Surveys of Consumers.
Note: One-year inflation expectations are provided by the University of Michigan and are through March 31, 2016.
The Federal Reserve Bank of Atlanta’s refined measure of “sticky” inflation is up 2.5% year-over-year as of March 1 (Figure 10). Like core inflation, which excludes the volatile food and energy price components accounting for 21% of the CPI-U index, sticky inflation excludes a wider set of volatile prices, keeping the most stable 70% of the index. Researchers at the Federal Reserve Bank of Cleveland have found that sticky inflation is more predictive of forward headline inflation. Even if you exclude rental prices, which have a controversial calculation in which owners’ equivalent rent treats home prices as if owners pay a fictitious rent, sticky CPI is still 2.0%.

Figure 10. Sticky CPI and Core CPI Have Inched Higher
December 1967 – March 2016 • Year-Over-Year (%)
Sources: Federal Reserve Bank of St. Louis FRED database and Thomson Reuters Datastream.
Note: Flexible CPI is derived from the published components of CPI that have an average frequency of change less than 4.3 months.
Inflation remains low, but the increases in core and sticky CPI along with other reliable indicators suggest it may head up, modestly approaching the Fed’s 2% inflation target. Yet inflation expectations priced into the bond market have only come up slightly from post–global financial crisis lows reached on February 12 of this year. As of quarter end, the breakeven inflation rate was 1.51% on the five year and 1.62% on the ten year. Assuming headline inflation is converging toward core and sticky CPI, TIPS are attractive relative to nominal Treasuries. Overall, yields remain pithy in real terms, -0.4% at five years, and just 16 bps at ten years, but offer more value than nominal bonds, particularly should inflation (and/or inflation expectations) increase. Thus, given the large spread between breakeven inflation and core CPI, which has been driven by the market’s misplaced weighting on oil, we should now expect spreads to close by breakeven inflation moving higher as realized CPI comes in above expectations, benefitting TIPS and dampening nominal Treasuries. While deflationary pressures remain, declining productivity and challenging demographics across many developed markets means that potential GDP is also contracting. Therefore, even as economic growth has been much slower this cycle, inflation can rise as slow demand pushes up on supply constraints.
Keep Those Seatbelts Fastened
We warned at the end of last year that markets were in for a bumpy ride as investors downgrade growth prospects and remain as “data dependent” as the Fed in determining their risk appetite. Indeed it has been. The retracement of losses in recent weeks has made our hunt for bargains more elusive, but limited opportunities do exist. Private energy and emerging markets equity appear most attractive for investors with a long-term horizon. While some of the near-term enthusiasm on emerging markets is built on the soft sand of rising commodity prices, easing US dollar strength, and support from renewed reflationary efforts in China, these investments do offer good value and long-term return potential for investors that can hold on should these short-term trends give way to the secular pressure they have been under in recent years. We continue to monitor the investment landscape and look for opportunities.
Investors should be diligent in maintaining adequate liquidity and diversification to take advantage of opportunities as they develop and to support future spending needs and capital calls.
Footnotes