Advice in Brief
Bond yields have reached extreme levels this year amid soft growth, continued central bank purchases, and negative interest rate policies, dragging down prospective returns for a variety of asset classes. Capital markets are unlikely to deliver most investors’ long-term return objectives over the next five to ten years. In such an environment, we recommend the following:
- Seek value-added returns in a variety of private investments, including private credit strategies seeking to take advantage of regulatory change and banking disintermediation, particularly in Europe.
- Revisit defensive positions, holding the bare minimum of sovereign bonds (outside of those hedging long-dated liabilities) supplemented by cash, as part of a barbell portfolio strategy, and often-overlooked trend following as a second line of defense.
- Stress-test portfolios, particularly with regard to liquidity, in varied stressed environments. In a low-growth, low-yield environment, with limited monetary policy flexibility and plenty of potential for the unexpected to derail markets, investors should make sure they have appropriate belts and braces.
- Carefully review spending and costs as another means for bringing returns and spending in line to increase the likelihood of preserving purchasing power during this challenging low-yield environment.
Portfolio Tilts From CA’s Chief Investment Strategist
Wanted: Simple, high-returning investment to offset deleterious effect of low yields on portfolio returns. If only it were that easy. Bond yields have been coming down for years, hitting extreme levels this year amid soft growth, continued central bank purchases, and negative interest rate policies. Low yields have dragged down prospective returns for a variety of asset classes, as investors have followed the intentions of central bankers by marching out the risk spectrum in search of returns no longer available in safe havens. The bid on assets offering a positive yield (stocks, bonds, real estate) has been strong this year. High-yield bonds have been among the best-performing asset classes despite weakening fundamentals, while long-suffering emerging markets debt performed even better, boosted by robust foreign inflows. Equities have also received support from low yields despite a global earnings recession.
In this edition of VantagePoint, we consider the consequences of low rates on future capital market returns and discuss the options investors have for earning what they spend. First, we acknowledge that capital markets are unlikely to deliver most investors’ long-term return objectives over the next five to ten years. We discuss means for improving prospects by seeking value-added returns in a variety of private investments, including private credit strategies seeking to take advantage of regulatory change and banking disintermediation, particularly in Europe. At the same time, investors should revisit their defensive and diversifying positions in portfolios, holding the bare minimum of sovereign bonds (outside of those hedging long-dated liabilities) and seeking out other diversifiers such as cash, as part of a barbell portfolio strategy, and often-overlooked trend following as a second line of portfolio defense. Finally, in a low-growth, low-yield environment, with limited monetary policy flexibility and plenty of potential for the unexpected to derail markets, investors should make sure they have appropriate belts and braces by stress-testing portfolios to understand portfolio vulnerabilities, particularly with regard to liquidity, in varied stressed environments. Investors should also take a careful look at spending and costs as another means for bringing returns and spending in line to increase the likelihood of preserving purchasing power during this challenging environment.
The Trouble with Lower Yields
Yields today are low for a variety of reasons—low real growth expectations, low inflation expectations, central bank interventions, and an excess supply of capital relative to investment demand. These factors dampen prospective returns on a wide array of investments. Lower global economic growth constrains real long-term earnings growth prospects, while low yields dampen return prospects for bonds and all investment strategies that rely on collateral returns as part of the return stream (e.g., hedge funds, commodities).
We have a high degree of certainty that low- or negative-yielding sovereign bonds will produce low or negative returns over the intermediate term. The relationship between beginning period yields and subsequent nominal returns is rock solid (Figure 1). Prospects for equities are far less certain, as earnings growth and investor sentiment are difficult to predict. We have found valuations a useful, albeit imperfect, guide over long periods (e.g., ten years) as mean reversion over these periods makes valuations the dominant driver of subsequent returns. Interestingly, while low yields have helped to push up US equity prices, as investors have justified higher valuations in a low yield environment, this relationship has not been as strong outside the United States. Indeed, valuations for equities are within our fair value range for all other major developed markets regions, even with lower bond yields in most developed markets outside the United States (Figure 2). Concerns over equity risk, as reflected in the equity risk premium, may be offsetting the uplift from lower yields in these equity markets.[1]For a thoughtful discussion of this topic, see Clifford Asness, “Fight the Fed Model: The Relationship Between Future Returns and Stock and Bond Market Yields,” The Journal of Portfolio … Continue reading
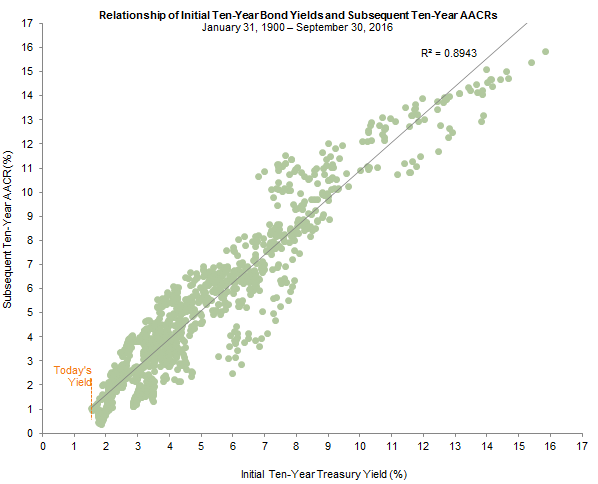
Figure 1. Bond Yields Are Strong Predictors of Subsequent Nominal Returns
Source: Global Financial Data, Inc.
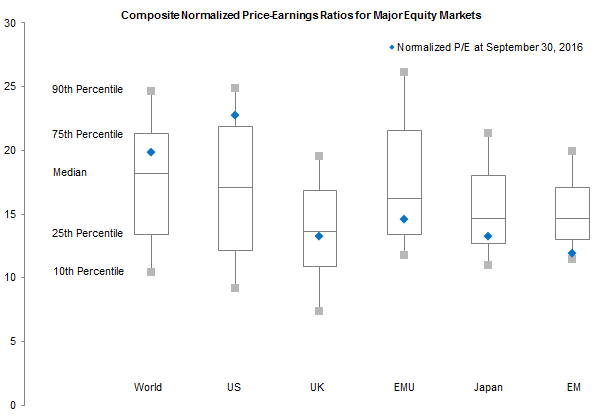
Figure 2. Valuations Are Helpful at Extremes
Sources: MSCI Inc. and Thomson Reuters Datastream. MSCI data provided “as is” without any express or implied warranties.
Notes: The composite normalized price-earnings (P/E) ratio is calculated by dividing the inflation-adjusted index price by the simple average of three normalized earnings metrics: ten-year average real earnings (i.e., Shiller earnings), trend-line earnings, and return on equity (ROE)–adjusted earnings. We used the post-2001 ROE-adjusted P/E for Japan.
The decline in nominal yields has brought down the US earnings yield (the inverse of the Shiller price-earnings ratio) and produced a tailwind for equity returns. Starting from the peak in ten-year Treasury yields in September 1981 (15.84%), if we hold earnings constant and simply track the fall in yields to the recent low at the end of July 2016 (1.46%), US equities would have experienced a price return of about 5% annualized. This accounts for more than half of the roughly 9% annualized appreciation experienced over the period. Clearly this tailwind cannot be repeated, and will eventually reverse. The question, of course, is the timing, which is highly uncertain.
For more on this topic, please see Wade O’Brien et al., “The Consequences of Negative Interest Rates,” Cambridge Associates Research Brief, October 10, 2016, and “Feeling Negative About Sub-Zero Interest Rates,” Cambridge Associates Research Brief, March 25, 2016.
We believe returns from global equities, largely driven by US equities, will be lower over the next decade than our valuation neutral equilibrium assumptions suggest. Our equilibrium expectations for global equities are for compound returns of 6% real, 9% nominal. However, investors rarely, if ever, see the center of equilibrium conditions and by our estimation future returns are more likely to be in the bottom half of the distribution than in the top. If, over the next decade, valuations were to revert to their historical average, earnings grew at their historical real pace of 2%, and the dividend payout ratio remained at its historical average, global equities would return only 3% real, and perhaps 5% nominal.
Both equities and bonds have lower expected returns in the current environment than what we (and most investors) regard as equilibrium. Investors are still being compensated for taking risk. Indeed, 5% nominal stock return expectations are well above bond return expectations, with ten-year US Treasury yields of roughly 1.7% and bonds across Europe and Japan closer to 0% at this writing. Our equilibrium return assumptions presume that equities will earn a premium over bonds of 300 basis points (bps) on a compound annual basis, comparable to what is priced in to the market today. The trouble is that the entire capital market line has shifted down, offering lower prospective returns to investors even as they are generally compensated for taking on incrementally more risk.
Thus, falling yields have provided a huge tailwind to investors in recent decades. Economic and technical conditions appear to confirm the low rate environment will persist for some time, but rates could well be at or near secular bottoms. Investors should consider this possibility. We are mindful that inflation globally is coming off the floor, and attitudes of central bankers seem to be shifting as they openly question the utility of negative interest rate policies and face constraints on sovereign bond buying. If central bankers are able to effectively pass the baton to their nation’s politicians and treasury departments, higher fiscal spending also has the potential to lift inflation, and thus rates.
Alpha Does Not Scale
David Shukis and David Thurston, “The 15% Frontier,” Cambridge Associates, 2016.
Private investments have been a strategically important driver of performance for decades. We continue to expect carefully constructed, high-quality private investment allocations to add value relative to public markets. However, just as expectations for equities and rates have come down, expectations for private investments also must. As noted, our expectations for equity returns over the very long term, assuming neutral valuations and growth conditions, are 6% real and 9% nominal, on a compound average annual basis. The typical expectation of 300–500 bps of value-added returns on top of public equities would lead to a mid-teen return expectation. Such returns would not be unreasonable and have historically been achieved.
However, if equity returns fall below equilibrium expectations as we expect, overall private investment expectations must also be lowered. As discussed, if global equity valuations were to revert to historical averages over the next decade, and earnings conditions remained normal (a generous assumption) we would expect equities to return 3% real, or 5% nominal. Under such conditions, to maintain 15% net return expectations for private investments, value add would have to increase to 1,000 bps. While return dispersion is significant for private equity, growth equity, and particularly venture capital fund performance, and top quartile performance is enviable, a standard of 1,000 bps of value add is a high hurdle given increased competition in a low return environment.
We do continue to find attractive managers across the private investment spectrum, discovering better return prospects outside the mainstream. For example, fertile innovation and business disruption favor early-stage venture capital and lower-market growth equity. Within private equity, where (in aggregate) most of investors’ capital has been flowing, dynamics are becoming more challenging and the overall arena is evolving, as managers seek a variety of means to preserve competitive advantages in delivering returns. Median gross returns have been falling steadily, from highs of 18% toward the mid-teens. In this environment, private credit strategies are attractive relative to plain vanilla, large buyout investments. Managers are targeting comparable returns (from low- to mid-teens net to limited partners for the more attractive opportunities) and the distribution of returns for such funds should be relatively narrow depending on the underlying credit strategy on offer (e.g., mix of performing and non-performing assets, use of leverage) at discounts that provide some margin of safety. For investors with more capacity to increase allocations to illiquid assets, such investments tend to have shorter investment and lock-up periods than private equity, and may present an opportunity to increase portfolio expected returns with a few years’ less illiquidity than most other private investments.
Please see Wade O’Brien et al., “Opportunities Arising From Banking Sector Stress in Europe,” Cambridge Associates Research Brief, August 24, 2016.
In short, private credit opportunities have continued to develop amid changing regulations (e.g., clarification and enforcement of Basel III capital requirements and the US Dodd-Frank Wall Street Reform Act, enactment of risk retention requirements for certain structured products in the United States) as traditional banks continue to withdraw from previously commonplace banking activities. We find opportunities in Europe to be particularly interesting and varied, as hedge funds and private equity firms are acquiring assets from banks no longer willing or able to own them. European banks own approximately €2 trillion in non-performing loans and non-core assets and are under pressure from regulators and shareholders to consolidate activities to return to improved profitability, which has been sagging under slim net interest margins. Distressed debt and private equity managers with appropriate local expertise and networks should be able to continue to generate attractive returns for investors. Of course, such investments are vulnerable to a deterioration in economic conditions, as is the case with equity and credit investments generally, which are the most appropriate funding source for such investments. Even so, investors should carefully consider the degree to which the portfolio risk profile may change as a result of any move into private credit.[2]Investors in direct lending funds have also benefited from the dislocation in bank lending practices. We note that some funds will post attractive risk-adjusted returns, but investors should take … Continue reading
Costs More and Worth-less
Who wants to own sovereign bonds that offer low or negative nominal yields and negative real yields? While demand for these bonds is quite strong, particularly from central banks, pension plan sponsors, and others that seek to hedge liabilities, investors focused on total returns find such low yields are a tough pill to swallow. The decision to hold sovereign bonds boils down to how much protection sovereign bonds can provide in the current environment and how well other assets can serve as suitable substitutes for sovereign bonds in portfolios.
The case for owning sovereign bonds was a lot clearer when yields compensated for the risk of inflation and rising rates. Even with today’s ultra-low rates, sovereign bonds offer upside potential comparable to that when yields were higher (for a given drop in rates). However, such assets are less attractive for three primary reasons: (1) the expected return under stable rate conditions is lower, as it is driven primarily by the yield to maturity; (2) carry is not high enough to protect returns should rates rise; and (3) the potential for yield declines is relatively limited today.
Consider the case for the ten-year US Treasury bond, which yielded 1.60% at the end of September. If yields stay flat, we would expect nominal returns to approximate the yield over the life of the bond, which would mean flat returns after inflation, assuming inflation equals expectations priced in to the bond market. If instead US Treasuries followed in the footsteps of Japanese government bonds and core European bonds, a 150 bp drop in yields would bring them down to nearly 0% and produce a return of 16%, pretty valuable. However, if yields were to increase by 100 bps (comparable to the largest increases in the last several years), Treasuries would return -6% over a one-year horizon and a cumulative -1% over a three-year horizon (Figure 3).[3]We assume rates rise or fall linearly over the time horizon. We also assume a constant maturity by selling the ten-year bond at the end of the year and buying a new ten-year bond at par. We also … Continue reading

Figure 3. Reduce Allocations to Sovereign Bonds?
Source: Thomson Reuters Datastream.
Note: Yield shifts assume a straight-line change over the given time horizon.
If yields were 6%, rates last seen over 15 years ago in the United States, a 150 bp drop in yield over the course of one year would produce a return comparable to what we’d expect today—17%. This is because bond duration (i.e., price sensitivity to changes in interest rates) increases as yields fall. However, the similarity disappears over a longer time horizon. If the yield decrease transpired over three years, the 6% yielder would return a cumulative 30%, nearly twice the return expected from today’s low-yielding Treasury bond (Figure 3). Further, when yields were higher, they had the capacity to decrease more amid declining growth and inflation expectations, producing higher capital gains along the way. Finally, the downside in the days of higher yields was more limited, as a 6% coupon offsets a good deal of capital depreciation.
Owning sovereign bonds typically involves an opportunity cost, as credits and equities normally offer a risk premium over bonds. Investors today must determine whether the higher opportunity cost, or in many cases, outright cost when yields are negative, provides adequate benefit.
While predicting the direction of rates has notoriously been a fool’s errand, historically rates have been quite slow to increase from low levels, suggesting that risk of mark-to-market losses may be limited for now. For example, the last time the rate environment was this low in the United States was in the 1940s. Rates first fell below 2% in 1940, reached bottom at 1.55% in 1945, and didn’t sustain a break through 3% until 1956, taking a decade to increase 150 bps off the bottom to reach 3% (Figure 4). As is the case today, the government was engaged in various efforts to suppress interest rates.
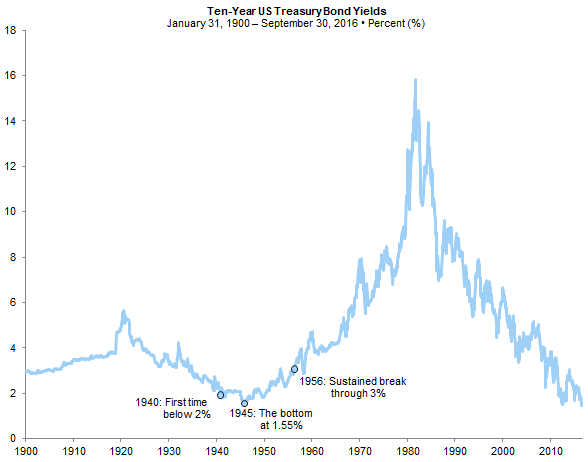
Figure 4. Historically Rates Have Been Slow to Increase From Low Levels
Source: Global Financial Data, Inc.
Note: Data are monthly.
Low rates could again be with investors for some time for two primary reasons. First, demand for sovereign bonds remains strong. Much of this demand is from relatively price insensitive, buy-and-hold investors (e.g., central bank reserves, liability hedging entities). US Treasury yields in particular are supported by foreign demand given their relatively high yield (although the cost of hedging dollars back to yen and euros has increased to a degree that has made US Treasuries less competitive on a hedged basis). Second, secular forces are keeping rates low as the demand for capital is understandably low in a world of high excess capacity in capital intensive industries and a global shift to less capital-reliant, more technology-supported businesses.
Of course, rates have been threatening to riot of late amid rising expectations for Fed tightening and speculation the European Central Bank will begin tapering its purchases earlier than anticipated. In fact, correlations between stocks and bonds, which have been generally negative over the last 15 years, have turned slightly positive lately, suggesting that bonds’ diversifying capacity may be diminishing.
Overall, the case for owning some sovereign bonds remains, particularly in markets with positive nominal yields and positively sloped yield curves, but is diminished relative to prior cycles since the late 1970s/early 1980s. The diversification benefits are strong, but the opportunity cost is too high to retain much from a starting point of today unless one expects yields to remain low or head lower and correlations with the rest of the portfolio to be deeply negative over the holding period. The upside in most sovereign bonds outside the United States is much more limited given the negative nominal carry and limited prospects for yields to go much more negative in places like Europe and Japan, while in Australia and New Zealand, higher yields improve return prospects.
If Not Sovereign Bonds, Then What?
Investors have been cutting back sovereign bond exposure for some time. However, yields have fallen so low in recent years as to prompt the median endowment and foundation to hold just 10% in bonds, typically including more credit risk than sovereigns and/or long duration in the hope of enhancing returns. The most common liquid options we see investors use are to increase cash, take more credit risk, and give up a bit of liquidity to invest in more diversifying hedge funds.
Cash, like sovereign bonds, suffers from low or negative yields. However, unlike bonds, cash has no duration, might be expected to serve as a liquidity reserve under most negative environments for risk assets (including periods of rising yields), and can serve as dry powder for investing in cheap assets as opportunities develop. The trade-off between cash and bonds is a relatively easy one in places like Europe, where core European bond curves are essentially flat, offering little compensation for taking more interest rate risk over longer time horizons. But in the United States, the yield curve remains positively sloped, so by holding cash, investors give up some yield and roll down return prospects, accepting lower expected returns in a stable or falling rate environment. From a total portfolio perspective, cash may not present as much of a portfolio drag as expected at first glance. A barbell strategy of holding some cash and increasing risk elsewhere in the portfolio can boost expected returns without increasing total portfolio risk (i.e., volatility, liquidity, interest rate risk) relative to owning bonds or other low-returning defensive assets. However, the behavioral risk of holding cash, even in small proportions, cannot be overlooked, as it often sits as an unattractive line item on a performance report. Still, for investors that can stand to hold some cash in lieu of bonds and as part of a barbell strategy that includes higher expected return assets, we see this as an attractive option.
For more thoughts on our views on credit, please see our Asset Class Views, published monthly.
In contrast, we are not enthusiastic about low-yielding credits as a way to boost bond returns in mandates intended to provide liquidity during a deflationary bust. Credit tends to behave like equities, particularly during risk-off environments. Further, the highest-quality credit with the least equity-like characteristics offers very low absolute yields, and credit spreads are not much above historical averages. For US investment-grade bonds, one of the most common sovereign bond substitutes, the entire yield spread over US Treasuries of comparable maturity would be wiped out if spreads increased just 17 bps. Note that on average, when yield spreads have increased over 12-month periods, they have done so by an average of 55 bps. The potential for credit spreads to increase enough to offset the extra carry from investment-grade bonds is high. Other credits, such as high-yield bonds and emerging markets debt, are more appropriately thought of as diversifiers and are generally subject to even sharper reversals in risk-off environments (Figure 5). We are not particularly enthusiastic about these investments today and see better alternatives.
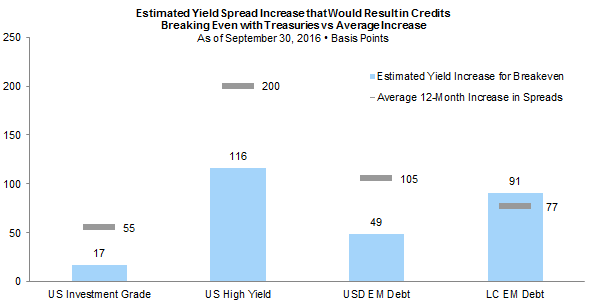
Figure 5. Do Credits Have Enough Cushion to Outperform Treasuries?
Sources: Bloomberg Barclays and J.P. Morgan Securities, Inc.
Notes: Average increase in spreads is measured as the average change in yield spread during 12-month periods over which spreads increased, for the June 30, 1990 to August 31, 2016, period. “US Investment Grade” represents the Bloomberg Barclays Corporate Investment Grade Bond Index. “US High Yield” represents the Bloomberg Barclays US High Yield Index. “USD EM Debt” represents the J.P. Morgan Emerging Markets Bond Index (EMBI). “LC EM Debt” represents the J.P. Morgan Global Bond Index Emerging Markets (GBI-EM).
The final major area that investors have sought out as a “sovereign bond substitute” is more defensive hedge funds with less equity and credit exposure. While a variety of hedge fund strategies fit this description, trend-following strategies are often underinvested. Trend following is a time-series momentum strategy that provides strong diversification to portfolios without an opportunity cost over full market cycles (Figure 6). Such allocations are not true substitutes for sovereign bonds, in that there is no particular reason to believe trend following will reliably appreciate in falling rate environments, such as a growth scare or deflationary bust. However, the strategy has strong diversification properties.
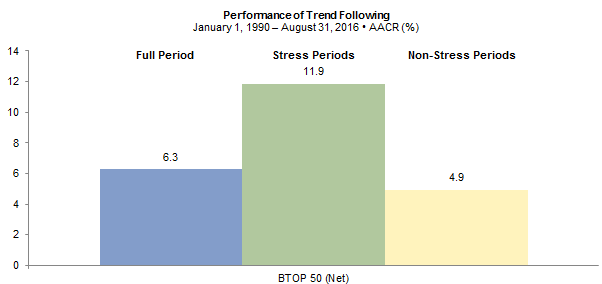
Figure 6. Trend Following Has Provided Diversification Without Opportunity Cost
Sources: BarclayHedge, MSCI Inc., and Thomson Reuters Datastream. MSCI data provided “as is” without any express or implied warranties.
Note: Stress periods used are five largest drawdown periods for global equities, as determined by MSCI All Country World Index.
The economic basis of return for trend following is attributable to two factors. The first is rooted in behavioral finance. Investors tend to be slow to react to new information. Momentum builds as market participants increasingly act on information. When large, unexpected changes in economic fundamentals result in a broad re-pricing of risk, value-based, mean reversion strategies tend to struggle, while trend following is poised to benefit by buying winners and selling losers in a disciplined, quantitatively-based fashion with tight risk management. Trend followers also profit as futures traders, as they establish trading positions that offset persistent mismatches in the exposures hedgers seek, earning a premium by providing liquidity while assuming price risk. Over time, some premium should be available to skilled investors able to establish a trading edge and manage risk. This premium should be greatest during periods of uncertainty and heightened volatility, which also tend to be periods when equities and other risk assets tend to underperform.
For more background on these strategies, please see Gene Lohmeyer et al., “Befriend the Trend: An Overview of Managed Futures Investing,” Cambridge Associates Research Report, 2014.
In three of the four 20%+ drawdowns of global equities since 1990, trend-following strategies (as represented by the BTOP 50 Index) have earned strong positive returns, outperforming the Bloomberg Barclays Aggregate Bond Index. The strategy failed to post positive returns in the 2011 bear market but did outperform global equities by 18 percentage points (Figure 7). As is often the case with diversifying strategies that are not commonly held by the majority of investors, behavioral risk can be high. Because trend-following cycles differ from those of equity-oriented assets, the gap between the strategy and equities can be quite high. Investors should understand and become comfortable with return patterns before committing to such strategies so that they are able to withstand inevitable periods of underperformance. Trend-following strategies also have the benefit of providing reasonable liquidity to investors. When implemented through traditional managed futures formats, monthly liquidity is common, while liquid alternative versions available through UCIT and mutual fund formats offer daily liquidity. In all cases, manager skill is essential for building and maintaining the models these strategies employ.
Overall, sovereign bonds offer pricey protection, but can still prove valuable in a growth scare, as we have seen time and time again. With such low yields today, investors should limit exposures to the bare minimum, particularly in markets with no or negative yields and flat yield curves. A barbell strategy of cash and higher returning assets, and diversifying strategies, such as trend following and other hedge funds with limited equity and credit risk, are reasonable alternatives. The popular strategy of investing in credit for diversification is relatively unattractive today, while those strategies with higher yields are less diversifying as credit risk correlates with equity risk during times of stress.
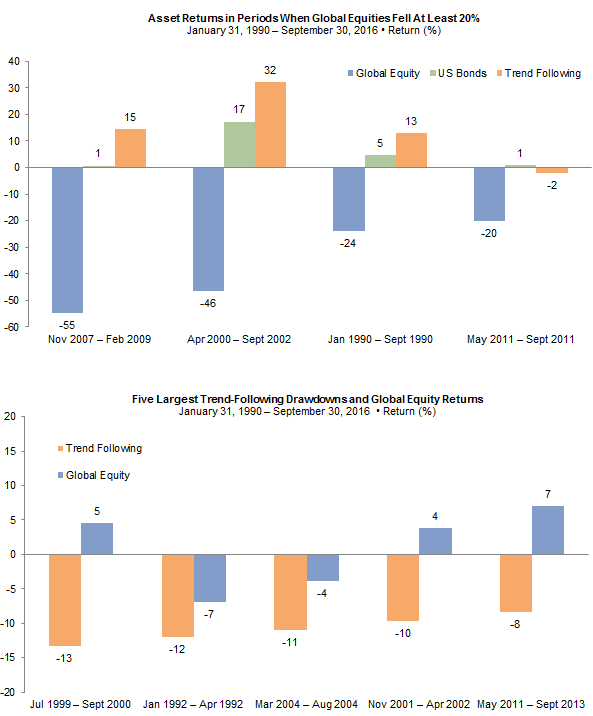
Figure 7. Trend-Following Strategies Provide Helpful Defense
Sources: BarclayHedge, Bloomberg Barclays, and MSCI Inc. MSCI data provided “as is” without any express or implied warranties.
Note: Data are monthly.
Check Your Belts and Braces
The low-yield, low-growth environment poses challenges to capital market returns over the intermediate to long term. Such challenges can be managed to a degree by making adjustments to asset allocation and possibly manager selection, as discussed. At the same time, portfolio outcomes can be improved by managing a number of areas over which investors typically have more direct control. At the top of the list are the liquidity profile of the portfolio, the rate of portfolio spending, and investment management costs.
Find the Right Level of Liquidity
Please see Mary Cove et al., “A Holistic Approach to Liquidity Management,” Cambridge Associates Research Report, April 2016.
Since the end of last year when global trade fell precipitously and investors began to worry that the slow economic expansion might be in its twilight, we have advised investors to stress test portfolios to understand potential vulnerabilities. While economic conditions have stabilized since the start of this year, we continue to believe investors should make sure they have adequate liquidity to support future spending needs and capital calls, as well as rebalance. Additional considerations relate to the potential for debt covenants to be violated or credit ratings to deteriorate during the next major market decline (e.g., a 2–3 standard deviation event such as those experienced in 2000 and 2008). Such an analysis should be evaluated holistically, not just focused on resources inside of the long-term investment pool.
The key objectives of such analyses are to understand how long portfolio liquidity will last (given cash flow needs, current asset allocation, and performance) and how the liquidity composition of the portfolio may change over time. This analysis should also be paired with an assessment of the cost of increasing portfolio liquidity. In fact, it is possible to have too much liquidity, and an important objective of liquidity management should be to minimize cash needs by closely monitoring liquidity sources and uses and planning ahead.
A liquidity review should include evaluation of historical cash needs relative to available cash balances, assessment of intermediate-term needs against financial resources, and stress tests to consider whether capital structure or other demands require an increase in cash or intermediate-term pool size. Many conditions can cause liquidity constraints during severe market downturns, but the four most common indications of potential for vulnerability are the following:
- High and/or inflexible spending needs as a percentage of liquid assets;
- High uncalled commitments as a percentage of liquid portfolio assets;
- Use of derivatives, such as swaps or futures, that can require posting of additional cash as margin; and
- High and/or variable rate debt.
Most institutions maintain plenty of liquidity and need not do anything to portfolios. However, for those that have limited liquidity, some options can be considered, as outlined in Figure 8. There is no single best way to manage liquidity risk; however, of these options, we would be particularly careful today about large cash balances or secondary sales. Because adding cash to a portfolio presents an opportunity cost, particularly when it comes from higher return potential assets, we would be very conservative about doing so. Similarly, even as the secondary sales market environment is currently favorable for sellers, we generally would not recommend secondary sales of private investment interests. However, a slower pace of commitments makes sense, particularly in overheated segments (e.g., large-cap buyouts and late-stage venture capital) when allocations are above policy targets. Our advice today is to be relatively neutral on equity allocations. Therefore, additional funding for liquidity, should it be needed, should come from investments like hedge fund or bond allocations that are intended to serve as defense and would entail less opportunity cost.
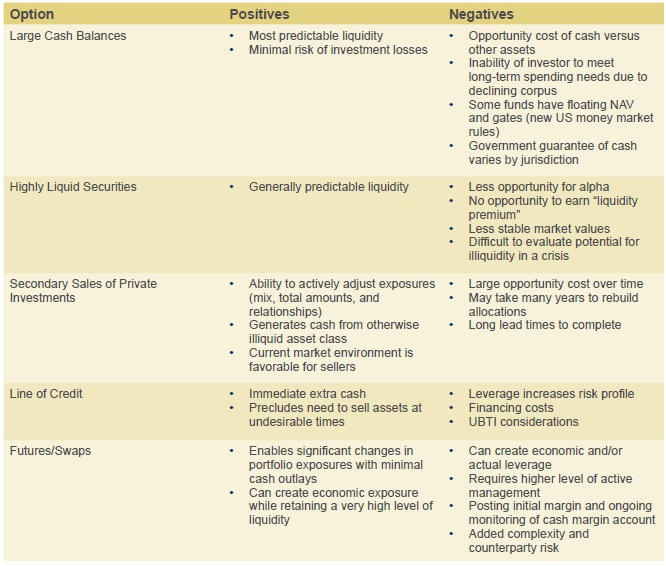
Figure 8. Liquidity Management Options
Spend More by Spending Less
Preserving purchasing power is a common investment goal of endowments, foundations, and families alike. Over the very long term, maintaining purchasing power after spending 5% has been a tough, but manageable goal.[4]For families, the 5% objective would be gross of taxes. However, the “very long term” is composed of secular bull markets, during which markets overshoot long-term expected averages significantly, and secular bear markets, during which the reverse happens. Investors should prepare for the likely prospect that below-average performance may continue for some time.
Those with flexibility to cut spending rates can realize long-term benefits. Figure 9 models the real asset growth and spending of a simple US$100 million portfolio with a 70% allocation to global equities and a 30% allocation to bonds. While in reality most institutions have more sophisticated portfolios, the broad trends using actual data would look similar. Starting in June 30, 1969, near the peak of the secular bull market ended 1968, an investor that chose to spend 5% of endowment assets (smoothed over trailing 12 quarters) would have seen its portfolio market value cut by nearly 60% by the end of the secular bear market ending in 1982. The portfolio would have recovered its original value in real terms by 1987, peak 40% above that value at the top of the next bull market in 2000, and then see assets drop 20% below the initial value in 2009. Such a portfolio would remain underwater today, more than seven years later.
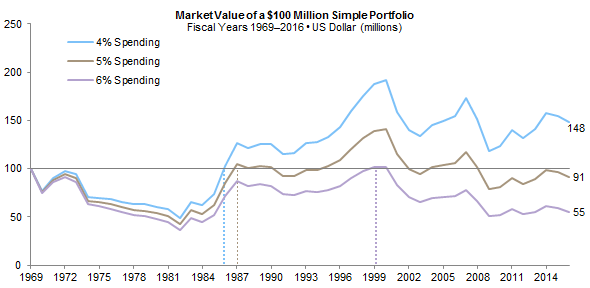
Figure 9. Retaining Purchasing Power Is More Difficult at Higher Spending Rates
Sources: Cambridge Associates Endowment Spending Model, Global Financial Data Inc., and MSCI Inc. MSCI data provided “as is” without any express or implied warranties.
Notes: All scenarios assume a starting market value of $100 million on June 30, 1969, for a portfolio of 70% global equities (proxied by the MSCI World Index) and 30% US bonds (proxied by the Global Financial Data US 10-year Treasury series from 1968 through 1972, and the Barclays Government/Credit index thereafter). Spending rates are applied to a trailing 12-quarter average endowment market value.
In contrast, a portfolio spending 4% would have had a much easier time maintaining market values. Its value would have been halved by 1982, but the lower spending rate would have allowed a full recovery by 1986 and the portfolio would not have dropped below the initial market value again. The lower spending would have resulted in an ending market value in fiscal year 2016 over 60% higher than the portfolio spending 5%. A portfolio spending 6% would have had a much more difficult path, failing to recover its 1969 original value until 1999, just in time to be hit by the bursting of the tech and telecom bubble the following year. Such a portfolio would be worth just over half its initial value today.
A higher spending rate provided more benefit to an earlier generation than a lower rate, but a lower spending rate ultimately provided more benefit to later generations and resulted in a larger portfolio—thus expanding the role of the endowment. The bottom line is that there is no “right” answer, only a choice between competing evils: cut spending at the expense of current programs, or maintain spending at the expense of future purchasing power.
Concentrate on Costs
An often overlooked means of adding value is by lowering costs. Investors that find alpha should be willing to pay for it, as the goal of active management is to outperform the market on a net-of-fees basis. However, high fees should only go to managers that have skill. This is particularly the case in a low expected return environment. Investors have two main ways to lower costs: (1) increase use of index funds and lower-cost implementation options, and (2) negotiate lower fees and better terms.
For more on this topic, see Sean McLaughlin et al., “Are Elevated Valuations for ‘Smart Beta’ Strategies a Crash Waiting to Happen? We’re Not So Sure,” Cambridge Associates Research Note, September 2016; and Sean McLaughlin and Deborah Christie, “Alternative Beta Strategies: A ‘Smarter’ Way to Invest in Equities?,” Cambridge Associates Research Report, 2014.
Use of indexing and less expensive alternative beta/smart beta strategies are reasonable alternatives for rounding out portfolios where adequately skilled active managers are difficult to identify. However, pursuit of lower costs should not mean firing managers that have underperformed recently. Investors should take a long-term perspective, performing careful analysis of the drivers of managers’ performance to understand if their ability to outperform the market is based on a sustainable edge. Managers that have the ability to add value over cheap market indexes are particularly valuable in a low expected return environment.
However, the cost of access to active management matters and is best thought of in terms of what share of returns, or value-added returns do investors retain and what share is fair compensation to managers for accessing their investment management skill? Importantly, the balance of alignment between investors and managers is not static over time. One important driver of this balance is the performance of capital markets themselves. As capital market expectations fall, fixed management fees consume a disproportionate percentage of gross returns, leaving a smaller share of gross returns for investors. At the same time, incremental returns over cheap, passive index exposures are more precious, as they are even more necessary for achieving return objectives.
Consider a simple example in which an investment is expected to produce a gross return of 10%. If fees are low, say 50 bps, the return environment does not exert much influence on the share of gross returns that accrue to investors relative to the manager. Investors would retain 95% of gross returns if returns were 10%, dropping to 90% if gross returns halve, as fees remain a fixed quantity, while market gains diminish. However, if fees doubled to 100 bps, the same drop in gross returns from 10% to 5% reduces investors’ share from 90% to 80% (Figure 10). Should returns be only 1% to 2%, investors’ share falls exponentially; however, such low, or even negative, returns should be short-lived if faith in the investment manager and strategy remains.
This relationship is also present in fee structures comparable to those charged by hedge funds. We show two examples in Figure 10 reflecting the typical fee structure at the height of hedge fund popularity (2% management fees, 20% incentive fee over a high-water mark) and a more typical fee structure today (1.5% and 20%). The improvement in GP-LP balance from reduced fees can easily be seen when looking at investors’ share of gross returns below 7% or so. We have found it worthwhile to have such strategic conversations with managers about fees and terms to reassess what is appropriate in the current investment climate.
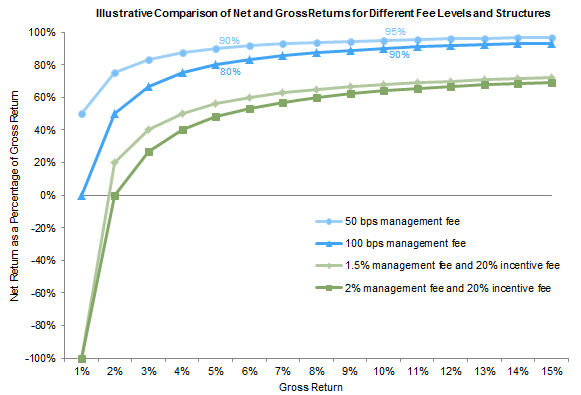
Figure 10. Investors’ Share of Gross Returns Falls When Gross Returns Are Very Low
Conclusion
In this low yield environment, investors will be hard pressed to earn what they spend and are faced with essentially three choices:
- Stay the course and accept lower expected returns. After all, history is replete with environments in which the capital markets deliver disappointing returns. These tend to be followed by periods of stronger returns, just as night follows day. During the tough times investors should consider lowering the rate of spending to help lower the risk of impairing the corpus.
- Increase risk to earn higher returns consistent with spending rates. We would be cautious about doing so today and have recommended being neutral to slightly conservative with allocations to risk assets. However, this avenue is worth exploring as accepting lower portfolio returns increases the probability that portfolios will not be able to provide comparable benefits to future generations, an important risk to seek to manage. Adding to private investments while restructuring diversifying allocations to have stronger diversification capabilities and less opportunity cost could be done in a way that helps improve return prospects without materially increasing expected portfolio risks during most environments.
- De-risk portfolios. Such a strategy would preserve the ability to pile in to assets as they become cheaper and prospective returns increase. We do not recommend investors take this action, as doing so requires being prepared to be wrong for potentially as long as several years. Most investors cannot tolerate this risk.
Regardless of the course of action taken, investors should stress-test portfolios to make sure they understand what they own and have appropriate levels of liquidity, evaluate the potential to cut spending, and look to cut costs using all tools available to try to earn what they spend.
Footnotes