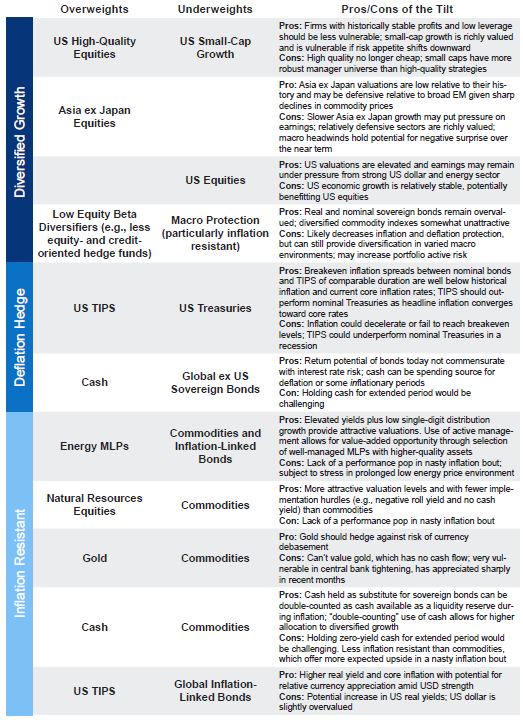
Advice in brief
- The four most significant risks today are political risk, particularly in Europe; a resumption of US dollar strength; central banks’ diminishing ability to maneuver; and China’s economic rebalancing.
- It is particularly important in times of market volatility to make sure there is adequate liquidity—inside or outside of the investment portfolio—to meet near-term needs. Once liquidity needs are met, investors can seek to capitalize on opportunities.
- We would be slightly more defensive than neutral today by waiting to rebalance into cheaper risk assets that fell disproportionately after the UK referendum. Eventually, we anticipate opportunities will develop, as markets overshoot to the downside. Investors should not rebalance allocations to European equities until they have become more meaningfully undervalued and oversold, and should not rebalance Japanese equities until there is more clarity on the strength of the yen. We are now neutral on Eurozone and Japanese equities.
- As the market and economic cycles have progressed, we have emphasized the importance of diversification into high-quality sovereign bonds, cash, and hedge funds with less equity and credit exposure. The importance of maintaining high-quality diversification has been illustrated several times since last August and should serve investors well in the coming weeks and months as more opportunities likely unfold.
Portfolio Tilts From CA’s Chief Investment Strategist
The global economy is stuck inside a recursive loop. Secular and political challenges that pressure economic growth or cause growth scares are met by strong policy responses, particularly monetary policy, which help support markets until the next challenge, when new policies are trotted out as solutions, and so on. The result of this loop has been slow, uneven, but resilient growth. We know the loop cannot go on infinitely, but we don’t know what will cause an exit and how much longer it will last.
Secular challenges such as China’s economic rebalancing, a slowdown in global productivity growth, overleverage, and deteriorating demographics in many economies suggest that growth will remain lower than that seen historically. Political risks, like the United Kingdom’s decision to leave the European Union, reflect a growing discontent with the status quo and raise the risk of uncertain outcomes, which markets find hard to digest. As long as income disparity and high youth unemployment remain elevated, such political risks should be expected to persist.
While the economy could take many paths from here, the two most likely are that it remains stuck inside this recursive loop for a while longer—and it could be several years—or enters a recession. For as long as the recursive loop exists, risk assets should do relatively well, particularly since safety has become quite expensive—negative yielding bonds are hardly appealing options. However, if the global economy heads down the road of recession, defensive assets will be worthwhile.
In this edition of VantagePoint, we discuss the four most significant risks to investors: political risk, particularly in Europe; a resumption of US dollar strength; central banks’ diminishing ability to maneuver; and China’s economic rebalancing. Against this backdrop, we evaluate the degree to which extended cheapness in European and Japanese equities provides an investment opportunity and consider whether sovereign bonds with shrinking or even negative yields can still provide useful defense to portfolios.
From a total portfolio perspective, we would be slightly more defensive than neutral today by waiting to rebalance into cheaper equity assets. We have also moved from an overweight to a neutral recommendation on European and Japanese equities despite their cheapness. The importance of maintaining high-quality diversification has been illustrated several times since last August and should serve investors well in the coming weeks and months as more opportunities likely unfold.
Trouble in Paradise
Populist unrest has become increasingly apparent over the last several years. The UK vote to leave the EU is just the latest, most prominent, sign of discontent. The rise of populism has been evident in Europe, where such parties have been gaining in popularity across many countries (e.g., Syriza in Greece, Marine Le Pen’s National Front in France, the anti-establishment Five Star Movement and anti-immigrant Northern League in Italy, the nationalist and anti-immigration Danish People’s Party in Denmark, the Alternative für Deutschland party in Germany), and challenges to the establishment are also obvious in the United States. Rising income inequality and high youth unemployment have been key catalysts for voter dissatisfaction with the status quo.
The challenges seem most acute in Europe given the unsettling imbalance between EU and nation-state authority. The EU has been pushing for more centralized power and closer integration, while member nations, particularly those that are also part of the EMU, have been largely struggling to recover from the global financial crisis and are naturally increasingly interested in regaining more control over their own fate. The most significant risk for Europe is that growing nationalist and anti-establishment feelings do not abate as the EU holds on to policies that limit room for fiscal maneuvering, and Germany refuses to spend to help rebalance the region’s economy, ultimately fostering a break-up of the Eurozone.
Ironically, the outcome of the United Kingdom’s EU referendum may galvanize the remaining EU members to improve this balance. Some evidence of a fundamental shift is already building. For example, foreign ministers of the EU’s six founding members released a statement just days after the UK referendum recognizing the discontent with the way the EU functions and outlining their commitment to improvement. In their words, “We take this very seriously and are determined to make the EU work better for all of our citizens. . . . We have to focus our common efforts on those challenges which can only be addressed by common European answers, while leaving other tasks to national or regional levels.” The following week, the full European Council released a statement that expressed a similar sentiment.
Will the EU back up its talk with action? The jury is out at present and will be tested in short order in the lead up to Italy’s October referendum on a package of constitutional changes designed to streamline reforms. Italian Prime Minister Matteo Renzi has indicated that he will resign if this package is not passed. Waiting in the wings if an Italian election is called are the Five Star Movement and Northern League. The Five Star Movement’s Beppe Grillo has stated that if elected, he will call for a referendum on Eurozone membership.
Heading into Renzi’s referendum, the health of Italy’s banks is deteriorating under the weight of approximately €360 billion of non-performing loans (NPLs). The EU’s state-aid rules require private sector creditors to first take losses equal to 8% of the bank’s liabilities (a so-called bail in) before the state can provide aid. Understandably, Renzi is worried, as Italian retail investors own significant amounts of subordinated debt issued by banks—as much as €170 billion by some estimates. Requiring a bail in of largely retail lenders increases the likelihood that Renzi will lose his referendum over constitutional reforms as voters view the vote as a vote of confidence in Renzi and/or Eurozone membership, opening the door to a referendum on Eurozone membership—“Italeave,” anyone? With bank stress test results coming out at the end of the month, and some Italian banks exposed to an obvious breach of capital requirements, they will be hard pressed to raise capital with equity shares down 50% from the start of the year. In recognition of the stakes, the EU approved €150 billion in Italian government guarantees that allow the government to subsidize bank debt issuance at lower rates by guaranteeing the loans. However, the EU stopped short of allowing Italy to orchestrate a bail out.
In addition, a number of upcoming elections create opportunities for further blows to the status quo, most notably the French and German elections in the spring and fall of 2017, respectively. To the degree that the United Kingdom struggles in the near term, other politicians (and voters) may be discouraged from following in its path. Knowing this, the EU may be tempted to play hardball when renegotiating trade agreements with the United Kingdom. After all, the EU as a whole could live with higher trade barriers, as its exports to the United Kingdom are a relatively small share of the region’s GDP. However, cooler heads may prevail, particularly considering that much of the impetus for forming the EU was geopolitical, and it would be counterproductive on that front to alienate a global ally as powerful as the United Kingdom.
Overall, the United Kingdom’s vote to leave the EU has heightened awareness of the cloud of uncertainty that has been forming over Europe. The uncertainty over the nature of the United Kingdom’s trade agreements with EU members is likely to last for several years. It is unclear when, and even if, the United Kingdom will begin the process of exiting the EU and what the economic, financial, and political implications will be. For now the consensus is that the near-term direct economic consequences will be a 1.0 ppt–2.0 ppt drop in UK GDP growth, although some are predicting recession, about half that impact on continental Europe, and a relatively minor 20 bp–40 bp drag on global growth over the next year, assuming no financial contagion.
While the direct economic risk of the UK referendum is likely to be largely limited to the United Kingdom and Europe, further downside risk should be considered given uncertainties about the political direction of Europe. These risks are taking place in the context of potential for the strengthening US dollar to once again crimp US growth, pressure commodities, and transmit stress to some emerging markets. More importantly, it remains to be seen how much ammunition central bankers have left to pump up the economy and support markets. At the same time, fiscal policy has been constrained, but, somewhat ironically, the current situation may provide enough stress to encourage fiscal spending.
US Dollar Risk—1990s Redux?
Despite broad US dollar strength since 2011, and particularly since mid-2014, the dollar has basically moved sideways this year. A strong US dollar puts pressure on US profit margins, emerging markets (especially those with high USD liabilities), and commodity prices. While lower commodity prices are helpful to some economies, particularly net commodity importers, much of the benefit accrued from lower energy prices has been saved. Further, weak commodity prices have contributed to reduced business investment and heightened geopolitical tensions in counties that rely on commodity revenue, although if countries like Saudi Arabia are able to diversify their economies to become less reliant on commodity revenues, this could be a longer-term positive. But in the near term, a resumption of significant commodity weakness amid USD strength will be a drag on growth and risk assets.
The current pause in the USD cycle has been reinforced by a Federal Reserve hesitant to raise rates into an uncertain, volatile environment. However, history suggests the end of the strong dollar cycle is not yet here, as the current USD bull market cycle looks quite similar to the last two (Figure 1). In each case, choppiness ensued at this point in the cycle—roughly three to four years in—but the dollar ultimately appreciated much further before the cycle ended. USD strength could resume if economic growth remains strong enough to support further increases in policy rates or if other central banks ease while the Fed remains on hold. In contrast, in a recession or major growth scare, the US dollar would benefit from a flight to safety. The dollar is not cheap, but long positions are no longer a crowded trade, valuations remain below levels reached in previous cycles before the dollar entered a sustained reversal, and the market is now pricing in very little chance of near-term Fed tightening. Thus, even a minor positive growth surprise could boost the US dollar.

Figure 1. The End of US Dollar Strength Is Not Yet Here
As of June 30, 2016
Sources: Federal Reserve and Thomson Reuters Datastream.
The 1990s cycle may provide a useful analog for today. As the Fed tightened in the mid-1990s, the US dollar strengthened, pushing down commodity prices and putting pressure on emerging markets economies. The Fed shifted its policy to easing in September 1998, allowing the dollar to weaken and triggering a rally in emerging markets assets. Easy monetary policy also sent the US tech bubble into its final phase. Ultimately, renewed Fed tightening in mid-1999 to 2000 sent the US dollar to new highs. The dollar continued to climb until early 2002 despite aggressive Fed rate cuts as the US and global economies fell into recession. Something similar could occur this cycle if the Fed resumes hiking later this year or next. This suggests that having more USD exposure would be a helpful hedge against tail risk.
Central Banks Running Out of Room
After seven years of monetary policy dictating winners and losers in risk asset performance, markets responded poorly to negative policy rates following the European Central Bank’s (ECB) and Bank of Japan’s (BOJ) latest rounds of easing earlier this year. Rates don’t have much more room to fall, at least not without doing more harm than good by severely crimping bank profitability and actually curtailing lending. Banks have been hesitant to charge depositors with the exception of very large corporate accounts in countries with the most deeply negative policy rates. This practice has pressured net interest margins, making it more difficult for banks to lend even when interested and eligible borrowers show up. Further, banks appear to be investigating the prospects for storing euros in vaults rather than paying the ECB for holding excess reserves. The limits of negative yields are here or nigh.
In addition, it is unclear how much more room there is for asset purchases or how effective they will be. Countries pursuing quantitative easing already have ultra-low sovereign yields, which are helping keep borrowing costs low. The majority of sovereign bonds in most of these countries already have negative yields (Figure 2). It is doubtful that lower yields from current levels will help increase lending meaningfully. To the degree that borrowing is encouraged, mal-investment is likely to increase.

Figure 2. Negative Yielding Global Treasury Bonds Dominate in Many Countries
As of June 30, 2016 • Percent of Total Market Value (%)
Source: Barclays.
Notes: As of June 30, 2016, the Barclays Global Treasury Bond Index held a market value of $26.4 trillion, $9.9 trillion (38%) of which carries a negative yield. The Barclays Global Treasury Bond Index excludes bonds with maturities shorter than one year, some of which have negative yields.
We recognize too that the ECB and BOJ will eventually run out of bonds to buy. The ECB will run into difficulty buying bonds at its current pace in about a year, unless the central bank changes its rules or a greater share of German bund yields rise above the deposit rate of -0.4%. As bond markets repriced following the Brexit vote, as much as 60% of German bunds outstanding (up from about 15% prior to the referendum) saw their yields drop below the deposit rate, making them ineligible for purchase by the ECB. Japan appears to have a little longer, assuming owners of Japanese government bonds (JGBs) will sell to the central banks. The BOJ may run into hard times by early next year, as many of the financial institutions that hold JGBs need them to match liabilities and may not be able to sell. There is room in both Japan and the Eurozone to extend purchases by relaxing rules and buying other assets, but this cannot go on indefinitely.
The other policy lever, of course, is fiscal policy, which has been constrained in recent years (Figure 3). Eurozone fiscal support has moved from negative to slightly positive, but the support provided today is minimal. The United Kingdom and Japan (two countries running large budget deficits) are the only major countries that continue to pursue austerity, and, given current circumstances, this may be changing. Absent fiscal stimulus and structural reforms, further moves to unconventional monetary policies with unknown, unintended consequences seem increasingly likely.
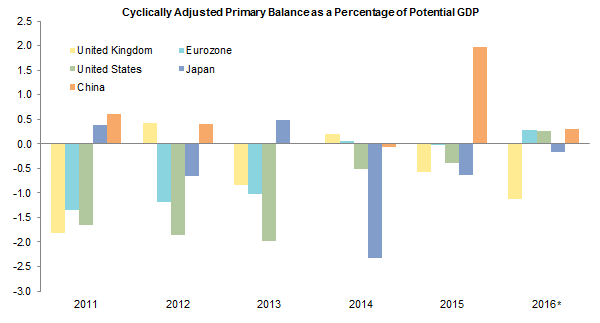
Figure 3. Fiscal Policy Is Providing Only Modest Support
2011–16 • Year-Over-Year Change (ppts)
Source: International Monetary Fund – Fiscal Monitor, April 2016.
Notes: The cyclically adjusted balance is the fiscal balance adjusted for the effects of the economic cycle. Potential GDP represents the capacity of the economy to produce goods and services. Eurozone is a weighted average of individual country data. Data are weighted by annual nominal GDP converted to US dollars at average market exchange rates as a share of the group GDP.
* Data for 2016 are estimates.
China’s Challenges
Overall, we believe China will continue to muddle through and has enough backstops to avoid a crisis. Most of China’s debt is domestic and concentrated in a handful of large state-owned enterprises that have borrowed from state-owned banks, so it is likely that ultimately some of this will become government debt. Fortunately, central government debt levels are low enough to absorb a significant amount of bad debt. Lombard Street Research published an extreme stress scenario that assumed the entire increase in non-financial corporate debt on bank balance sheets since 2012 was worthless. If the government assumed this bad debt on its balance sheet as part of a one-time clean up, China’s gross debt would be just shy of 100% of GDP, or 70% net of FX reserves—high, but not out of the realm of other large economies. Of course if credit growth continues at its torrid pace, the volume of NPLs will grow. NPLs are likely well above official statistics of 1.75%, totaling as much as 30% by some estimates.
The bigger risk in China today is how it manages the adjustment to a slower growth model. To date, policymakers have been implementing important reforms to rebalance the economy and liberalize the financial system, while also seeking to support growth. As growth slows, they have applied various forms of accommodative monetary and fiscal policy. For example, social financing, essentially a form of fiscal policy in China, has increased nearly every time that GDP has slowed (Figure 4). In the first quarter of this year, social financing reached its highest three-month average since the global financial crisis following a drop in GDP to an estimated 6.6% at the end of last year.

Figure 4. China Responds to GDP Weakness with Sharp Increases in Social Financing
October 31, 2011 – May 31, 2016 • Chinese Yuan
Sources: Bloomberg L.P. and The People’s Bank of China.
Notes: Social financing is the sum of total fundraising by Chinese non-state entities, including individuals and non-financial corporates. Social financing measures money offered by domestic suppliers, including financial institutions, households, and non-financial entities. China GDP growth represents Bloomberg monthly GDP estimates.
Currency weakness has also been an important concern, as markets have feared the renminbi was “too strong” and couldn’t compete with currencies like the yen. Such concerns risked igniting a huge outflow from official reserves, making China more vulnerable to a debt crisis. Fears over RMB devaluation have been alleviated since the People’s Bank of China (PBOC) held the currency steady vs the US dollar in mid-January, and the tightening of capital controls has stemmed outflows. However, much of the stabilization of the renminbi is due in part to broad USD weakness, which allowed the renminbi to hold relatively steady against the US dollar while depreciating against a basket of its trading partners without causing panic in the markets. The PBOC is likely to seek to manage a gradual depreciation of the currency to help boost exports as the economy transitions.
To the extent reform is emphasized, a continued gradual economic growth slowdown should be expected. Although this may result in more signs of stress in the corporate sector, it is necessary for the long-term health of China’s economy, which would be positive for the global economy as well. We expect that the transition will not be smooth and will continue to shake markets.
Eurozone and Japan—Cheap Enough?
Our view to overweight Eurozone and Japanese equities relative to US equities had been based on their attraction relative to US equities in an environment of continued slow global growth. US equities have stretched valuations and are relatively advanced in the earnings cycle, in contrast to more reasonably valued Eurozone and Japanese equities that appear to have more room for earnings expansion. Ultimately, we expect this view to play out, but the timing has been called into question by disappointing earnings growth prospects, troubles brewing in the Eurozone, the strong yen, and the constraints on future policy responses discussed earlier. Should governments increase fiscal stimulus, prospects for outperformance would improve in the near term, particularly if unemployment rates in the Eurozone continue to fall. Short of that, however, a more neutral stance on the Eurozone and Japan against the United States seems sensible. As we had been recommending overweight positions in these markets, we briefly revisit our case for overweighting Japanese and Eurozone equities to explore some challenges to this recommendation in the current environment.
Why Did We Overweight?
For more details on our recommendations please see the following previous editions of VantagePoint: 2Q 2014, 1Q 2015, 2Q 2015, 3Q 2015, and 1Q 2016, as well as Wade O’Brien, “European Equities Time to Focus on the Micro,” Cambridge Associates Market Commentary, October 2013; Wade O’Brien, “Slowly But Surely: Investors Should Stay the Course on European Equities,” Cambridge Associates Research Note, June 2014; and Wade O’Brien, “European Equities: Too Early to Take Profits,” Cambridge Associates Research Note, May 2015.
Our case for the Eurozone has been based on slow improvement in revenues boosted by high operating leverage combined with reasonable valuations. Economic growth and revenues have benefited from low policy rates, a weakening euro, lower energy prices, and improving credit conditions.[1]We first advised an overweight to European equities versus US equivalents in October 2013. At the beginning of 2015, we narrowed our focus to Eurozone equities in particular. Today, these supports to Eurozone growth are more questionable. Earnings growth has been disappointing, as operating leverage has not been as powerful as we had anticipated. This has been particularly evident in financials, which have suffered from a changing regulatory environment, a flattening yield curve, and negative rates that have pressured net interest margins. The euro has firmed somewhat and energy prices have increased (although they remain well below prices a year ago). The ability for credit conditions to improve is questionable given the pressure on bank net interest margins, constraints on Italian lending from stress in the country’s banking system, and the demand-dampening effects of uncertainty about the implications of anti-EU and Eurozone sentiment, including the consequences of Brexit.
For more details please see the 2015 and 2016 editions of VantagePoint cited above as well as Wade O’Brien, “Japan: Micro More Compelling Than Macro,” Cambridge Associates Research Note, February 2015, and Wade O’Brien, “Japanese Equities: It’s Not Too Late to Capitalize on the Recovery,” Cambridge Associates Research Note, January 2016.
Similarly, Japanese equities have benefited from relatively cheap valuations, a slowly improving economy, and related slow growth in revenues combined with high operating leverage. At the same time, changes in policy such as a reduction in corporate tax rates and incentives to corporations to increase their focus on returning value to shareholders (including increasing dividends and buybacks) have helped improve profitability and thus returns to equity investors.[2]We first advised an overweight to Japanese equities versus US equivalents in January 2015. In January 2016 we modified our recommendation to include Japanese small caps. However, pressures on the financial sector and the relentless strength of the yen have challenged the ability of Japanese corporations to grow earnings, even as share buybacks are hitting record levels and corporations remain focused on improving their return on equity.
We maintain our concerns about US equities and believe valuations are too high given the potential for continued pressure on profit margins in light of slow revenue growth and prospects for higher wage costs should labor markets continue to tighten. Further, energy sector weakness and a strong US dollar may continue to be a drag on US earnings, although some of this pressure has diminished this year. However, we see a number of plausible conditions under which US equities could continue to outperform Eurozone and Japanese equity markets over the next few years, raising the question of whether these markets are cheap enough to deserve overweight positions today.
Exploring the Fundamentals
Eurozone and Japanese equities continue to trade at a more significant discount to US equities than is typical (a 40% discount for the Eurozone compared to a 20% median and a 40% discount for Japan compared to near parity). Figure 5 shows what three-year nominal average annual returns[3]We evaluate a three-year horizon as it is roughly the length of time we expect uncertainty surrounding the United Kingdom’s trade relationship negotiations will last and it is a common performance … Continue reading would be under a range of scenarios with valuations staying constant or moving to various historical percentiles and under a range of earnings growth assumptions. Both valuation multiples and earnings growth are based on our composite normalized earnings that smooth growth, so the downside and upside we show are muted relative to unadjusted trailing three-year compound earnings growth rates (Figure 6). US equities are at a sizable disadvantage if we make consistent assumptions about prospective valuations and earnings growth across markets. For example, if earnings growth were 3% and valuations reverted to their historical median over a three-year period, US equities would return -4% annualized, vastly underperforming Eurozone equities (13%) and Japanese equities (12.5%). Even if valuations for the regions show no change over the next three years, US equities are at a slight disadvantage because of their lower dividend yield.

Figure 5. Scenario Analysis: US Equities Perform Poorly Unless Valuations and/or Earnings Growth Are Relatively High
Source: MSCI Inc. MSCI data provided “as is” without any express or implied warranties.

Figure 6. Composite Normalized Earnings Have More Muted Upside and Downside Than Trailing Earnings
1975–2015 • Three-Year AACR (%)
Source: MSCI Inc. MSCI data provided “as is” without any express or implied warranties.
However, it is not difficult to paint plausible scenarios in which US equities outperform or experience comparable performance to these regions. If markets were to enter an environment in which they de-rate, where the Eurozone and Japan experience more stress, it would be reasonable to expect US equities to experience comparable or better returns despite much higher starting valuations. In stressed markets, valuation multiples tend to hold up better in the United States than in other markets. For example, during the global financial crisis, US equity composite normalized P/E multiples contracted 11 points; Eurozone equities, 12 points; and Japanese equities, 12.5 points. Similarly, although on much smaller scale, Eurozone P/E multiples contracted nearly 3 points during the Eurozone debt crisis of 2011–12 and Japanese equities, 2 points, compared to a 1.25 point contraction in US equities. At the end of both periods, Eurozone P/E multiples had sunk to about 10.5 and Japanese P/E multiples, 10, compared to US equities, which saw P/E multiples contract to 12 at the end of the global financial crisis and 17 at the end of the last wave of the Eurozone debt crisis. At the start of the Eurozone debt crisis, US equities were relatively expensive, trading at a composite normalized P/E multiple of 18.5, compared to EMU equities, which traded at a P/E of 13.7, roughly where multiples are today. US equities returned 5.6%, compared to a -13.2% return for Eurozone equities over the period.
In addition, while composite normalized earnings growth has been comparable for US equities and global ex US developed markets since our data begin in 1970 (Figure 6), the post–global financial crisis era has been a different story. Between 2010 and 2015, US composite normalized earnings have grown at nearly 4%, compared to less than 1% for Eurozone equities and over 6% for Japan. A slower growth rate across all these markets might be considered more reasonable in the current environment given the backdrop of secular pressures on economic growth and the fact that earnings had considerable catching up to do following the contraction in the global financial crisis.
In a shock comparable to the Eurozone debt crisis, Eurozone composite normalized earnings growth could contract by 1% annually and P/E multiples could fall by roughly 3 points. If that were to transpire, the expected average annual compound return (AACR) over the next three years would be roughly -5%. If US equity valuations fell by 1.25 points, as they did over the course of the Eurozone debt crisis, and earnings grew by 3%, expected returns would be 3% annualized, quite a bit better than Eurozone equities. These returns are evaluated in local currency. In such an environment, we would expect the US dollar to appreciate relative to the euro and note that it strengthened over 20% during the Eurozone crisis and 5% during the global financial crisis on a cumulative basis.[4]The US dollar actually first depreciated about 15% against the euro in the early days of the crisis before appreciating nearly 25%. Similar comparisons could be made for Japanese equities, although in contrast to the euro, the yen has tended to appreciate during times of stress, somewhat offsetting multiple contraction and earnings slowdown effects—the yen appreciated nearly 30% versus the US dollar during the global financial crisis and a more tame 4% during the Eurozone crisis. The complications Japan faces from a strong yen, a weak financial sector, and challenges in pursuing continued easy monetary policy keep us cautious for now. We recommend remaining on hold in rebalancing Japanese equities until we gain better clarity on Japan’s future direction, as well as taking a more neutral perspective on the country’s equities today and favoring small caps that are more insulated from yen pressures due to their domestic focus.
As for the Eurozone, to better understand when to move from a neutral to an overweight position in the market, historical context on bear market drawdowns is helpful. Looking at significant equity market declines (those of at least 20%), the median decline has been about 30% based on the experience of UK and US equities for which we have the longest historical data (Figure 7). Of the 17 instances that UK and US equity markets experienced declines of at least 30%, only two produced negative returns for the five-year period after the 30% decline transpired and only six saw negative returns in the subsequent year. These periods of negative returns were marked by still-high starting valuations and/or very extraordinary circumstances, such as the Great Depression (Figure 8).

Figure 7. Looking at Drawdowns of At Least 20%, the Median Decline Has Been 30%
1900–2016
Source: Global Financial Data, Inc.
Notes: The US equity market is defined as the S&P 500 and data start in 1928. The UK equity market is defined as the FTSE® All-Share Index and data start in 1900. Data are in nominal local currency terms. Three declines of 19% for US equities and one for UK equities are included in the -20% to -25% bucket.

Figure 8. Markets Typically—But Don’t Always—Deliver Positive Returns After 30%+ Declines
1900–2016 • Local Currency
Source: Global Financial Data, Inc.
Notes: US equity is defined as the S&P 500. UK equity is defined as the FTSE® All-Share Index. Subsequent return calculated from the closest month-end to the date the decline reached 30%; subsequent three- and five-year values are average annual compound returns. FTSE® All-Share price data are monthly until December 1964, then weekly until December 1968, and daily thereafter. Shiller price-earnings ratios shown for US equities are as of the month-end closest to the date the decline reached 30%; for UK equities they are as of the nearest quarter-end and were not available for the two earliest dates.
Some European markets, even before the UK referendum, were already down more than 20% from 2015 highs, as concerns about economic growth have weighed on markets for the last year or so. As of June 30, EMU equities still need to fall 14% to get to roughly a 30% decline. Such a decline would also bring these markets into pretty cheap territory—the 10th percentile of historical valuations if composite normalized earnings remained stable. EMU equities would still need to fall an additional 10% to get to the 10.5 multiple reached at other market bottoms discussed above. Under such circumstances, these cheap and oversold markets could benefit from continued currency weakness as well as energy price weakness, which could help boost earnings and returns. As such, we would begin moving to overweight positions once Eurozone equities move down 30% from 2015 highs, adding exposure on further weakness. If currencies were also oversold, we would not hedge the currency exposure of these equity positions.
Still Safety in Sovereigns?
Sovereign bonds are expensive, yet still offer valuable diversification characteristics during down markets, as evidenced again in late June. US Treasuries are even more valuable given relatively high yields and technical support from foreign inflows from countries with lower yields. Note that $13 trillion in sovereign bonds now have negative rates—an astounding figure.
Even as one of the high yielders among major developed markets, US Treasuries present risks that are still asymmetric since yields can only go down so far, while the ability to increase is unlimited. The ten-year US Treasury ended June with a yield to maturity of 1.49%. If the Fed were to increase rates to its long-term expectation (as indicated by the most recent median dot plot) and the ten-year yield increased by the same amount (250 bps to about 4%), by the end of three years, a constant maturity bond portfolio would earn an AACR of -3.7%. The bond market is pricing in lower yield expectations; the ten-year yield is expected to be just shy of 2% in three years. Should those expectations be met, the AACR on bonds would be 0.7% annualized, so positive in nominal terms and likely negative after inflation. However, if yields fell to 50 bps in a deflationary rout, a prospect no longer outside of the realm of possibility (and indeed yields have fallen further into July), the compound return would be about 4.5%, or a 14% cumulative return over three years. That would be valuable.
Overall, sovereign bonds, including US Treasuries, are overvalued with low return prospects at current yields, despite their diversifying character. Holding some high-quality sovereign bonds is helpful in providing diversification, but we would limit allocations to these low expected return assets to the minimum amount needed in a stressed environment to meet spending and other liquidity needs. The remainder of the sovereign bond allocation can be put to work in diversifying hedge funds, including global macro and trend-following strategies, with relatively low equity and credit exposure. For investors based in countries with sovereign bonds carrying lower yields, where yield curves are flat, cash is a reasonable substitute for some portion of sovereign bond assets. For US investors, we maintain our preference for TIPS over cash as a substitute for sovereign bonds. US headline inflation remains very low, but with core inflation trending higher (above 2% by some measures), it strikes us as odd that the bond markets are pricing in inflation below 2% for more than a decade to come. Even as growth is low, the unemployment rate at 4.9% is consistent with a tightening labor market. Wages are starting to increase, and the drag on inflation from falling commodity prices and a strong dollar appears to be easing for now. Assuming headline inflation will move up toward core inflation, TIPS are attractive relative to nominal Treasuries.
Conclusion
Of particular importance in times of market volatility associated with an uncertain shock is to make sure there is adequate liquidity—inside or outside of the investment portfolio—to meet near-term needs. Once liquidity needs are taken care of, investors can seek to capitalize on opportunities. In the very near term, we counsel patience, as it is unlikely that market volatility will subside quickly. This means remaining slightly underweight equities by waiting to rebalance into cheaper equity assets. In particular, investors should not rebalance allocations to European equities until they have become more meaningfully undervalued and oversold, and should not rebalance Japanese equities until there is more clarity on the strength of the yen. Eventually, we anticipate opportunities will develop, as markets typically overshoot to the downside in the face of known uncertainty.
For a more thorough discussion on liquidity considerations, please see Mary Cove, “A Holistic Approach to Liquidity Management,” Cambridge Associates Research Report, 2016.
As the market and economic cycles have progressed, we have emphasized the importance of diversification into high-quality sovereign bonds, cash, and hedge funds with less equity and credit exposure. Late last year, we emphasized that investors should evaluate their circumstances to be sure they have sufficient liquidity to support future spending needs, fund unfunded capital calls, and rebalance. For those that have not yet reviewed liquidity needs relative to sources of liquidity, it is not too late. While raising liquidity by selling risk assets in a falling market is not desirable, there are other options, such as securing a line of credit (depending on tax considerations) and reducing future obligations by becoming more selective in committing new capital to private investments if unfunded commitments are above manageable levels. Once liquidity is adequately sourced, investors can focus on opportunistic investments. Opportunities in Europe appear to be developing, as do opportunities in more domestically oriented UK equities and the pound sterling, which is approaching valuation troughs it has reached in other currency shocks. We are also closely watching UK commercial property, which is currently under pressure as foreign owners seek to exit or trim positions.
Footnotes