Advice in Brief
- While we see economic challenges, there are enough signs of growth for us to give the benefit of the doubt to the consensus view that the global economy will see slow growth rather than recession. Given economic crosscurrents, investors should be neutral on risk assets and very selective on cyclical opportunistic investments.
- We remain patient and advise building opportunistic positions on further weakness. To do so, investors must maintain adequate liquidity and diversification.
- Within commodity-related assets, opportunities will likely develop to put capital to work in private energy (both equity and debt). We continue to prefer NREs only to commodities, are constructive on energy midstream MLPs, and remain cautious on high-yield energy credits. We would wait to overweight MLPs relative to equities until valuations become more extreme.
- We see value in emerging markets equities, particularly relative to expensive US equities, over a three- to five-year horizon. Investors should recognize that these assets may not outperform until global growth and/or regional earnings expectations improve.
- High-yield bond pricing is improving, but does not yet provide enough prospective return to be attractive in this environment, particularly given roughly average credit spreads excluding the troubled energy sector.
- Eurozone and Japanese equities (including small caps) remain attractive relative to US equities.
Portfolio Tilts from CA’s Chief Investment Strategist
Show me the catalyst. For years investors have been complaining about high valuations, paltry expected returns, and the lack of low-hanging fruit, or easily identifiable values that are likely to provide handsome profits over the next several years. Today, the fruit is beginning to ripen, offering hope of a sweet reward. But here’s the catch: what is cheap is largely cyclical, leveraged, low quality, and missing any obvious catalyst for a turnaround. Further, the current environment has no historical precedent, causing many investors to feel as if they are navigating the investment orchard without a map.
Please see Sean McLaughlin and Wade O’Brien, “Outlook 2016: Do You Know Where Your Risk Tolerance Is?,” Cambridge Associates Research Report, December 7, 2015.
In this edition of VantagePoint, we briefly discuss economic growth prospects, reaffirming the need to be cautious about cyclically oriented assets in an environment of low growth and severe weakness in some corners that could potentially spread. In other words, we remain patient in evaluating opportunities and set high standards for taking cyclical risk. We review our outlook for cheap assets that keep getting cheaper (commodity-related assets and emerging markets equities), evaluate the case for high-yield bonds as yields and spreads have widened, and revisit our global developed markets equity recommendations, which we discussed more fully in our recent 2016 outlook published in December.
Within commodity-related assets, we continue to be neutral on natural resources equities (NREs), negative on commodities, and constructive on energy midstream master limited partnerships (MLPs). With recent further weakness in commodity prices, we suspect opportunities for private equity and distressed debt in energy will develop in the coming months. We see value in emerging markets equities for patient investors, particularly relative to expensive US equities. High-yield bond pricing is improving, but does not yet provide enough prospective return to be attractive in this environment, particularly given roughly average credit spreads excluding the troubled energy sector. Eurozone and Japanese equities (including small caps) remain attractive relative to US equities.
The Fork in the Road
As we see it, the economy could head down one of two main paths that have entirely different investment implications:
- Consumer-driven growth led by lower commodity prices, particularly lower gasoline prices.
- Global recession caused by a slump in manufacturing and commodities and US$ strength.
For now, as discussed in last quarter’s VantagePoint, we accept the consensus view that the global economy will avert recession even as the manufacturing and commodity sectors struggle, but cannot rule out the possibility that weakness will spread. Global growth remains low and has been in secular decline amid rising debt burdens and worsening demographics that have taken their toll on productivity (Figure 1). Credit spreads have risen, and US$ strength has pressured US growth and strained offshore US$ borrowers with inadequate US$ revenues to support higher US$ debt costs. Policymakers have limited levers to boost growth if it stalls, as monetary policy has become less effective amid falling policy yields and rising asset risk premiums, while high sovereign debt levels across much of the globe limit the ability to use fiscal policy. At the same time, political risks remain elevated and policy error is a reasonable possibility, as Chinese policymakers most recently have reminded us.

Figure 1. A Structural Slowdown in the Developed World
1960–2015 • Percent (%)
Sources: BCA Research Inc. and The Conference Board.
Note: Data are annual.
Meanwhile, growth has been improving, with economic reports for developed markets, even for Europe and Japan, showing slow improvement. In fact, relative to the last decade, developed markets growth is generally improving—the 2.0% estimated growth rate in 2015, while slow, is well above the ten-year average of 1.4%. Emerging markets growth has clearly slowed, but remains above that of developed markets and is expected to improve from 4.0% in 2015 to 4.5% in 2016 based on International Monetary Fund estimates.
Further, the world appears to be operating on two speeds: a sharp slowdown in manufacturing growth and expansion in services. Yet services, which account for over 60% of global GDP (about 80% of GDP in the United States), are arguably more important for supporting growth today (Figure 2). Service growth may be given more of a boost by low commodity prices, should they be sustained. So far, US consumers have increased their savings rates rather than boosting their consumption more significantly, but this latest leg down in gas prices could spur spending, particularly if wages also increase, which is beginning to happen.

Figure 2. Global Services Holding On as Manufacturing Growth Slows
December 31, 2012 – November 30, 2015 • PMI Index Level
Sources: CIA World Factbook, J.P. Morgan Securities, Inc., and Thomson Reuters Datastream.
Overall, we see economic challenges, but there are enough signs of growth for us to give the consensus the benefit of the doubt. We reaffirm our view to be neutral on equities and very selective on cyclical opportunistic investments, demanding highly skewed reward relative to risk. We remain patient and advise building opportunistic positions on further weakness. To do so, investors must maintain adequate liquidity and diversification to support future spending needs and capital calls, as well as rebalance.
Chronic Commodity Myalgia
Commodities and commodity-related assets took a nose dive at the end of 2015 that has persisted into the start of 2016. The failure of OPEC to arrive at an agreement on a quota at the end of the year seemed to be the nail in the coffin for oil prices, as the forward curve once again shifted downward and all assets pricing in forward oil price expectations were re-rated downward once again (Figure 3). Even an escalation of tensions between Iran and Saudi Arabia was not enough to give oil prices a lift.
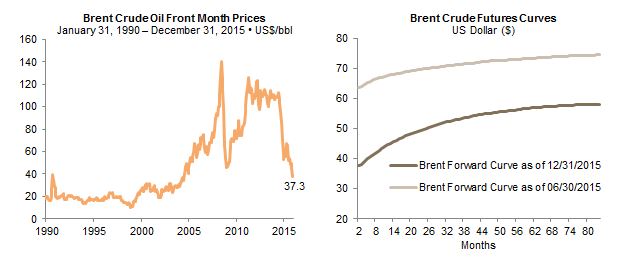
Figure 3. Oil Prices Fall Sharply Across the Forward Curve
Source: Bloomberg L.P.
Please see the fourth quarter 2015 edition of VantagePoint, published October 14, 2015.
At the start of last quarter, we provided an overview of the commodity-related investment landscape, concluding that there are too many variables to have high conviction in any one outcome. However, our base case assumption regarding oil is that it will take time for companies and markets to adjust to the end of the commodity supercycle and that prices may be range bound at lower levels for some time as markets, not OPEC, set prices, and the marginal cost of production finds a cyclical bottom.
From an investment standpoint, this means patience is a requirement for opportunistic investments. After all, commodity-related assets can continue to get cheaper from here, and if commodity prices do not recover before the next economic recession, better entry points may be ahead. As such, we continue to set a high bar for investing in cyclical assets—the potential reward must be high to withstand the volatility that is likely ahead in such investments. Our advice this quarter is unchanged in this space: we remain constructive on private equity energy, neutral on NREs despite their apparent cheapness, and constructive on energy midstream MLPs. As discussed in a later section, we remain cautious on high-yield energy credits. Given the growing stress in MLPs, we revisit our investment thesis, addressing concerns we are hearing from investors.
Energy Master Limited Partnerships—Bargain or Broken?
Please see the fourth quarter 2015 edition of VantagePoint and Kevin Rosenbaum et al., “Energy MLPs: Attractive Yields in a Time of Uncertainty,” Cambridge Associates Research Note, October 2015.
Last quarter, we recommended overweighting actively managed, defensive midstream energy MLPs relative to other natural resource–related assets. Our thesis is that MLPs have sold off in sympathy with various energy-related assets like E&P equities, as oil & gas prices have plummeted anew, and that the careful evaluation of characteristics including basin economics, contract types, and entity structures may lead to outperformance relative to a broad benchmark for the sector. We concluded that distribution yields of 8%, even with prospects for lower distribution growth, provide an attractive opportunity for those bold enough to buy, even though we couldn’t call a bottom. And no bottom has been reached. MLPs have continued to sell off, bringing the Alerian MLP Index down 50% from August 2014 through the low on December 14, 2015. In the wake of Kinder Morgan’s 75% dividend cut,[1]Moody’s took a negative view of Kinder Morgan’s announcement that it would buy a stake in another pipeline company, arguing that the agreement would place “additional pressure on its already … Continue reading investors are questioning the MLP business model and asking whether it is sustainable or doomed to fail. We continue to believe energy midstream MLPs are attractive if approached selectively, as managers are also finding poorly run MLPs to successfully short.
Given growing worries about the MLP business model, we further address below the key concerns we have been hearing.
Is the cost of capital for MLPs too high? Are capital markets closed? This is certainly the case for equity financing given depressed equity prices would result in meaningful dilution through equity capital raises. MLPs typically finance new projects using a mix of equity and debt. Today they are largely relying on debt financing and undistributed cash flows. Many MLPs with investment-grade ratings that are conservatively managed have maintained their access to debt financing at rates of 5% to 7%, below their expected return on investment for capex. The question remains as to whether companies, shut out of equity market financing, will entirely finance growth through debt, in some cases risking debt rating downgrades that would really limit financial flexibility, potentially leading to project delays, suspensions, and/or cancellations. For now, fund-raising activity continues but has slowed. Leverage fundamentals are consistent with historical levels (Figure 4), operating cash flow of around $30 billion for the Alerian MLP Index easily covers distributions and maintenance capex, and alternative financing, such as convertible preferred, may help MLPs through an extended period of more limited financing options.

Figure 4. Debt Fundamentals of Alerian MLP Index Appear Consistent With Historical Levels
Fourth Quarter 2000 – Fourth Quarter 2015
Source: Bloomberg L.P.
Notes: Data are quarterly values on a trailing 12-month basis. Fourth quarter 2015 values are estimates.
How vulnerable are MLPs to lower energy prices? While the degree of price risk is not entirely transparent, midstream energy MLPs have the majority of their revenues contractually tied to volume, not energy prices. Price risk exists even with contracts based on volume if low prices last for an extended period, threatening the viability of production through higher-cost basins. Even as oil prices fell 35% in 2015 and gas prices fell 23%, building on prior year declines, revenues thus far have held up reasonably well (Figure 5) and distribution growth has also been sustained (Figure 6).

Figure 5. Quarterly Trailing 12-Month Revenue for MLPs Has Been Stable
Fourth Quarter 2000 – Fourth Quarter 2016 • US Dollar (millions)
Sources: Alerian and FactSet Research Systems.
Note: Orange bars are estimates.
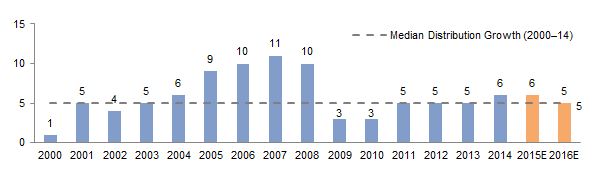
Figure 6. MLP Distribution Growth Has Been Sustained Thus Far
As of December 11, 2015 • Percent (%)
Sources: Bloomberg L.P. and Tudor, Pickering, Holt & Co.
Notes: Orange bars are estimates. Distribution growth is based on year-over-year change in median distribution. The Wells Fargo MLP Index is a float-adjusted, capitalization-weighted index that seeks to measure the performance of all energy MLPs listed on the NYSE or Nasdaq that satisfy market capitalization (at least $200 million at the time of inclusion) and other eligibility requirements.
Are fees vulnerable to renegotiation? To date, fee renegotiation has been limited. When renegotiation has resulted in revised economics, it has been in exchange for some enhancements for the midstream companies such as longer-lived contracts, more acreage dedication, and more volume commitments, all of which were part of the Williams Companies/Chesapeake Energy negotiation last year. The degree to which this is a positive or negative will be situation dependent.
Will there be widespread distribution yield cuts? Some analysts postulate that MLPs will follow the path of Kinder Morgan and slash dividends to improve balance sheets. Goldman Sachs in a recent report[2]Theodore Durbin et al., “Americas: Pipelines and MLPs,” Goldman Sachs Equity Research, December 17, 2015. argued that MLP management teams should choose to slow or halt dividend growth to maximize financial flexibility if energy prices stay lower for longer, as they expect. Management teams will have to make difficult decisions between defending credit ratings to keep debt costs manageable, deferring or delaying cash-flow financed capex to increase distribution coverage, and maintaining or growing dividends. The authors of the Goldman report stop short of suggesting distributions should be cut, but extending their logic, that is certainly a possibility, although a more difficult choice given management would see incomes fall as a result of compensation structures. It is difficult to gauge how much the market would penalize such MLPs. While it seems obvious that distribution cuts would result in an initial sell-off and scare off investors buying MLPs for yield, in stressed situations the benefits to balance sheets might well outweigh the costs from an economic standpoint, provided that the cost of equity capital ultimately recovers.
Some MLPs are better run than others, and some have more oil price exposure than others. MLPs with high-quality, diversified assets; limited energy price exposure; manageable leverage; supportive general partner sponsors; continued access to debt markets; and conservative cash management practices are highly likely to provide strong returns to investors over time. Of course, the more of these characteristics MLPs maintain, the less of a bargain their valuations, but we believe a reasonable balance can be struck between risk and reward. At the index level, as of year-end, a reversion of the Alerian MLP Index to “normal” conditions over the next three years, where distribution yields fall back to their 7% average and 5% distribution growth is maintained, results in a three-year average annual compound return of nearly 20%. If distributions stayed flat, while yields returned to average, annualized returns would be closer to 15%. This is attractive compensation for the risk taken, although we would prefer to sacrifice some yield through careful active management, as some of the riskiest index constituents have the highest yields on offer. The downside risks discussed earlier are worthy of consideration, particularly should oil & gas prices stay unsustainably low as they are today. Still, MLPs are likely to outperform commodities and NREs under such stressed conditions, although the reward to NRE investors is likely to be higher should oil & gas prices surprise significantly to the upside.
We would not yet advocate overweighting MLPs relative to equities, but would wait to see if distribution yields and valuation multiples, such as enterprise value–to-EBITDA ratios, hit more extreme levels. At the depths of the global financial crisis, distribution yields increased to 12%, and EV/EBITDA ratios dropped to near 8, compared to today’s cheap valuations of 8.4% and 9.8, respectively.
Emerging Markets Equity—the Cheap Get Cheaper
The continued pressure on emerging markets remains frustrating to investors that initiated overweights (as we recommended) when valuations first became cheap. Emerging markets returned -5.4% in local currency terms, but -14.6% in US$ terms, underperforming developed markets by 13.7 ppts. Much of this weakness was from the continued deterioration in emerging markets currencies, which accounted for just over half of underperformance.
For a more expanded discussion of these risks, please see Sean McLaughlin and Wade O’Brien, “Outlook 2016: Do You Know Where Your Risk Tolerance Is?,” Cambridge Associates Research Report, December 7, 2015, and the fourth quarter 2015 edition of VantagePoint.
The combination of slow growth in China, falling commodity prices, and a strong USD/weak RMB, among other risk factors, hurt the asset class in 2015. The start of 2016 has also not been kind to emerging markets equities for largely the same reasons, although it would seem as if developed markets equities are sharing equally in the pain. Still, we maintain our recommendation for modest overweights in emerging markets equities for patient investors with at least a three- to five-year time horizon. Investors should be aware that these assets may not outperform until estimates for global growth and/or regional earnings are upgraded, and the timeframe for this remains uncertain. Commodities, China, and currencies remain meaningful risk factors. However, investors should recognize that over the long term there is significant value to be gained when valuations ultimately revert to more normal levels. We caution that selling overweight positions today in frustration over the performance of the last few years would lock in losses relative to developed markets unless the capital is rotated into opportunities with similar upside. Most often, investors that sell out of frustration tend to invest in what has done well recently at relatively high valuations just in time to suffer underperformance. Time and patience are your friends when you are early to invest in value.
The China Factor
Please see the first quarter 2015 edition of VantagePoint, published January 20, 2015, as well as Sean McLaughlin et al.,“The Investment Compass Points Due East: Asia’s Appeal to Emerging Markets Equity Investors,” Cambridge Associates Research Note, June 2015.
At the start of 2015, we recommended focusing modest emerging markets overweights on Asia ex Japan or Asian emerging markets. Of course, an overweight to Asia means somewhat more exposure to China[3]Emerging Asia now accounts for roughly 70% of the MSCI Emerging Markets Index, diminishing the impact of this tilt relative to historical weights. and countries dependent on China for trade. However, a China slowdown more acutely affects net commodity exporters like Brazil than Asia as a whole. Slower Chinese growth puts even more pressure on commodity prices, further squeezing corporations and economies dependent on their revenues. While not immune, Asia is more insulated from commodity risk and as a net commodity importer can actually benefit from weakening commodity prices.
Still, Chinese growth represents a risk to emerging markets that is difficult to quantify. The country’s transition from investment-led growth to a more consumer- and services-oriented economy will take time and requires slower growth. While services have become a larger share of the economy and have been holding up well, this should not be taken as evidence that China has successfully diversified its economy. Services in China are more aligned with the industrial sector (e.g., finance, wholesale distribution, property) than is the case in some other countries, like the United States, where technology and health care dominate. Such a linkage suggests that weakness in China is likely to spread to the service sector. Further, weak corporate profits drive wages, and may ultimately slow consumption.
Overall, we believe China will continue to muddle through and has enough back-stops to avoid a crisis. However, the adjustment to a slower growth model is not going to be smooth and will continue to shake markets. Policymakers continue to have the difficult task of implementing important reforms to rebalance the economy and liberalize the financial system, while seeking to dampen the impact of slower growth through accommodative monetary and fiscal policy. To the extent reform is emphasized, a continued gradual economic growth slowdown should be expected. Although this may result in more signs of stress in the corporate sector, it is necessary for the long-term health of China’s economy, which would be positive for the global economy as well.
See Aaron Costello and Jason Widjaja, “Assessing the Likelihood of Another EM Currency Crisis,” Cambridge Associates Research Note, September 2015.
An important consideration for investors overweighting emerging markets is continued prospects for currency weakness, especially should the renminbi continue to weaken. China needs a weaker currency to offset deflationary pressures and allow for additional monetary easing, but too sharp a devaluation would be detrimental to China’s interests. China’s currency has barely budged in recent years compared to emerging markets currencies as a whole, not to mention the Japanese yen and the euro. It has become too costly for China to hold the renminbi steady versus the US dollar while other currencies weaken. After falling 6% from its April 2015 highs, the consensus is that the renminbi will continue to weaken this year, potentially to the USD/CNY 6.8–7.0 range, which implies a 4% to 8% decline from the 6.5 level seen in early January. A large one-off or disorderly devaluation in the renminbi, while possible, seems unlikely, as China still runs a current account surplus and holds ample reserves. Of course, the degree to which the renminbi actually weakens is also a function of how much the US dollar strengthens. While most emerging markets investors do not have direct exposure to China’s currency, as Chinese H-shares are traded in Hong Kong dollars, a weakening renminbi is a headwind to emerging markets currencies more broadly, as competitive pressures build to gain market share of a shrinking global trade pie. Although the path of least resistance for the renminbi is down, we believe a broad-based emerging markets currency crisis can be avoided and that Asian currencies are better placed to hold their value amid a strong dollar, weak commodity price environment.
Time Is Your Friend
The very fact that emerging markets weaknesses are widely known is what makes the area of interest to long-term, value-oriented investors. Emerging markets equities, both in aggregate and specifically in Asia, are now very undervalued, currencies are depressed, and investor outflows have retraced much of the cumulative net inflows seen over the 2009 to early 2013 period.
There are still plenty of things to worry about in emerging markets, but valuations are cheap, particularly relative to US equities. At the end of December, based on our composite normalized price-earnings (P/E) metric, emerging markets equities were 26% undervalued, compared to 30% overvalued for US equities, with the P/E of emerging markets equities less than half that of US equities. January 1998 provides a useful parallel. Relative valuations between emerging markets and US equities were similar and, like today, emerging markets equities had not yet felt the full brunt of the 1998 crisis, which didn’t see markets bottom until September of that year. While emerging markets equities did rebound strongly in 1999, it really wasn’t until the end of 2002 that they began to outperform US equities in US$ terms. An investor that had overweighted emerging markets equities relative to developed markets equities in January 1998 would have underperformed US equities by -4.0 ppts annually over the next five years, yet the ten-year annualized relative return of 8.6 ppts more than made up for the earlier underperformance. Indeed, this investor would still be ahead of US equities today, even after recent underperformance. Furthermore, while relative valuations are comparable to those in January 1998, absolute valuations are cheaper—our composite normalized P/E ratio is 10.9 (the 4th percentile) compared to roughly median valuations in 1998.
Although investors probably have not yet seen the bottom for emerging markets, the potential reward for those that can hold on and stomach what could be an extended period of volatility is sizeable. Those that drop out will lock in losses, perhaps rotating capital to more expensive assets. We have seen this movie before, and it ends in long-term underperformance. The key to contrarian, value-based investing is that time is your friend. As long as valuations are low enough, even if you are early, time will bail you out.
High-Yield Bonds Starting to Turn Heads
Sell-side strategists and multi-asset fixed income managers are becoming increasingly optimistic about high-yield bonds. In our view, the uncertainty in the economic environment, low absolute yields, and the requirement for a higher-than-historical illiquidity premium suggest investors would be better off waiting before charging into high yield, while recognizing that attractive opportunities are beginning to develop. As the cycle advances, multi-strategy hedge fund managers and distressed managers with demonstrated success in credit in prior cycles will be best positioned to take advantage of further credit dislocation/distress.
Just by the numbers, it is easy to see how some investors are becoming more enthusiastic about high-yield bonds. The option-adjusted spread (OAS) of the Barclays High Yield Bond Index, at 660 bps, is 140 bps above its historical average, even if you exclude the energy sector. Historically, spreads at this level have consistently produced positive nominal returns over the subsequent three years, at least since the index’s inception in 1994 (Figure 7). OAS levels do provide some degree of safety. High-yield bonds would break even with Treasuries at a five-year cumulative default rate near 40%, assuming losses of 70%, or 35% excluding energy. This is more than twice the 18% average, and above the highest five-year cumulative default rate of 32% since 1970, when our data begin (Figure 8).

Figure 7. High-Yield OAS Suggests Positive Three-Year Returns Likely From Current Valuations
January 31, 1994 – December 31, 2015
Source: Barclays.

Figure 8. US High-Yield Five-Year Cumulative Default Rates Have Topped Out at About 30%
1970–2011
Source: Moody’s Investors Service.
Still, as default rates remain low—near 2% on a trailing 12-month basis—and spreads are slightly elevated, painting a negative picture is also easy. Defaults are beginning to pick up, even outside of the natural resources sector, issuance is slowing, the quality of recent issuance has been deteriorating, and technicals for the sector have become challenging amid waning investor demand. At the same time, as discussed earlier, US economic data suggest the economy is likely to sustain growth despite stress from emerging markets, commodities, and manufacturing (as it did in the late 1990s), but this is by no means guaranteed. Investors should move gradually, seeking to invest in low-quality, cyclical assets at significant discounts. Even as the OAS is high, excluding the energy sector, it is only 60 bps above its long term average. Further, the risk-free Treasury yield is still quite low, resulting in a total market yield of 8.7% that falls short of the 9.4% average. Before 2010, the yield on high-yield bonds had never been as low as it is today with an OAS this high. In fact, the current yield remains below its historical average, even as the OAS ranks in the 78th percentile.
For more discussion on the illiquidity risk in bond markets, please see Eric Winig, “Should Investors Be Worried About Corporate Debt Liquidity?,” CA Answers, May 5, 2015, and Eric Winig et al., “Corporate Bonds: The Next Liquidity Crisis?,” Cambridge Associates Research Brief, September 8, 2014.
Liquidity is another consideration, as the high-yield bond market has become materially more illiquid, suggesting that the default risk premium may not be as high as it appears since it incorporates an elevated illiquidity premium. The Volcker Rule has resulted in a reduced willingness of brokers and dealers to make markets in high-yield bonds, with the slack taken up largely by mutual funds, but also exchange-traded funds (ETFs).[4]High-yield bond mutual fund investors face a liquidity mismatch between the investment vehicle that offers daily liquidity (or real-time liquidity in the case of ETFs) and the liquidity of the assets … Continue reading It is unclear how much of an additional illiquidity premium is appropriate, but yields have been rising as dealer inventory has declined, particularly since April 2014 when investors started moving capital out of high-yield bond funds (Figure 9).
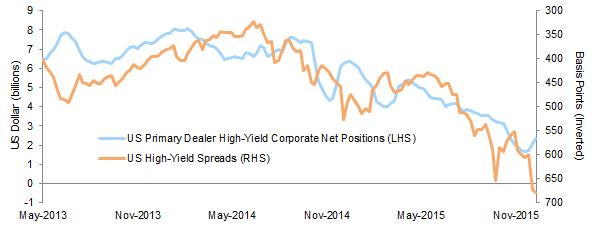
Figure 9. High-Yield Bonds Require Higher Illiquidity Premiums Today
May 8, 2013 – December 18, 2015
Sources: Barclays and New York Federal Reserve.
Notes: US primary dealer data are six-week moving averages. US high-yield spreads represent OAS data from the Barclays US Corporate High Yield Index. High-yield spreads axis is inverted.
High-yield bonds and yield spreads may turn around should conditions improve and confidence return, as was the case following spread widening in 2011. However, if this transpires, other risk assets may very well be the superior choice. High-yield bonds tend to outperform equities more often in down markets. In fact, while high-yield bonds outperformed US equities in 100% of the rolling 36-month periods in which US equity returns were negative, they outperformed in only a quarter of periods in which US equity returns were positive.
Searching for Black Gold
The energy sector is a wild card for high-yield investors, accounting for 11% of market capitalization. Issuance has soared in recent years, and fundamentals have deteriorated sharply. At this time last year, we were advising investors to be cautious on energy credit. Not enough stress had been felt, and many investors were expecting a rapid reversal in oil markets. We are slightly more constructive today, as the pessimism that now prevails has pushed the average price of energy-related credits to $0.66 and OAS to levels that price in significant default risk. Over the fourth quarter alone, yields escalated from 12.5% to nearly 16%, while OAS increased by almost 300 bps to 1,296 bps to reach breakeven five-year cumulative default rates of 50% to 60%, assuming losses of 70% to 80%.
However, the increase in energy credit yields and spreads appears to reflect the increased potential for restructuring and default should oil prices follow the path priced into the oil futures strip. By some estimates, as much of half of the high-yield energy credit complex could restructure in a base case of oil price “recovery” to $50 oil in mid-2017. Through this lens, the market as a whole appears fairly priced to slightly cheap. For high-yield energy credit to be attractive, you have to believe energy prices will go up faster and/or higher than today’s strip pricing. One catalyst for increased defaults is the potential for borrowing base redeterminations to be more severe this spring than they were last year. However, if the economy holds up and banks do not have need for large reserves elsewhere, they may continue to be lenient in the borrowing base discussions with energy companies. Should high rates of default transpire, this will open up opportunities in private energy (both equity and debt), which may very well provide superior opportunities to unsecured debt.
A near-term catalyst for conditions to get worse is the potential for borrowing bases to be adjusted downward. Thus far, banks have been lenient, but if that changes this spring, distress in the sector could easily rise, especially if combined with continued weak commodity prices and the rolling off this year of oil price hedges held by commodity producers that sold production forward at more attractive pricing than prevails today. To the degree this transpires, private equity and distressed debt managers looking to control the equity will see their opportunity set expand. Private energy may be the best way to participate in energy opportunities that develop.
Japan and Eurozone Look Set to Outrun US Equities
Please see Sean McLaughlin and Wade O’Brien, “Outlook 2016: Do You Know Where Your Risk Tolerance Is?,” Cambridge Associates Research Report, December 7, 2015.
We provided a detailed review of our outlook for developed markets equities in our recent 2016 outlook published in December. Our views have not changed over the course of this month. A summary of our views and advice follow.
We continue to regard Eurozone and Japanese equities as the most attractive developed markets and recommend overweights relative to US equities on a currency hedged basis. US equities have stretched valuations and are relatively advanced in the earnings cycle, in contrast to more reasonably valued Eurozone and Japanese equities that appear to have more room for earnings expansion.
The case for Eurozone equities is based on slow improvement in revenues boosted by high operating leverage combined with reasonable valuations. Economic growth and revenues have benefited from negative policy rates, a weakening euro, lower energy prices, and improving credit conditions. The gap between corporate profit margins in Europe and the United States remains wide, with the Eurozone at depressed levels in contrast to the United States, which is just off peak margins. The gap appears to be closing, favoring European equities.
Wade O’Brien et al., “Japanese Equities: It’s Not Too Late to Capitalize on the Recovery,” Cambridge Associates Research Note, January 2016.
Similarly, Japanese equities have benefited from a slowly improving economy and related slow growth in revenues combined with high operating leverage. At the same time, changes in policy such as a reduction in corporate tax rates and incentives to corporations to increase their focus on returning value to shareholders (including increasing dividends and buybacks) have helped improve profitability and returns to equity investors. Technicals have also been supportive amid central bank and large pension plan purchases. Extending Japanese equity overweights to include smaller-cap companies may provide some defense against prospects of a strengthening yen. In addition to being more domestically oriented, such companies may be appealing given reasonable valuations and more potential for upside from dividend increases and share buybacks, as smaller-cap companies have lagged their larger-cap peers on this front.
In contrast, US equities remain expensive and earnings are challenged by cyclically high profit margins that peaked late last year. Pressure on profit margins may increase given slow revenue growth, higher debt servicing costs, and prospects for higher wage costs as labor markets tighten. Labor’s share of income has been depressed for some time. As the labor market tightens, it is reasonable to expect that employees will see wages increase—tentative signs of such increases can be seen already. Given excess capacity globally, US companies may find they cannot pass along cost increases in the form of higher prices but rather must accept lower margins. A strong US dollar and energy sector weakness may continue to be a drag on US earnings.
Even as the US dollar has become more expensive and the yen and euro have stabilized relative to the US dollar, we continue to recommend hedging currency exposure related to these overweight positions, although we do not regard this to be as important as we did a year or so ago when we initiated the equity overweight recommendation. Conversely, with regard to the yen, we would generally not recommend hedging exposure beyond overweight equity positions. The yen tends to appreciate when global equities decline in value, meaning that hedging too much yen exposure could accentuate underperformance in a down market (Figure 10).

Figure 10. Japanese Yen/USD Is Countercyclical to Global Equities
First Quarter 1996 – Fourth Quarter 2015 • Percent (%)
Sources: MSCI Inc. and Thomson Reuters Datastream. MSCI data provided “as is” without any express or implied warranties.
Notes: Up and down markets are defined by the quarterly total return of the MSCI World Index in local currency. Performance of yen is in US$ terms. Average return is based on arithmetic mean.
Conclusion
As we survey the fruit in the orchard, much is ripening, but little is ready for picking. We are willing to be patient, waiting for opportunities with a risk/reward balance more likely to produce a sweet reward. We continue to emphasize the importance of maintaining adequate liquidity and diversification. Now is the time to be certain that liquidity is sufficient to support future spending needs and capital calls, as well as rebalance.
Footnotes