Advice in Brief
- We generally remain neutral on risky assets, but are becoming more cautious and selective as the market cycle advances and the US Federal Reserve looks to begin raising rates. We maintain our advice that investors shift more capital into safer assets as equity markets become more expensive.
- Volatility has been rising in some corners of the market and limited liquidity conditions in bond markets continue to be of concern. Competitive currency devaluations and the growing pervasiveness of negative yields add another degree of uncertainty and volatility. Diversification and safety are becoming increasingly important.
- We maintain our view to underweight US equities and overweight Eurozone and Japanese equities on a currency hedged basis, as well as overweight Asia ex Japan/emerging Asian equities. The Fed and the Bank of England have passed the baton to the Bank of Japan and the European Central Bank in the race to reflation; historical precedent suggests that risky assets in these economies will benefit. These markets also offer value relative to US equities. We recommend maintaining at least neutral US$ exposures and considering strategic currency hedges.
- Current dynamics in the oil market suggest that prices could stay low for some time. If this transpires, distressed opportunities will emerge. Capital commitments to private equity energy managers with the ability and skill to acquire upstream assets from distressed owners and distressed oilfield services businesses from unnatural owners offer the best energy opportunities today.

Portfolio Tilts from CA’s Chief Investment Strategist
So far in 2015, market performance has reflected relative trends in monetary policy. US and UK equities have underperformed as the US Federal Reserve and Bank of England (BOE) seek to tighten monetary policy at the same time as the Bank of Japan (BOJ) expands its quantitative easing (QE) program and the European Central Bank (ECB) launches its own QE program. Chinese equities have also sprung back to life as the People’s Bank of China (PBOC) has begun to ease monetary policy.
Given that divergent monetary policy is likely to continue to drive equity markets, this edition of VantagePoint reviews the policy phases since the start of the 2008 financial crisis to provide context in evaluating what this period of diverging policy may portend. We also discuss the case for currency hedging in light of the rapid appreciation of the US dollar, as well as opportunities in the real assets space given the dramatic tumble in the price of oil. Our investment views remain largely the same as expressed last quarter. We remain neutral on risky assets in general, but are becoming more cautious and selective as the market cycle advances and the Fed looks to begin raising rates. We have been recommending since the middle of last year that investors shift more capital into safer assets—more fundamentally driven hedge funds and Treasuries—as equity markets become more expensive.
The Policy Playbook
Everyone knows the playbook by now. The earliest movers in expansionary policy (fiscal and monetary) are the first to recover. Laggards still have a chance, but they need to pour it on. Such are the lessons of the Great Depression and the Global Financial Crisis (GFC)—the two major global recessions of the last century.
Although the causes of the Great Depression continue to be hotly debated even now, it seems clear that the rigidity of maintaining a gold standard constrained monetary policy and led to a self-reinforcing deflationary spiral. By being the first to abandon the gold standard in 1931, Great Britain was spared most of the economic pain. In contrast, the United States waited until 1933 to move off the gold standard and suffered a much worse recession with persistent unemployment and underperforming equity markets.
Similarly, the policy response to the GFC largely dictated the relative performance of asset markets. Equity market leadership has shifted since 2008 amid what we see as three distinct policy phases (Figure 1).
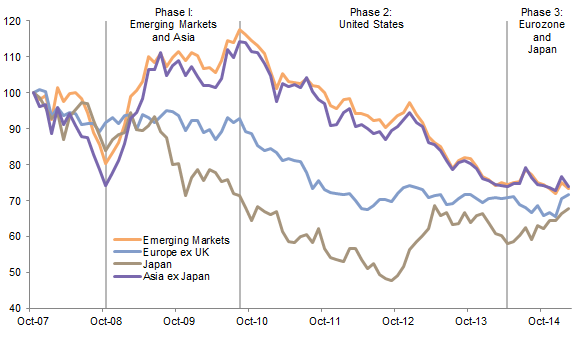
Figure 1. Relative Performance vs MSCI US
October 31, 2007 – March 31, 2015 • Local Currency
Source: MSCI Inc. MSCI data provided “as is” without any express or implied warranties.
Notes: Total returns for MSCI Emerging Markets indexes are gross of dividend taxes. Total returns for MSCI developed markets indexes are net of dividend taxes.
Phase 1: 2008–10
Late 2008 saw a wide range of fiscal and monetary stimuli deployed across both developed and emerging markets. The Fed’s decision to launch QE was a critical turning point, but China’s massive credit-fueled stimulus was especially large (as a percent of GDP) and effective. This helped drive explosive outperformance by emerging markets and Asian equities.
As demand for its exports collapsed, China moved aggressively by unleashing a massive stimulus program largely focused on fixed asset investment. This stimulus had a clear impact on the rest of Asia and the global economy more broadly as Chinese imports increased, benefitting Asian industrial production as well as commodity-exporting countries.
Phase 2: 2010–14
Policy divergence began in late 2010 as China and other emerging markets began to tighten monetary policy in the face of inflationary pressures, policymakers globally generally kept fiscal policy tight, and the Fed and BOE expanded QE programs. Over this period, US equities powered ahead, Japanese, Eurozone, and emerging markets equities lagged, and UK equities fared in the middle.
US and UK central banks were able to at least partially offset some of the impact of fiscal austerity as the Fed launched several rounds of QE and the BOE also expanded its QE program. In contrast, the ECB’s relatively tight monetary policy and Germany’s focus on fiscal austerity helped perpetuate the Eurozone crisis. Following Mario Draghi’s statements about the ECB’s commitment to supporting the Eurozone in July 2012, the region’s sovereign bond and equity markets began to price in both a reduction in sovereign default risk as well as rising expectations that the ECB would begin a QE program. Market progress was limited, however, by concerns over stagnant economic growth and deflationary pressures amid depressed earnings growth.
Similarly, while Japan struggled to cope with a surging yen and a timid BOJ, equity markets began to price in improved expectations in October 2012 as optimism rose that Shinzō Abe’s Liberal Democratic Party would win the December 2012 election on a platform of expanded QE, fiscal policy, and structural reform. Japan did indeed join the QE bandwagon in 2013, helping to trigger a sharp depreciation in the yen and an explosive rally in Japanese equities, only to be short-circuited by premature fiscal tightening.
Phase 3: 2014–Today
The current phase is exemplified by low but stable growth in the United Kingdom and United States following years of monetary policy easing. The BOE and Fed have ended their QE programs and are looking for an opportunity to begin normalizing monetary policy. This policy shift has resulted in underperformance of these two markets in 2015. At the same time, the relatively depressed Eurozone and Japan are taking the lead with aggressive monetary policy, with the ECB finally launching full-fledged QE in March. China has also started to ease monetary policy following four years of tight policy designed to fight domestic credit excesses. The rest of emerging markets are bifurcated. Those able to ease are doing so, whereas those facing balance of payments pressures and inflation are caught between a rock and a hard place.
Playbook Review
This brief review of the policy phases since the GFC highlights that the relationship between capital market performance and fiscal and monetary policy is somewhat complex and has continued to evolve. The balance between fiscal austerity designed to bring high public sector leverage into control and accommodative monetary policy has been critical, as those relying too heavily on fiscal austerity have struggled under sagging economic growth and rising debt ratios (Figure 2). The Eurozone has particularly struggled on this front. However, the IMF and ECB have largely reversed their stance on austerity, recognizing that it can create a drag on economic growth if too excessive and too early in the recovery process. This has opened the door for some compromise, particularly if exchanged for progress on structural reforms (e.g., Italy). However, Greece’s hard-line demands on this front seem far wide of the mark relative to where Eurozone leadership appears willing to bend.
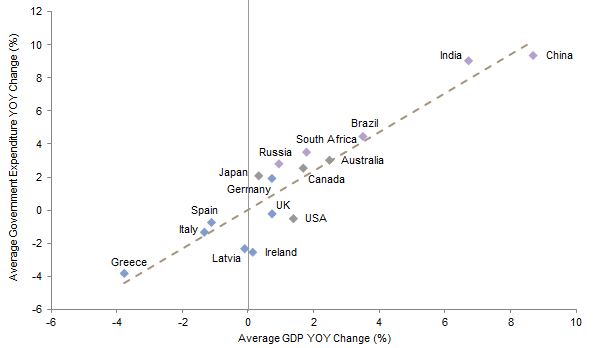
Figure 2. Change in Government Expenditure vs Change in GDP
2009–14 • Local Currency
Sources: OECD and Thomson Reuters Datastream.
Notes: GDP and government expenditure in constant prices. India GDP growth for 2012–14 represents changes in accounting standards. Using the old methodology, India’s average 2009–14 GDP would have been 6.4%.
Another critical shift in the current policy phase is the role of currencies given ultra-low interest rates across much of the globe. The reduction of interest rates has been an important QE mechanism, promoting credit expansion, improving sovereigns’ ability to finance debt loads, and pushing investors to move out the risk spectrum in search of higher returns. Figure 3 shows the relationship between initial ten-year interest rates and subsequent GDP growth. If this relationship were to hold for the Eurozone, it would suggest that the ECB’s program would be of limited utility given how low rates are today. Excluding Germany from the Eurozone implies that the impact may be greater. As such, the ECB’s QE program cannot rely too heavily on reducing already low interest rates (nor can low interest rates spur wanting demand). However, the ECB has succeeded in weakening the euro to a degree that should encourage export growth and provide a boost to corporate earnings. Japan is in a similar situation with regard to rates, of course, and has also been relying on a weaker yen. In a world of near-zero policy rates, currencies have become a key lever of monetary policy, and markets with weak currencies are generally outperforming (in local currency terms) those with strong currencies.

Figure 3. Ten-Year Government Bond Yield vs One-Year GDP Percent Change from QE Start
Sources: European Central Bank, OECD, and Thomson Reuters Datastream.
Notes: Eurozone periphery government ten-year bond yield is the average of Italy, Portugal, and Spain. The German ten-year bund yield is used for the Eurozone bond yield. The Eurozone periphery QE estimate and Eurozone QE estimate are derived from the trendline equation.
Trim Profits, but Maintain Select Global ex US Equity Overweights
At the start of the year, we reaffirmed our recommendation to maintain neutral weights to equities as a whole, and within equities underweight US equities. However, we advocated keeping such underweights relatively modest in the absence of very cheap assets to overweight and in recognition of the somewhat defensive character of US equities. We modified our developed markets equity overweight position from overweighting only Europe to a mix of European and Japanese equities, cutting back on European equities to fund roughly equal-sized positions in both markets and focusing the Europe overweight on the Eurozone, both on a currency hedged basis. We also revised our emerging markets equity overweight recommendation to overweight Asia ex Japan equities. We maintain that advice today.
Underweight US Equities
US equities celebrated the sixth anniversary of the bull market started on March 9, 2009, by returning a cumulative 249%, handily trouncing more reasonably priced developed markets equities outside the United States (144%) and emerging markets equities (134%).[1]Returns in local currency unless otherwise noted. More recently, US equities have lagged these markets, with the S&P 500 returning 1.0% in the first quarter, compared to 10.1% (3.8% in US$ terms) for the MSCI World ex US Index and 4.9% for emerging markets (2.3% in US$ terms). In only five quarters since 1970 has the MSCI World ex US Index outperformed the S&P 500 by this magnitude or greater. Performance was particularly strong in the Eurozone in the first quarter (18.7% in local currency, 5.3% in US dollars) as the ECB announced details of its QE program in late January and began purchases of sovereign bonds on March 9. Japanese equities were also strong performers (10.2%) in both local currency and US$ terms. Given such a strong, concentrated rally, we would not be surprised to see some near-term consolidation and recommend trimming positions that have grown, particularly in the Eurozone and Japan, while remaining overweight.
US equities are under pressure on a number of fronts: valuations remain high and earnings expectations have been falling amid weakness in the energy sector and a strong US dollar. Earnings expectations for the S&P 500 have been marked down radically since the start of the year. In fact, estimates for year-over-year first quarter earnings have decreased from 4.0% on December 31 to -4.8% in March. Not surprisingly, energy companies experienced the most severe reductions (-63.5%, down from -29.5% at the start of the year). For the full calendar year, consensus earnings expectations are for 2.2% growth, down from 8.2% only several months ago. Despite the potential for consumer-related sectors to benefit from increased spending flowing through from the substantial decline in gasoline prices (much of which has been saved in the United States thus far), earnings growth expectations for consumer-related sectors have also been downgraded.
Historically, rising wages (which follow increases in employment with a lag) and a strengthening US dollar pressure margins and are negatively correlated with profits (Figure 4). Indeed, according to analysis by FactSet of first quarter 2015 year-over-year earnings expectations, those S&P 500 companies with most (e.g., more than 50%) of their sales coming from inside the United States have more favorable first quarter earnings expectations than those with most of their sales originating from outside the United States, although neither is encouraging—0% growth compared to -11.6%.
With pressure on earnings and still-high valuations, we continue to recommend underweighting US equities.
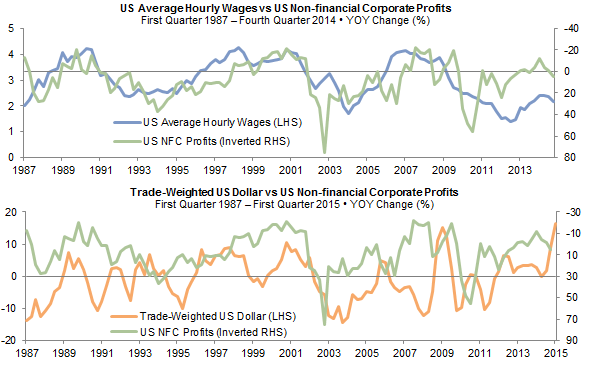
Figure 4. Correlations of US Profits with Wages and the Dollar
Sources: Bureau of Economic Analysis, Bureau of Labor Statistics, and Thomson Reuters Datastream.
Note: Non-financial corporate profits are as of December 31, 2014.
Overweight Eurozone and Japan Equities
Eurozone and Japanese equities offer more attractive valuations than US equities and have more upside potential in earnings, as they are starting from a lower base (Figures 5 and 6). Consensus earnings expectations for the Eurozone exceed those for US equities (Figure 7). After four years of depression, the Eurozone economy is starting to show some signs of life, as private sector lending has been improving from deterioration to almost flat on a year-over-year basis and bank credit standards easing. Consumer confidence and retail sales growth are at their highest levels since 2007, and forward economic indicators are turning up. The fall in oil prices is already providing a boost to consumption in the Eurozone, perhaps reflecting high pent-up demand for spending among Eurozone consumers suffering from depressed economic conditions, high unemployment, and falling real wages, particularly in the periphery.

Figure 5. Excess Discounts vs World ex Japan and US Equities
As of March 31, 2015 • Percent (%)
Sources: MSCI Inc. and Thomson Reuters Datastream. MSCI data provided “as is” without any express or implied warranties.
Note: Excess discount refers to the current discount minus the implied “fair value” discount for each region.
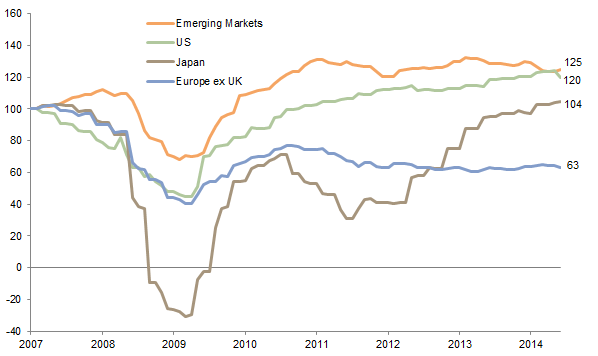
Figure 6. MSCI EPS
October 31, 2007 – March 31, 2015 • October 31, 2007 = 100 (Local Currency)
Sources: MSCI Inc. and Thomson Reuters Datastream. MSCI data provided “as is” without any express or implied warranties.

Figure 7. Earnings Growth Expectations
As of March 31, 2015
Sources: Bloomberg L.P. and J.P. Morgan Securities, Inc.
Notes: Japan EPS growth/estimates are for its fiscal years ending March 31. For example, the 2015 estimate is for the period April 1, 2015, to March 31, 2016.
Whether the boost from lower oil prices and QE will promote a broader, more durable virtuous cycle—in which corporations increase capital expenditures, production, and hiring—remains to be seen, but for now these factors are supportive of Eurozone equities. Further, Eurozone countries are increasingly engaging in structural reforms—in particular, important labor reforms. Not surprisingly, France has done virtually nothing yet, but Spain began this process a few years ago and is beginning to see improvements in productivity and competitiveness. Italy has also begun to enact reforms in earnest. At the same time, the political risk related to the rise of extremist political parties in Europe is casting a shadow over the Continent, with a possible exit by the Syriza-led Greek government the most pressing concern. Cyclical improvement in the economy has the potential to stem the tide, but given how high unemployment rates remain, many years of slow to moderate growth will be needed to bring unemployment back to more normative levels.
For a more detailed discussion on our views on Japanese equities, please see Wade O’Brien et al., “Japan: Micro More Compelling Than Macro,” Cambridge Associates Research Note, February 2015.
Our justification for a Japanese equity overweight is rooted in the broad-based earnings recovery underway, evolution of structural reforms, and reasonable valuations. By the end of November 2014, MSCI Japan earnings had increased 230% from the April 2012 bottom, finally regaining levels that prevailed in late 2007/early 2008. Market prices have risen, but roughly in line with earnings, leaving valuations reasonable and relatively attractive. Consensus earnings expectations for Japan are higher than those of US equities.
Drivers of these expectations are yen weakness and a renewed focus by corporations on return on equity and shareholder value. In addition, the outlook for the consumer sector may be poised to improve after a difficult year amid an increase in the VAT tax and inflation imported from the weaker yen. Lower energy prices should help the sector, as should the nascent increase in real wages, should it be sustained. Corporations are under considerable political pressure to pass on some profit gains to employees. Some corporations are also under pressure from shareholders to increase dividends and share buybacks. With an estimated $3 trillion in cash on corporate balance sheets according to the Ministry of Finance, there is plenty of capacity to do so.
While exports have been slow to respond to a weak yen, the 35% depreciation in the yen versus the US dollar since the start of 2012 appears to have finally had some influence, as export volume has risen more than 10% in less than six months. Given the sharp depreciation of the yen to arguably undervalued levels relative to the US dollar, the yen has stabilized this year and could certainly reverse from here. This is not necessarily a negative for Japanese equities as it depends to a large extent on how the yen fares relative to the currencies of other trading partners; two-thirds of Japanese equity foreign sales are outside of North America. Moreover, although the relationship between the direction of the yen and profits has been negative in recent years, this has not always been the case. The yen strengthened along with corporate profits immediately after the GFC and in the 2004–06 Japanese equity rally.
The coordination of QE with asset allocation changes by GPIF, the main government pension fund, has also been influential in supporting domestic equity markets and pushing down the yen as the GPIF has increased its domestic and foreign allocations to equities, reducing bond allocations. Further support to equities is expected as other large local investors follow GPIF’s lead. Foreign investors remain notably underweight Japanese equities, with significant potential to rush into Japan as they have in the past,[2]Goldman Sachs surveyed 23 large global ex US equity funds with assets of $355 billion and found 35% of the funds are 5 to 10 percentage points underweight Japan. Foreign capital supported the … Continue reading particularly as the yen has stabilized recently, providing strong US$ returns to unhedged US investors.
Our near-term enthusiasm for Japanese equities remains checked by the considerable macroeconomic risks facing the economy given shrinking demographics and a large debt burden relative to GDP. As such, we have recommended that investors hold only small overweights and hedge currency exposure.
Tilt Emerging Markets Toward Asia
At the start of the year, we shifted our recommendation to overweight emerging markets relative to US equities to focus on Asian emerging markets or Asia ex Japan. This view is based on the divergent conditions in emerging markets, particularly as commodity prices have fallen sharply, at the same time as the US dollar has appreciated significantly and the Fed is seeking to begin raising policy rates later this year. Our view has been reinforced by PBOC’s recent shift to monetary easing, which has contributed to the outperformance of Chinese equities, particularly China A-shares, relative to emerging markets as a whole.
Among emerging markets, net commodity importers are largely Asian and better positioned to benefit from lower commodity prices, while net commodity exporters are more concentrated in Europe, Latin America, South Africa, and the Middle East. Asian economies also tend to have limited fiscal deficits, current account surpluses, and relatively high reserves. As a result, Asian currencies have held up well despite the weakness in emerging markets currencies. The resilience of Asian currencies is also aided by the fact that the Chinese equities included in the MSCI Emerging Markets Index are the Hong Kong–listed shares priced in Hong Kong dollars, which are pegged to the US dollar. While an Asia tilt increases direct China exposure, it also increases exposure to “domestic demand”–driven markets such as India and Southeast Asia. Importantly, even as Indian and ASEAN equities[3]The Association of Southeast Asian Nations includes Brunei, Cambodia, Indonesia, Laos, Malaysia, Myanmar, the Philippines, Singapore, Thailand, and Vietnam. The equity markets of these countries are … Continue reading are somewhat expensive, broader Asia ex Japan and emerging Asia are just as cheap relative to their history as emerging markets equities broadly, given the cheapness of Chinese and other “north Asian” markets.
At the same time, as discussed in more depth below, the sharp rally in the US dollar and the potential for higher rates puts pressure on US$ borrowers without sufficient US$ income to service debts. This is most prevalent in emerging economies that are reliant on external, largely US$-denominated financing. Today, the biggest risks appear to center on Brazil and Russia. Chile, Indonesia, South Africa, and Turkey are also at risk due to a high share of external debt in US dollars and relatively low exports and FX reserves in relation to such debt. Significant US$ revenues in all these countries save Turkey has improved financial circumstances, but the concentration of this revenue in commodities has been a detriment.
In light of the uncertainty around the magnitude and duration of continued commodity price weakness and related currency risk, tilting emerging markets portfolios toward Asia by adding some Asia ex Japan exposure in place of global emerging markets (GEM) equities or using a GEM manager biased toward Asia may prove more defensive.
US Dollar Soared—Now What?
We continue to believe US$-based investors should hedge a portion of non-US$ currency exposure. In particular, we recommend hedging developed markets currency exposure associated with tactical positions in order to maintain neutral US$ positioning at the total portfolio level.[4]We expect the US dollar to continue to appreciate against some emerging markets currencies as well. However, the cost of hedging emerging markets currencies and the negative interest rate carry make … Continue reading Similarly, non-US$ investors should seek to maintain neutral US$ positioning even if underweight expensive US equities. Strategic hedging to mitigate currency volatility may also be appropriate for investors with large allocations (e.g., 20%–25% or higher) to foreign currencies.[5]Typically, investors with such programs hedge roughly 50% of foreign currency exposure. Given currency moves can be significant, maintaining such a program requires use of currency hedged benchmarks … Continue reading We maintain this recommendation even as we regard the US dollar as overvalued relative to a basket of other major developed markets currencies and exposed to potential near-term consolidation.
Please see Aaron Costello and Jason Widjaja, “What’s Next for the US Dollar?,” Cambridge Associates Chart Book, March 2015, for more discussion on US$ dynamics in a historical context.
The pace of US$ appreciation has been strong, with the US dollar rallying 33% from its low in mid-2011 through March 2015, and 10% over the last six months versus a basket of developed markets currencies.[6]Unless otherwise noted, US dollar movements are based on an equal-weighted basket of six currencies: the Australian dollar, British pound, Canadian dollar, euro, Japanese yen, and Swiss franc. The magnitude and steepness of the US dollar’s ascent suggests that some consolidation may be in order. Further, the US dollar is overbought, with net long non-commercial positioning at levels last seen in the late 1990s US$ bull market cycle.
Given these conditions, why do we continue to recommend US$-based investors hedge some non-US$ exposure? There are four reasons: (1) relative growth and monetary policy conditions remain US$ supportive; (2) the US dollar tends to rise in periods of market stress, worsening returns on non-US$ exposures; (3) history suggests this cycle may have more to run; and (4) hedging improves the risk/return profile of global equity investments. Today, the cost of hedging for US$-based investors may be offset to some degree by the positive carry available for the US dollar relative to many developed markets currencies.
US economic growth, despite some recent weakness, appears strong relative to other developed markets. Additionally, expectations that the Fed will begin to raise rates later in the year are positive for the US dollar at a time when the BOJ and ECB remain committed to weakening their currencies and many central banks are easing policy. According to the Bank for International Settlements, over 20 central banks have eased monetary policy since December 2014. By the end of February, $2.4 trillion in long-term global sovereign debt had negative nominal yields, with nearly 80% of that euro denominated. A gusher of capital flowed into US bonds over the four weeks following the ECB announcement in late January that it would expand asset purchases—$40 billion, or three times the average four-week inflow in 2014.
Of course, there is a risk that economic growth will not strengthen to the degree the Fed is expecting, particularly as a strong dollar itself is a drag on economic growth. As much as the Fed wants to begin increasing policy rates to gradually normalize monetary policy, it does not want to tighten prematurely. Thus, the US dollar is vulnerable in the near term should US growth and/or Fed rate hikes fail to meet expectations. Indeed, the US dollar fell sharply in mid-March as the Fed lowered its guidance on expected rate hikes. However, if the economic disappointment is severe and results in a broader risk-off environment, the US dollar may counter-intuitively rally, as it tends to do amid periods when global risk aversion rises sharply. This presents a dilemma for US$-based investors that may want to increase exposure to relatively undervalued non-US equity markets. By reducing US equity allocations investors may be reducing valuation risk but at the same time increasing currency risk, which could accentuate underperformance in a down market for risky assets. For these reasons, we continue to advocate hedging any tactical overweights of non-US$ exposures. Non-US$ investors might decrease US$ hedge ratios or overweight other US$ assets that offer relative value (e.g., US TIPS instead of global inflation-linked bonds) to bring US$ exposure back to at least neutral positioning.
It is unclear how much longer or to what magnitude the US dollar will appreciate. History provides some anecdotes. There have been two up-cycles in the US dollar since 1970; the dollar appreciated 78% from 1978 to 1985 and 49% from 1995 to 2002. The current cycle appears to be 40%–70% complete in terms of magnitude and roughly halfway complete in terms of duration using these two cycles as a guide. In terms of valuation, the US dollar in real (inflation-adjusted) terms is roughly 15% above its long-term median, which we considered overvalued. In previous cycles, valuations peaked at 35%– 45%.
The US dollar’s role in global finance has contributed to these extended cycles. While many investors are long the US dollar today, much of the global economy is short, with over $9 trillion in non-bank US$-denominated foreign borrowing outstanding. When the US dollar rallies sharply it puts pressure on foreign US$ borrowers, who rush to pay down dollar debts or seek additional US$ liquidity/savings. The result is a self-reinforcing cycle that further elevates the dollar. This is most prevalent in emerging economies that are reliant on external, largely US$-denominated financing. We do not expect a repeat of the emerging markets crises of the early 1980s or late 1990s given improved fundamentals across many emerging economies.[7]For example, foreign exchange reserves are higher, current account deficits lower, debts are more dispersed across borrowers; currencies more flexible with fewer pegs; debt maturities are longer; … Continue reading Nonetheless, in both of those instances, a rising US dollar and rising US rates triggered stress in emerging economies that ultimately resulted in increased flows back into the United States, which drove the US dollar higher. Something similar may very well already be occurring.
A case can also be made for more strategic currency hedging to improve the risk/return profile of global equity investments. Currency exposure can introduce a meaningful amount of volatility to portfolios relative to base currencies. For example, the annualized return for the MSCI World ex US Index happens to be identical: 5.7% in both local currency and US$ terms for the period January 1, 1988, to February 28, 2015. However, the annualized standard deviation of returns for the US$ index is 17.1%, compared to only 14.7% for the local currency index.
As recent market action suggests, currency volatility has increased, with implied volatility now at average levels over the last 15 years (Figure 8). Volatility may remain elevated in a low interest rate environment, given that central banks—having pushed to and through the so-called zero bound on policy rates—are increasingly using currencies as a key policy lever. Bridgewater Associates put it succinctly:
With central banks keeping the major reserve currency rates near zero for the foreseeable future, interest rates cannot discount future exchange rate changes, so spot currency moves are the only way to resolve such imbalances. In other words, in this environment, differences in external conditions and monetary policies will need to be resolved through larger shifts in exchange rates.

Figure 8. Implied Volatility (%)
January 1, 2000 – March 31, 2015
Source: Bloomberg L.P.
Note: Data are daily.
The US dollar has had a strong run and is now overvalued and vulnerable (Figures 9 and 10). Even as a period of consolidation may be in order, the dollar probably has more upside, especially if the United States continues to tighten monetary policy while much of the rest of the world eases, resulting in an environment that may see relatively high currency volatility. We see no reason to underweight the US dollar, although we do see cause to underweight US equities. Currency hedging tactical equity positions allows US$-based investors to maintain neutral currency exposures. Similarly, non-US$ investors should reduce hedge ratios or invest in more attractively priced US$ assets. Further, some strategic currency hedging can reduce portfolio volatility, increasing risk-adjusted returns, and may prove somewhat defensive in a broader risk-off environment. With US interest rates relatively high compared to other developed markets, the cost of hedging for US$-based investors is lessened today.

Figure 9. Valuation Versus the US Dollar: Developed Markets Currencies
As of March 31, 2015
Sources: Goldman, Sachs & Co., J.P. Morgan Securities, Inc., MSCI Inc., and Thomson Reuters Datastream. MSCI data provided “as is” without any express or implied warranties.
Notes: The USD equal-weighted basket is an equal-weighted basket of six currencies: the Australian dollar, British pound, Canadian dollar, euro, Japanese yen, and Swiss franc. Real exchange rate takes into account each country’s nominal exchange rate versus the US dollar and its inflation relative to the United States. The historical median is calculated from July 1971 onward.

Figure 10. USD Real Equal-Weighted Index
December 31, 1969 – March 31, 2015 • Percent from Median (%)
Source: Thomson Reuters Datastream.
Notes: Median is calculated on the post-1971 data. The USD Equal-Weighted Index is an equal-weighted basket of six currencies: the Australian dollar, British pound, Canadian dollar, euro, Japanese yen, and Swiss franc.
Energy Opportunities
As we wrote last quarter, the dispersion of views on where oil prices will settle and when the market will recover is wide. Will the shape of the recovery be a v, u, w, square root, or margarita glass (yes, you read that correctly)? The descriptions are limited only by analysts’ creativity. While it is difficult, if not impossible, to predict the timing of a recovery, many market participants expect oil supply from US shale will begin to adjust this year and prices next year. Energy majors have slashed capital expenditures by about 20% in 2015, while the number of horizontal rigs in operation has fallen by more than one-third relative to its November peak. That said, there is some evidence that new investments are focused on the most productive areas. Although supply continues to increase, it tends to lag production declines.
Several features of the current environment complicate the picture relative to historical periods of supply/demand imbalances:
- High borrowing levels at many public energy sector firms may encourage continued production at uneconomic levels as companies are forced to keep up production to meet short-term debt obligations.
- As storage capacity becomes scarcer, shale producers are increasingly drilling, but not completing wells, effectively providing in-ground storage. RBC Capital Markets estimated there were 3,000 such wells in North Dakota and Texas as of mid-February.
- Stressed E&P companies may be handed a lifeline by newly launched credit funds flush with cash. By our estimates, $10.4 billion in private energy credit is being raised in 2015.
Add to this Saudi Arabia’s deep pockets and apparent resolve to maintain production—even at prices that require the country to heavily subsidize its budget by drawing down reserves—and it is clear that prices could stay low for some time, edging up and encouraging new production that subsequently pushes prices back down.
If oil prices remain depressed for an extended period, distressed opportunities will emerge. As we scour the opportunity set of energy managers currently in the market and consider the uncertainty around the timing of a recovery, we believe that committing capital to private equity energy managers with the ability and skill to acquire upstream assets from distressed owners and distressed oilfield services businesses from unnatural owners offers the best approach to energy today. We continue to review the market and manager landscape to evaluate new opportunities.
For further discussion on the outlook for publicly traded natural resources equities and energy-related MLPs please see Sean McLaughlin et al., “Feeling Energetic About Natural Resource Shares Amid an Oil Rout,” Cambridge Associates Research Note, January 2015.
More liquid investments in energy would likely perform better in a relatively quick recovery. Within this segment we would focus on natural resources equities, as they are undervalued and should provide reasonable long-term returns. Commodity futures strategies, in contrast, may now offer reasonably valued spot prices, but continue to suffer from the drag of contango and virtually no return on collateral. master limited partnerships (MLPs) are fairly valued and offer a distribution yield of 6.2% (based on the Alerian MLP Index). As supply and demand remain out of balance, volatility may continue to increase in this market. However, high-single-digit returns reflecting a more moderate 3% to 5% annual yield growth appear plausible, as regulated pipeline tariffs grow annually by 2.65% plus the producer price index.
Conclusion
As the United States and United Kingdom look through mixed economic data to the finish line, they have passed the baton to the Eurozone and Japan in the race to reflation. Historical precedent suggests that risky assets in these economies will benefit for the duration of their run. With policy rates at zero or negative, the main lever of QE today is currency weakness and the main beneficiary is the US dollar. Investors, having learned the lessons of the post–financial crisis era, have followed the QE, pushing Eurozone and Japanese equities up sharply, while the euro and yen have dropped to levels supportive of export growth for now.
These conditions support our recommendation to underweight US equities and overweight Eurozone and Japanese equities on a currency hedged basis, as well as Asia ex Japan/emerging Asian equities. These markets also offer value relative to US equities, which trade near very overvalued levels on high earnings that are coming under pressure. Even as the US dollar has moved into overvalued territory and is vulnerable to a near-term correction or consolidation, we recommend maintaining at least neutral US$ exposures and considering strategic currency hedges, particularly as currency volatility may remain elevated.
Current dynamics in the oil market suggest that prices could stay low for some time. If this transpires, distressed opportunities will emerge. Investors should be patient in committing capital to energy opportunities today, focusing on private equity energy managers with the ability and skill to acquire upstream assets from distressed owners and distressed oilfield services businesses from unnatural owners. We continue to review the market and manager landscape to evaluate new opportunities.
Please see Eric Winig et al., “Corporate Bonds: The Next Liquidity Crisis?,” Cambridge Associates Research Brief, September 17, 2014. For more information on negative yields, see Stephen Saint-Leger, “What Are the Implications of Negative Interest Rates and Why Are Investors Accepting Them?,” C|A Answers, March 24, 2015.
Overall, we remain neutral on risky assets in general, but are becoming more cautious and selective as the market cycle advances and the Fed looks to begin raising rates. Volatility has been rising in some corners of the market as investors adjust to diverging policy conditions and falling commodity prices. We continue to be concerned about limited liquidity conditions in the bond markets, as we have discussed in recent publications. Competitive currency devaluations and the growing pervasiveness of negative yields add another degree of uncertainty and volatility. Diversification and safety are becoming increasingly important.
Since the middle of last year, we have been recommending that investors shift more capital into safer assets—more fundamentally driven hedge funds and Treasuries—as equity markets become more expensive. We expect volatility in rates to provide better entry (or re-entry) points for increasing Treasury exposure for those that have taken our advice and held some cash as a substitute for a portion of the Treasury portfolio. The low end of our fair value range for Treasuries is 2.8%. Should yields approach that level, we would reverse this position.
Footnotes