Heading into 2016, we remain constructive on Japanese equities versus US equivalents and are broadening our recommendation to include Japanese small- and mid-cap stocks
- The Japanese equity rally of recent years has been driven mainly by earnings growth as opposed to valuations creeping higher, differentiating it from that in many other markets; valuations remain attractive for large-cap stocks.
- Conventional wisdom is that Abenomics is failing as growth and inflation have disappointed; investors should instead direct their attention to the renewed company focus on higher profitability and greater shareholder returns.
- Japanese small caps offer valuations that are attractive on an absolute basis and especially so relative to international peers; they also are starting to see benefits from Abenomics as company managers focus more on boosting profitability and shareholder returns.
Investors in Japanese equities have enjoyed healthy returns in 2015, though it has been a roller coaster of a ride. After a very strong first half, Japanese stocks were caught up in the global equity sell-off over August and September given concerns about a China hard landing and tighter US monetary policy, but regained their stride in October as fundamentals reasserted themselves. Domestic macro data have been mixed, with the economy managing to return to growth in the third quarter, but inflationary pressures still muted. The micro has been more encouraging—earnings growth has been robust as companies continue to focus on shareholder returns, and the weaker yen has generated a tailwind. In light of reasonable valuations and earnings that should at least keep pace with global peers, we continue to recommend a small overweight to Japanese stocks versus US equivalents. As tailwinds like currency depreciation look set to fade and the forces of Abenomics begin to impact a broader swath of businesses, we also suggest that investors broaden their horizons and consider investing in local small- and mid-cap stocks.
Robust Recent Returns Only Modestly Impact Valuations
Japanese equities returned 9.9% in 2015, outperforming developed markets peers by a whopping 780 bps in local currency terms. Over the past three years, Japanese stocks boast an even more impressive track record, outperforming developed markets peers to the tune of around 1,000 bps per annum on a local currency basis. However, these statistics require two important caveats. First, longer-term returns have been less than stellar—the annualized return for Japanese stocks over the past decade was just 1.1%. Second, even using three-year numbers, significant yen depreciation has meant that investors based in US dollars would have been better off underweighting Japan relative to domestic peers, though unhedged euro investors would have fared well.
The Japanese equity resurgence in recent years has been driven mostly by earnings growth as opposed to changes in valuations. Since the end of 2010, Japanese stocks have returned around 13% per annum, only slightly above the 11% annual growth in earnings, with dividends providing an additional return. In contrast, while US equities posted only slightly lower (12%) annual returns, companies generated far weaker profit growth (Figure 1).
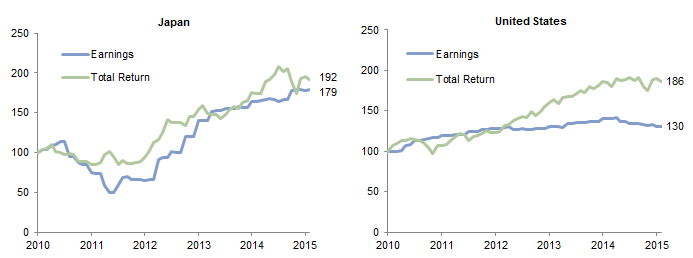
Figure 1. Cumulative EPS Growth and Total Return
November 30, 2010 – December 31, 2015 • November 30, 2010 = 100
Source: MSCI Inc. MSCI data provided “as is” without any express or implied warranties.
Notes: All data are in local currency terms. Total returns for MSCI developed markets indexes are net of dividend taxes.
Comparing any Japanese equity valuation metric to its long-term average can be challenging given the elevated valuations that persisted in the 1980s and 1990s as well as extremely volatile index profits. For more on this, please see Wade O’Brien et al., “Japan: Micro More Compelling Than Macro,” Cambridge Associates Research Note, February 2015.
The takeaway is that valuations have changed little for Japanese companies during this period, unlike those in some other developed markets. The trailing price-earnings (P/E) ratio of 16.0 is slightly lower than its level five years ago and well below its long-term median; the price-to-book (P/B) ratio has slightly increased (from 1.2 to 1.4) but this is justified in part by the much higher return on equity (ROE) generated by these companies. Even with their slight re-rating, P/B ratios remain well below historical averages, and discounts are on offer across a variety of sectors (Figure 2), differentiating the broad Japanese opportunity set from that in other developed markets. Normalized metrics, like the ROE-adjusted P/E, also look in line with historical medians.
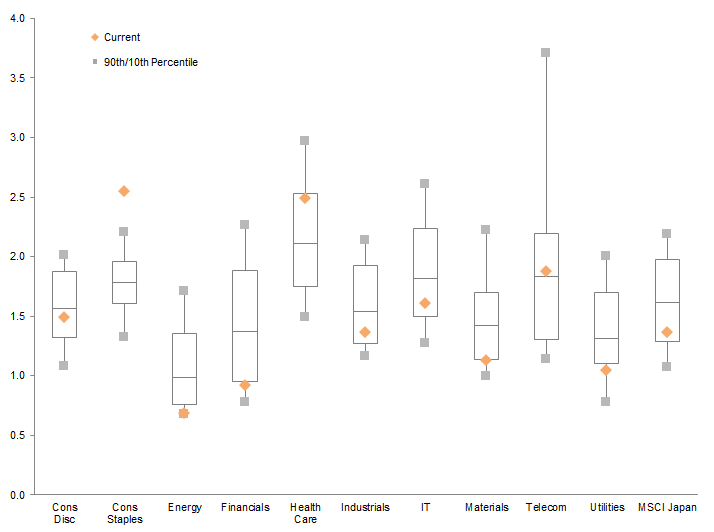
Figure 2. Japan Sector Price-to-Book Valuations
December 31, 1995 – December 31, 2015
Source: MSCI Inc. MSCI data provided “as is” without any express or implied warranties.
Note: Telecom data begin June 30, 1997.
Are Recent Returns Repeatable?
Some investors treat the steady increase in profitability of Japanese companies with skepticism, recalling Japan’s lost decades and questioning whether the more recent positive trends can continue. Skeptics believe the weak domestic economy will curb consumption and thus revenue growth, and are also scrutinizing the fate of Japanese exports under a China hard-landing scenario. These concerns are valid, but we see offsetting factors.
The Japanese economic recovery has indeed proceeded at a slow pace in 2015, with the latest data showing a mild third quarter expansion after a contraction the prior three months. Growth has received a boost from rising business investment, as well improving consumer spending as the job market tightens and workers see minor wage gains. Still, the recent rise in GDP should be viewed in the context of two decades of weak nominal growth; since 1995, the economy has basically been stagnant in nominal terms. Contrary to popular perceptions, beneath the surface Abenomics has encouraged a number of changes that portend stronger future growth. Companies are investing more for the future, and merger & acquisition activity is on the upswing. A record 66% of eligible women have entered the workforce, prompted in part by more readily available childcare, helping to offset some of the concerns about demographics and a shrinking workforce.[1]Organisation for Economic Co-operation and Development, “Labour Force Statistics by Sex and Age – Indicators” dataset, Accessed January 8, 2016, … Continue reading Finally, the Trans-Pacific Partnership, once enacted, is expected to lower trade barriers, and inbound tourism has more than doubled (in part due to the weak yen) over the last two years and could reach 20 million visitors this year.
Japanese companies need inflation to be able to raise prices and discourage consumers from deferring purchases, and some critics have called Prime Minister Shinzō Abe’s efforts on this front a failure. Despite record amounts of bond buying by the Bank of Japan (BOJ), headline consumer price inflation is nonexistent. Still, a closer look indicates inflationary pressures are building beneath the surface. One reason is tightness in the labor market; the unemployment rate has fallen to around 3.5%, and recent quarterly data suggest nominal compensation growth is approaching 2%, close to two-decade highs.[2]Daiwa SB Investments Ltd., “Outlook for Japanese Stock Markets: From Long Stagnation to Sustainable Rally,” October 15, 2015. The result is that core inflation (ex food and energy) through October was near 1% on an annualized basis, and even higher if only the most recent data are used.
Japanese firms would of course welcome a stronger domestic recovery, but they have been able to steadily grow profits in the past despite a lackluster domestic backdrop. Firms increased their reliance on foreign markets, which by some estimates account for between 35% and 40% of Japanese corporate revenue. A hard landing in China would be problematic for Japanese firms, but this is not our base case. In fact, recent announcements suggest the Chinese authorities may do more to boost growth early in 2016. Further, while some Japanese industrial firms have benefitted from the manufacturing and real estate boom in China and are vulnerable as the country rebalances its economy, Japanese retailers and consumer goods firms are starting to take over the reins and benefit from the emergence of the Chinese middle class.
What If the Yen Stabilizes?
The direction of the yen is a key question for investors in Japanese equities, as recent weakness has been an important tailwind for many companies. In recent years, companies with high foreign revenue share (>50%) have grown profits around 10 ppts faster on annualized basis than those with lower international exposure. Sales to the United States (around 12% of index total) have been especially helpful, given the yen’s 30% devaluation against the greenback, as have sales to China (around 5% of index revenue),[3]BlackRock Investment Institute, “Cycles Out of Sync: 2016 Investment Outlook,” December 2015. which historically has loosely pegged its currency to the dollar. A swift reversal in the yen would present a headwind to many of these companies.
Looked at differently, more than 80% of index revenue is either generated domestically or from countries whose currencies have not appreciated significantly against the yen (including Eurozone companies), and the yen’s impact on earnings growth may be fading. Goldman Sachs estimates that the sensitivity of Topix profits to changes in the USD/JPY exchange rate has fallen by more than half over the last couple of years, with a Yen 10 move now moving earnings by just 4 ppts.[4]Goldman Sachs Japan Portfolio Strategy, “Chunky Monkey: Stay Bullish in 2016,” December 5, 2015. This argument is reinforced by recent data, which suggest that earnings growth has started to decouple from the direction of the yen (Figure 3). Sectors with virtually no foreign revenue such as telecoms, utilities, and financials have recently generated earnings growth as high (or even higher in some cases) as sectors with large foreign exposure like industrials and autos. Higher operating leverage has helped; margins have expanded as higher sales have allowed fixed costs to be amortized over larger bases. Using the financial sector as an example, the median annual increase in revenues has been just 2.2% over the past three years, but earnings have compounded at 14.0%.
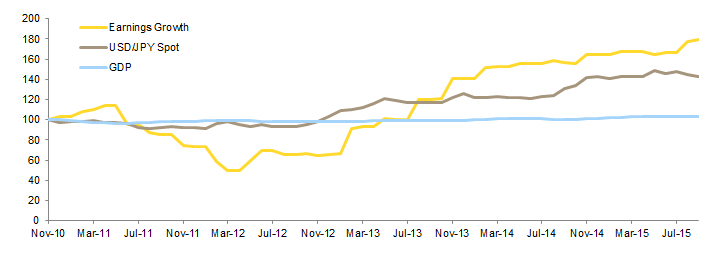
Figure 3. Effects of Japanese Yen Depreciation on EPS Growth
November 30, 2010 – November 30, 2015 • November 30, 2010 = 100 Level
Sources: Government of Japan Cabinet Office, MSCI Inc., and Thomson Reuters Datastream. MSCI data provided “as is” without any express or implied warranties.
Note: Japanese GDP data are as of September 30.
Boosting the profitability of Japanese companies was a primary goal of Abenomics, as the hope was that these companies would share the spoils with workers and help generate stronger growth and inflation. Corporate governance reforms and the related launch of the JPX Nikkei Index 400 have supported this objective by making companies more focused on profitability and shareholder returns. The ROE of Japanese companies overall has doubled from around 4% in early 2010 to around 8.5% today; note that the ROE of domestic-oriented sectors like telecoms and consumer staples is often above those in export-oriented sectors like industrials and consumer discretionary (Figure 4). Investment managers have observed that local Japanese companies are discussing targets for this metric for the first time, and the mindset is slowly shifting from serving the interests of stakeholders like employees to those of shareholders.
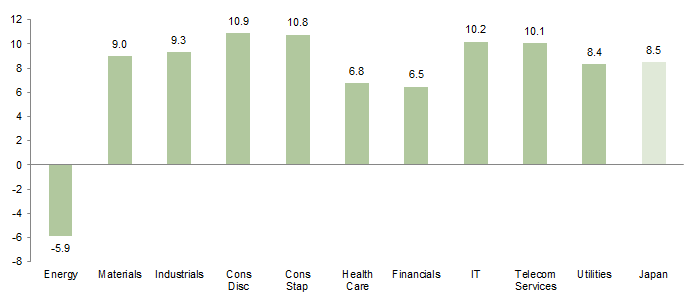
Figure 4. Japan Sector Return on Equity
As of December 31, 2015
Sources: FactSet Research Systems and MSCI Inc. MSCI data provided “as is” without any express or implied warranties.
Companies can afford to be more generous. Aside from weakening the currency, the Abe government has taken other steps such as lowering the corporate tax rate to 33%, boosting corporate profit margins. Japanese companies are also cash rich; by some estimates Topix companies sit on almost ¥300 trillion of cash, the equivalent of 55% of market cap, and have lower payout ratios than European and US equivalents. Governance reforms and a newfound focus on ROE mean payouts to investors are rising; buybacks could reach ¥6 trillion this fiscal year, according to Goldman Sachs,[5]Goldman Sachs Japan Portfolio Strategy, “Chunky Monkey: Stay Bullish in 2016,” December 5, 2015. (about triple 2013 levels) and are expected to rise further in the fiscal year ending March 2017.
Small Stocks, Large Opportunities
Since early 2015 we have recommended that investors overweight Japanese equities and fund this position through an underweight of US equivalents. This has served investors well, whether they were USD-based (and followed our advice to currency hedge) or euro-based and witnessed both equity and currency appreciation. Heading into 2016, we remain constructive on Japanese equities and are broadening our recommendation to include Japanese small- and mid-cap stocks (as well as active managers that pursue an all-cap strategy) given their attractive valuations, greater domestic focus, and potential for further operational improvements.
Valuations for Japanese small caps are lower on an absolute basis than those of large-cap peers, though the current 12% discount on a price-to-book basis is smaller than its historical median (Figure 5). Relative to small caps in other developed equity markets they appear attractively priced, offering discounts either in line with or greater than their historical averages (Figure 6). These valuations seem compelling considering the stronger earnings growth Japanese small caps have posted and their exposure to the slowly healing domestic economy. Sector weights are similar when comparing large and small caps, but the nature of the companies tends to be different. Firms in sectors like retail, IT services, and real estate should be well placed to tap rising consumer spending, employment, and inflation, driving land and rent values higher for the first time in years. Large caps remain attractive, but small caps will also provide some diversification if the yen reverses course (or simply stabilizes), as the majority of their revenue is sourced domestically. Finally, many small companies are earlier along in their adoption of Abenomics-inspired governance measures, implying there is further upside for operating efficiency and higher shareholder payouts.
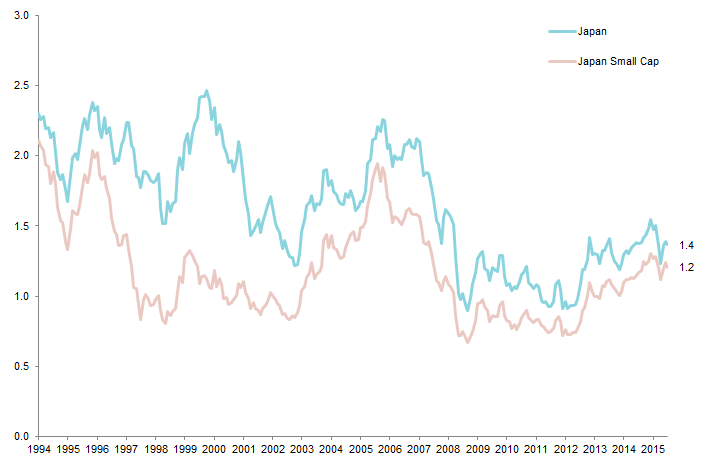
Figure 5. Japanese Markets Price-to-Book Ratios
June 30, 1994 – December 31, 2015
Sources: MSCI Inc. and Thomson Reuters Datastream. MSCI data provided “as is” without any express or implied warranties.
Notes: Japan is the MSCI Japan Index, which represents the large- and mid-capitalization segments of the Japanese market. Japan small caps is the MSCI Japan Small Cap Index.
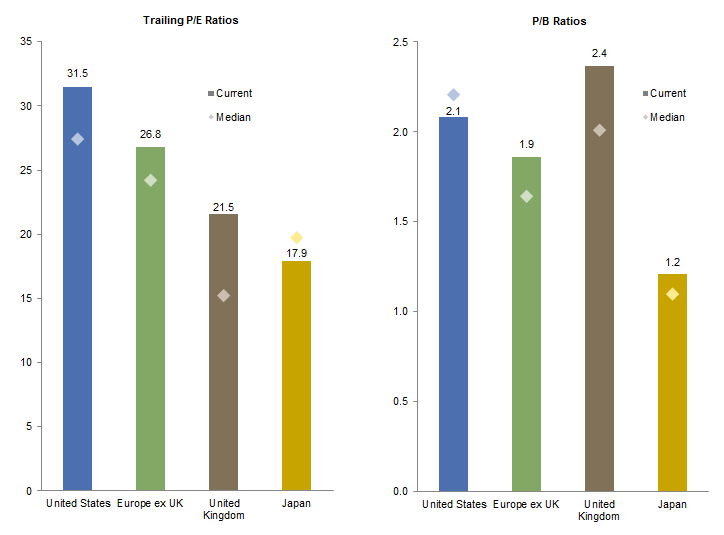
Figure 6. Comparing Small-Cap Equity Valuations
As of December 31, 2015 • Local Currency
Sources: MSCI Inc. and Thomson Reuters Datastream. MSCI data provided “as is” without any express or implied warranties.
Notes: Total returns are net of dividend taxes. Median data calculated from January 31, 2003, to present.
Conclusion
It is not too late for investors to increase allocations to Japanese equities, as the forces that have driven this rally remain in place and equity valuations have not re-rated higher. Despite limited economic growth, companies continue to generate operating efficiencies and are increasingly channeling profits and cash balances back to investors via dividends and buybacks. As smaller companies begin to adopt governance reforms and more shareholder friendly actions, we also encourage investors to consider dedicated exposures to small- and mid-cap Japanese companies (or managers that pursue an all-cap strategy). An additional benefit of these smaller companies is that they should be somewhat isolated from the vagaries of exchange rate movements over the next couple of years. This prompts the question of what non-Japanese investors should do about currency exposures; while the BOJ may ease further, the largest degree of yen depreciation may be in the rearview mirror. Still, we continue to encourage USD-based investors to currency hedge at least overweights to Japanese equities, mainly to reduce portfolio volatility (for which there is little reward) but also as a hedge if an ineffective BOJ or rising inflation causes the yen to sharply sell off.
Wade O’Brien, Managing Director
Joe Comras, Investment Associate
Footnotes