We see scant evidence that richening valuations doom popular alternative beta strategies are likely to underperform, or are the primary source of historical excess returns
- The elevated relative valuations seen within some strategies today are generally not particularly worrisome, since for most alternative beta strategies, initial relative valuations are not closely aligned with subsequent returns. For value-weighted strategies, relative valuations are closely related to subsequent returns, but today these strategies are relatively cheap.
- Some observers have claimed that the historical outperformance of these strategies could be a mirage, with most of the performance attributable to valuation uplift. Our analysis, which mirrors similar analysis done by others in the field, does not find this to be the case.
- Minimum volatility has benefited from overweighting sectors including utilities that benefit as bond yields decline, and money has flown into the strategy. Investors should be prepared for the possibility that alternative beta strategies are crowded today, a claim that is difficult to prove or disprove in real time.
Alternative beta strategies[1]Some investors use the terms “smart beta” or “factor investing” to refer to these strategies.—including minimum volatility, quality, value, and momentum—continue to draw strong investment inflows, although not without controversy. One of the most prominent concerns recently has been that relative valuations for the strategies are elevated, and that the increased valuations (a) boost the chance that the strategies will crash or dramatically underperform, and even (b) account for much of the strategies’ historical outperformance.
In this research note we discuss recent research papers from two experts who disagree about the implications of today’s relative valuations for alternative beta strategies and lay out our view. As a preview, while relative valuations for some of the most popular strategies are indeed elevated, we see scant evidence that richening valuations are an indicator that the strategies are likely to underperform, or are the primary source of historical excess returns. Relative valuations of alternative beta strategies, it turns out, have achieved only mixed success in predicting future excess returns, and relative valuation changes don’t account for an outsized portion of historical excess returns. In our view, the greater risk might be crowding, which has devastated other quantitative strategies before (although they typically rebound quickly), but is difficult to assess in real time.
Serious Questions, from a Serious Source
Longtime readers of Cambridge Associates research may have been introduced to Arnott in our 2006 research report by Eric Winig et al., “Fundamental Indexing.”
In a February 2016 paper and a subsequent one in June,[2]Please see Rob Arnott et al., “How Can ‘Smart Beta’ Go Horribly Wrong?,” Research Affiliates, February 2016, as well as Rob Arnott, Noah Beck, and Vitali Kalesnik, “To Win With ‘Smart … Continue reading Rob Arnott of Research Affiliates, an investment manager that oversees value-weighted “fundamental indexing” products (which reweight stock indexes based on fundamentals rather than market capitalization), outlined the case for concerns about alternative beta strategies. These papers argued that “[increased relative] valuation has been a large driver of smart beta returns over the short and even long term,” noted the extremely high relative valuations for many smart beta strategies (excluding value-weighted strategies) and concluded that “mean reversion could wreak havoc in the world of smart beta.”[3]Arnott’s competitors point out that the conclusion of his research is well aligned with his business interests given his strategies are value weighted and he was predicting that mean reversion … Continue reading
For more on alternative beta, see Deborah Christie and Sean McLaughlin, “Alternative Beta Strategies: A ‘Smarter’ Way to Invest in Equities?,” Cambridge Associates Research Report, 2014.
And indeed, relative valuations—comparing alternative beta indexes to the standard market-cap-weighted index—are elevated for many alternative beta strategies. We pointed this out in our 2014 paper on alternative beta, and relative valuations have continued to richen for some strategies, particularly quality and minimum volatility (Figure 1). The value-weighted strategy, on the other hand, has only been cheaper on a relative basis 16% of the time for the US index and 9% of the time for the developed markets index.[4]In all of our analysis in this paper we use the MSCI alternative beta strategy indexes. Arnott offers his own set of indexes, the RAFI series, and MSCI’s value-weighted methodology uses a similar … Continue reading
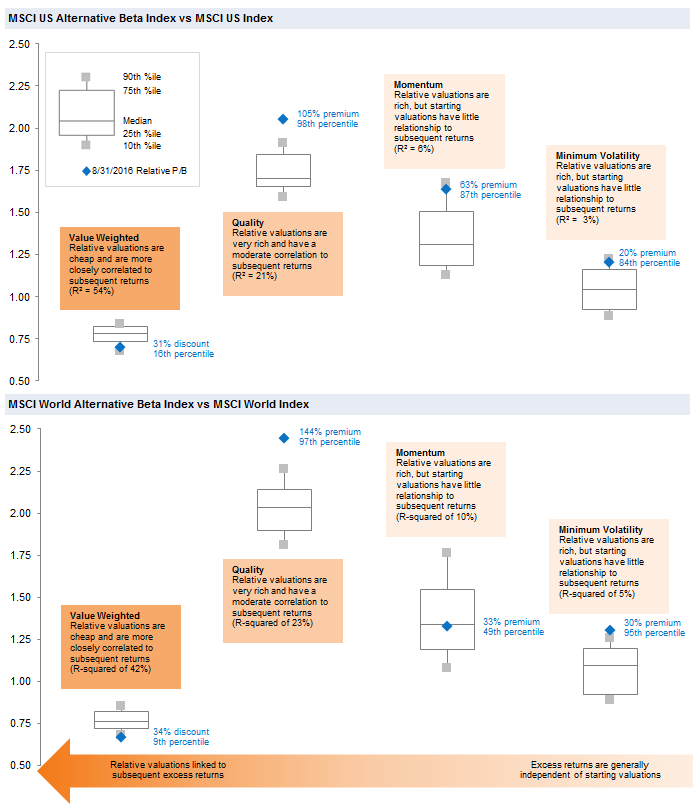
Figure 1. Relative Price-to-Book Valuation
June 30, 1994 – August 31, 2016
Sources: MSCI Inc. and Thomson Reuters Datastream. MSCI data provided “as is” without any express or implied warranties.
Elevated valuations are generally of concern to the value investor, and the relative valuations of some alternative beta indexes are exceptionally elevated relative to history. Is Arnott right? Do elevated relative valuations boost the chances these strategies will crash or dramatically underperform? Have rising relative valuations been a particularly large driver of returns for these strategies? We review the evidence for each claim.
Icarus?
With their somewhat lofty valuations (outside of value), are these strategies straying too close to the sun, destined to fall? It is certainly possible, but not our base case. Figure 2 shows the relationship between initial relative valuation and subsequent three-year excess return for the four alternative beta strategies we’ve focused on, and for both the US and developed markets universes. All four strategies show some link between relative valuation and returns, but that link is weak for all but the value-weighted strategy.[5]While the R-squared shown in Figure 2 is for the full period from 1994 to 2016, correlations vary over time and were higher for some portions of this two-decade period.
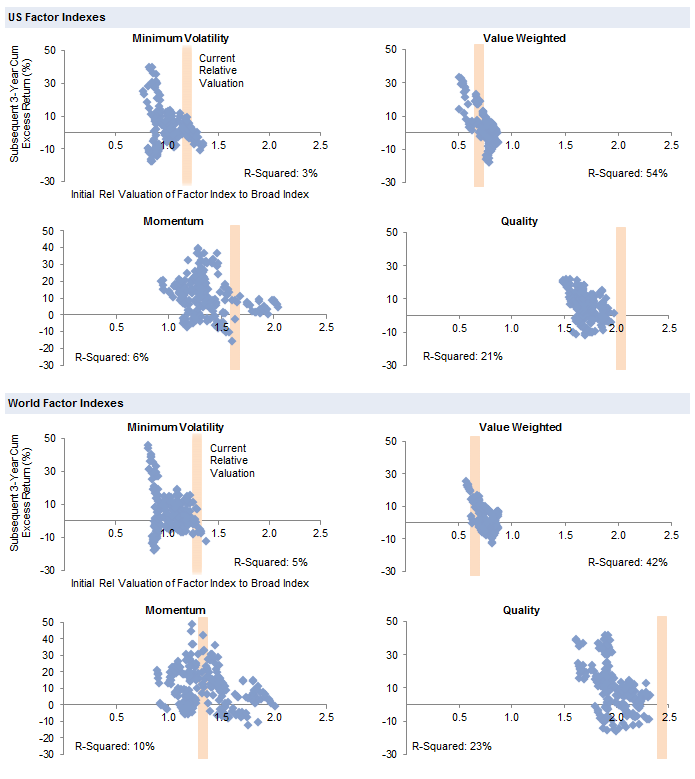
Figure 2. Subsequent Excess Returns vs Initial Relative Valuation of Factor Indexes
June 30, 1994 – August 31, 2016
Sources: MSCI Inc. and Thomson Reuters Datastream. MSCI data provided “as is” without any express or implied warranties.
Note: Data are monthly.
Why don’t starting relative valuations drive subsequent excess returns for these strategies? The primary factor driving a wedge between valuations and returns is the changing composition of each strategy over time. Thus, the relative valuation can change, without investors benefiting or suffering from that change. The higher the turnover of the strategy, the less meaningful initial valuation will likely be.
For example, the MSCI World Momentum Index is currently valued at a 33% premium to the broad MSCI World Index. Just a month ago, the momentum index’s valuation premium was 94%. Even though momentum’s price-to-book (P/B) ratio collapsed by 31% during the month of August, the index’s return was a much more muted -2.8%. Clearly, the momentum index’s changing composition (both at the sector level and stock level) largely drove the relative valuation change, made possible by the 184% annual turnover of this index. Sharp swings in relative valuations are the norm for MSCI World Momentum, driven by changes in composition. The relative price levels of the two strategies are much steadier (because the momentum index’s relative valuation is driven more by its periodic changes in composition) (Figure 3).
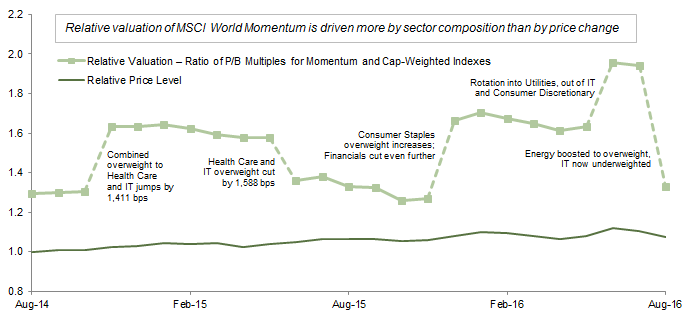
Figure 3. Relative Valuation and Price Level of MSCI World Momentum vs MSCI World
August 31, 2014 – August 31, 2016
Source: MSCI Inc. MSCI data provided “as is” without any express or implied warranties.
Notes: Data are monthly. Price levels rebased to 1.0 on August 31, 2014.
While today’s relative valuation is now moderate for MSCI World Momentum, should investors use momentum’s relative valuation as a signal to steer clear or pile in? The past may be instructive: imagine the potential investor evaluating the MSCI World Momentum index at the end of 2010. The index was then trading at an 85% valuation premium to the broader MSCI World, which would have placed it in the highest decile of relative valuations to that point from the start of the momentum index in 1994. The investor might decide to pass on an investment in momentum at that point, given its extreme relative valuations. And indeed, over the next 32 months, the valuation premium collapsed to the bottom decile . . . yet the momentum index outperformed the broad index by 10 percentage points (ppts) over that period!
Even if investors had a clairvoyant view of the future path of relative valuations, this foresight would not translate to assured investment success. For the MSCI World Momentum Index, for example, the median cumulative excess return during successive three-year periods when the relative valuation fell was still more than 12%, rather than the negative number that one would expect if the relationship of valuations to subsequent returns were tighter. The correlation between the relative valuation change and the excess return (not shown) is only 37% (an R-squared of 10%); this is not betting with loaded dice.
As momentum was in July, today quality is richly valued on a relative basis. Like momentum, though, the relationship between initial relative valuations and subsequent three-year excess returns is not particularly tight (an R-squared of 23% in the case of quality—a -48% correlation, with 27% annual turnover driving the wedge between valuations and returns). Thus the high starting valuations are not all that worrisome. Consider high valuations a headwind, but not an extreme one.
Minimum volatility has elevated relative valuations as well, but with little linkage historically to subsequent returns (an R-squared of just 5%), despite moderate turnover of only 21% annually.[6]In addition to turnover, there are other factors that can loosen the link between starting valuations and subsequent returns. For example, the strategy index and the broad index can have book values … Continue reading Minimum volatility’s rich starting valuations may or may not have a noticeable impact on future returns from here. However, the strategy has a few other headwinds worth keeping in mind; these headwinds (which we will briefly discuss later) don’t necessarily take the strategy off the menu, but investors need to understand that the strategy is at a higher risk of disappointing than other such strategies. Further, the strategy has historically outperformed broad US equities in many historical periods (in backtests); going forward our expectation would be for risk-adjusted outperformance, rather than raw outperformance before adjusting for volatility.
Value, on the other hand, is cheap relative to its base index. The MSCI World Value Weighted Index is currently priced at a 34% discount to the broad MSCI World Index, on a price-to-book basis. Over the past 22 years, the discount has been wider only 9% of the time. Could it get wider than today’s level, or even wider than the historical maximum, and remain there? Certainly. However, a somewhat more likely outcome is that the discount eventually narrows, and if this happens, there is a reasonable likelihood that the strategy will outperform the broad index. Turnover for this strategy is a modest 16% annually, which tends to boost the link between valuations and excess returns (because stocks that start out relatively cheap stay in the index long enough to revert toward more typical relative valuations).
True Outperformance, or Just an Artifact of Richening Valuations?
Turning to the second concern about alternative beta strategies, to what degree are the historical returns the result of rising relative valuations, rather than a durable return driver that will repeat in other environments? Another manager of these strategies, Cliff Asness of AQR Capital Management, has looked at this question, and his analysis found that rising valuations have not been a dominant factor.[7]Please see Clifford Asness, “My Factor Philippic,” AQR Capital Management, June 22, 2016. Asness evaluated the slope of outperformance to the change in valuation for strategies similar to those we have been writing about: profitability, similar to quality; momentum; “betting against beta,” a strategy with some shared characteristics to minimum volatility[8]Unlike low-beta portfolios, minimum volatility portfolios may include some stocks that are highly volatile if they lower the overall portfolio’s volatility (because they have a low correlation to … Continue reading; and value. For quality (proxied by profitability), Asness found that the slope of quality’s outperformance to its valuation change is 0.64. Given that relative valuations for the MSCI World Quality Index have risen by about 1.8% annually over the past 22 years; this might imply very roughly that valuation uplift has accounted for about one-third of the historical outperformance of quality.[9]Rather than MSCI’s quality index, Asness evaluates a separate, but likely closely related “profitability” strategy. Other strategies as tested by Arnott or Asness may differ somewhat from the … Continue reading For momentum and “betting against beta,” the slopes of returns versus valuation changes since 1968 are a tiny 0.13 according to the paper, with low R-squared statistics of 25% and 16%, respectively.[10]One way that minimum volatility strategies differ with the “betting against beta” strategy that Asness analyzed is minimum volatility’s inclusion of stocks that are quite volatile, provided … Continue reading And value? Asness found this has a steeper slope than the other factors (0.84), but in the case of the MSCI World Value Weighted Index, its relative valuation has cheapened considerably over the past 22 years, so there’s been no valuation uplift around that could claim credit for the strategy’s outperformance.
We employed similar regressions on the data for MSCI factor indexes, which extend back only to 1994 (AQR’s data dates to 1968) and is not constructed identically to the data Asness uses.[11]While comprehensive datasets are available at no cost to the public from Dartmouth professor Ken French and from AQR, we are using MSCI factor indexes in this case because MSCI indexes are a better … Continue reading Still, our results were broadly consistent with Asness’s findings. The intercept of each factor’s excess return was positive, and in each case, except for value, rising relative valuations appear to have provided a modest boost to the strategy’s outperformance (for value, falling relative valuations detracted from the strategy’s performance as value stocks became cheaper over the period). The value strategy’s excess return had the closest relationship to the change in relative valuations (R-squared of 64%), followed by minimum volatility (48%), quality (39%), and finally the relatively independent momentum factor (21%).
To summarize, we do not believe the available evidence supports Arnott’s allegation that the past performance of alternative beta strategies was “an illusion driven by rising relative valuation levels.”
Minimum Volatility Headwinds
As noted, minimum volatility equities today trade at a rich premium to broad markets, but initial relative valuations for minimum volatility strategies have not been closely correlated with subsequent excess returns. A greater concern might be crowding. We have noticed that the most overweighted stocks in low-vol exchange-traded funds (ETFs) today show a slightly higher correlation to the ETFs themselves than to the stocks’ own sectors, indicating that investors are likely trading low-vol stocks as a group, and that these stocks are trading more in sympathy with other low-vol stocks than with sector peers.[12]We evaluated the correlations for the individual calendar years 2012 through 2016-to-date for 21 stocks, comparing the excess returns of the stocks with the excess returns of both a low-vol ETF and a … Continue reading Low-vol ETFs have seen net inflows of about $11 billion over the 12 months ended June 30, 2016; whether this represents dangerous crowding or sustainable growth is difficult to say.
Episodes of crowding are not new to investment strategies, and many prominent quantitative investors today will remember well the month of August 2007. The unwinding of a large, levered, quantitative hedge fund was one of the culprits behind the extraordinarily poor short-term performance of several popular quantitative trades.[13]For one account of the quant meltdown, read Scott Patterson, “The Minds Behind the Meltdown,” The Wall Street Journal, January 22, 2010. While the exact trades used today within alternative beta strategies have not been traumatized by crowding before, it is quite possible that they will be in the future. We see this as a potential, rather than likely, occurrence, and most such instances reverse quite quickly. Nevertheless, investors in these strategies may require an iron stomach.
Further, the minimum volatility strategy has benefited strongly from its consistent, outsized exposure to utility and telecommunications stocks. The MSCI World Minimum Volatility Index has a combined overweight of about 10% to these two sectors, and it has been at least 5 ppts overweight compared to the parent index since mid-2006. These sectors have historically outperformed when bonds have performed well. In fact, the annualized excess return of the MSCI World Utilities Index over the past two decades has been 7.2% during quarters when the Bloomberg Barclays Aggregate Bond Index outperformed cash, versus 12.8% underperformance when bonds underperformed cash (for telecoms, the outperformance during good quarters for bonds has been 1.5%, versus -5.8% during poor quarters for bonds). If interest rates were to rise (unlikely as that may seem in today’s negative yield environment), utility shares and the strategies that overweight them could be tested.
While there are legitimate reasons to continue to own minimum volatility portfolios, we believe they are less compelling today than other alternative beta strategies.
Conclusion
Alternative beta strategies have generated substantial attention and inflows from investors in recent years. Relative valuations for some of the strategies are high today, raising concerns on the part of some observers that the strategies could be destined to underperform, and indeed that their historical outperformance could even be a mirage.
Based on the data, the historical excess returns of alternative beta strategies are not solely attributable to valuation uplift. Additionally, today’s elevated relative valuations are generally not particularly worrisome, since for most alternative beta strategies, initial relative valuations are not closely aligned with subsequent returns (turnover within the strategies can cause valuations to shift wildly without investors experiencing similar performance swings). While relative valuations do not pose a particular concern, minimum volatility may face headwinds due to overdependence on sectors that have benefited from suppressed interest rates.
Finally, some investors fear that some alternative beta strategies are crowded today. This is difficult to prove or disprove in real time, but investors need to be prepared for this possibility.
Sean McLaughlin, Managing Director
Alexandra Deceder, Assistant Manager, Capital Markets Research
Footnotes