Executive Summary
- Alternative beta indexes strive to aggregate market securities based on objective criteria, weighting them in a way that is not limited to their share price or market capitalization. The weighting factors can include company fundamentals, share price volatility, earnings sustainability, or price momentum, in addition to a naïve equal-weighting approach.
- Alternative beta strategies, which some firms call “smart beta,” seek to outperform the cap-weighted index over a market cycle, or to provide competitive returns at a lower risk level than the broad market. As opposed to traditional indexes, alternative beta indexes rebalance periodically to bring weights back to the level indicated by the index’s methodology, often buying more shares of companies that have underperformed since the last rebalance while trimming those that have outperformed.
- Most alternative beta strategies are plays on long-standing empirical evidence: value, size, momentum, and low volatility—market premiums that have all shown superior risk/return characteristics compared to broad-market benchmarks and are used by most fundamental and many quantitative equity managers. What is novel about these new strategies is their greater transparency and lower fees compared to traditional active management.
- While the universe of strategies under this umbrella is large and growing quickly, alternative beta strategies include equal weighted, fundamental weighted, momentum, minimum volatility, and quality.
- We believe that several of the strategies have the potential to outperform broad indexes; however, the future performance of these strategies, implemented in real markets by managers, will likely be more modest and less consistent than the backtested performance record suggests. In addition, future relative performance may be influenced by today’s relative valuations for the strategies, and excess returns may erode should assets pile in.
- While we cannot be certain that alternative beta indexes will offer superior risk/return behavior, we believe the following: equal-weighted strategies will benefit from rebalancing, assuming turnover and transaction costs are well managed; value-weighted strategies will offer long-term benefits from the combination of value exposure and rebalancing; momentum strategies should continue to offer attractive returns for the long term, supported by behavioral investor biases and some degree of differential risks; minimum-volatility strategies appear likely to continue providing better risk-adjusted returns than their low beta would initially imply, supported by behavioral biases and leverage aversion; and quality/profitability returns should be comparable to broad equity indexes over long periods, though these strategies should exhibit moderately defensive characteristics.
- Investors that struggle today to build portfolios of highly active fundamental managers (perhaps because of capacity constraints or governance problems such as the inability to hold onto managers when they temporarily underperform) might find alternative beta particularly appealing.
Alternative beta strategies have generated considerable investor enthusiasm via a substantial body of industry and academic research, significant marketing frenzy, low broad-market return expectations, and dissatisfaction with traditional fundamental equity managers. These systematic strategies—sometimes referred to as “smart beta,” “style premiums” or “factor investments”—seek to improve upon the risk/return dynamic of traditional capitalization-weighted indexes. Versions of some alternative beta strategies (particularly low volatility, momentum, and value-based tilts) have been applied by managers for years; the new elements include understandable, clever packaging and the availability of transparent indexes and lower-fee products. While the historical outperformance of the backtested strategies should be discounted somewhat, some of them offer appealing risk/return prospects at reasonable fees, even net of reasonable transaction cost estimates. Some strategies are particularly appealing when combined. That said, some of the strategies currently are richly valued relative to broad market indexes, so investors must choose carefully. Additionally, several strategies have particular factors in common including tilts to small-cap or value stocks, as well as the boost of rebalancing to returns.[1]When an index of individual stocks is rebalanced according to a non-price variable (such as company fundamentals or level of volatility), the process tends to sell the stocks that have risen in value … Continue reading The prevalence of common factors—rather than differentiated and unique alpha sources—should lead investors to insist on sensible index construction and efficient investment implementation.
In this report we define alternative beta and provide an overview of several established strategies. We also examine future return prospects, return drivers, and return drags; and discuss portfolio implementation considerations and current valuations.
What Is Alternative Beta?
Alternative to What?
Indexes weighted by market capitalization are widely accepted by institutional investors as the neutral position for their portfolios. They represent the investible market, with exposure proportionate to the market value (or free float market value) of individual companies. As such, they serve as the benchmarks upon which active managers are measured, are the basis for passive allocations, and have a beta of 1.0.[2]A cap-weighted portfolio is typically the default way to access a particular market because it buys the entire market, proportioned by the tradable market cap of its respective companies. Beta, as … Continue reading Reasons why cap-weighted benchmarks—and the investible products based upon them—have been and remain popular include: very long data history, including decades of “live” investment; broad exposure to market movements; liquidity; low fees; low turnover; high tax efficiency (as a result of their low turnover); and high transparency.
Critics argue that cap-weighted indexes are overly concentrated in the largest names and subject to momentum. Because price is a direct component of the weighting mechanism, stocks that have performed well have higher weights. The argument is that index investors are buying yesterday’s winners and are thus tilted toward overvalued stocks, subjecting the index to bubbles in hot sectors or regions. A famous example of cap-weighted market distortion occurred during the Japanese equity market bubble in 1989, when new money invested in the global equity indexes allocated upwards of 40% to Japan just before the nation’s bear market. Ten years later, the technology bubble grossly overweighted expensive large-cap tech stocks, with indexes systematically shunning the less richly valued, smaller-cap companies that turned out to be the outperformers of the ensuing decade.
Alternative Beta Defined
Alternative beta indexes strive to aggregate market securities based on objective criteria, weighting them in a way that is not limited to their share price or market capitalization. The weighting factors can include company fundamentals (such as revenues), share price volatility, earnings sustainability (one definition of quality), or price momentum, in addition to a naïve equal-weighting approach. Many indexes focus on one factor or risk premium, while others combine factors.[3]Factors are the way that a strategy or portfolio co-moves with another basket of securities, while risk premiums imply a factor with a positive expected return. It is possible to have exposure to a … Continue reading Any individual factor has its own regression slope (or beta), which is different (i.e., an alternative) from the market’s beta.
Alternative beta strategies seek to outperform the cap-weighted index over a market cycle, or to provide competitive returns at a lower risk level than the broad market. As opposed to traditional indexes, alternative beta indexes rebalance periodically to bring weights back to the level indicated by the index’s methodology, often buying more shares of companies that have underperformed since the last rebalance while trimming those that have outperformed. All are systematic and rules based, so some investors may think of these strategies as passive. However, the decision to move away from the neutral, market cap–weighted index is an active deviation from the market, even if it is implemented in a systematic, rules-based manner.
Most alternative beta strategies are plays on long-standing empirical evidence: value[4]Eugene F. Fama and Kenneth R. French, “The Cross-Section of Expected Stock Returns,” The Journal of Finance 47, no. 2 (1992): 427–465.; size[5]Rolf W. Banz, “The Relationship Between Return and Market Value of Common Stocks,” Journal of Financial Economics 9 (1981): 3–18[6]Unlike long-standing value and size tilts using indexes such as the Russell 1000® Value Index and the Russell 2000® Small-Cap Index, value and size strategies from alternative beta providers often … Continue reading; momentum[7]Narasimhan Jegadeesh and Sheridan Titman, “Returns to Buying Winners and Selling Losers: Implications for Stock Market Efficiency,” The Journal of Finance 48, no. 1 (March 1993): 65–91.; and low volatility[8]Robert A. Haugen and Nardin L. Baker, “The Efficient Market Inefficiency of Capitalization-Weighted Stock Portfolios,” The Journal of Portfolio Management 17, no. 3 (Spring 1991): 35–40.—market premiums that have all shown superior risk/return characteristics compared to broad-market benchmarks. Traditional fundamental active managers implicitly take advantage of these risk premiums when constructing portfolios, and quantitative active managers create multi-factor models around the very same broad factors. While these strategies have been researched and employed in various ways for years, what is novel about the “smart beta” approach is the packaging, particularly the greater transparency and generally lower cost structure than traditional active management.
Figure 1 lists relevant indexes for several alternative beta strategies and lays out the differences between the strategies. While the universe of strategies under this umbrella is large and growing quickly, this report highlights five broad types of alternative beta strategies:
- Equal Weighted. Each security is weighted equally, with the weights rebalanced periodically. Though this strategy has an inherent small-cap bias, it is a simple starting point for investors interested in systematic alternatives to capitalization weighting; liquidity and capacity can be an issue.
- Fundamental Weighted. An intuitive value-centric approach in which stocks are weighted based on fundamental metrics, such as the firm’s revenue. (Value-weighted strategies employ a different name, but the methodologies are conceptually similar.)
- Momentum. Stocks are weighted based on recent performance, overweighting those that have outperformed their peers recently and underweighting those that have underperformed. Two decades of research into this strategy have begun to win over skeptics, as academic studies have consistently demonstrated that they can add value over the long term, though with substantial short-term volatility.
- Minimum Volatility. Exploits the anomaly that lower-volatility stocks have tended to outperform broad indexes on a risk-adjusted basis; however, relative valuations appear rich today.
- Quality. Stocks with high and consistent profitability are systematically assigned higher weightings. Recent research indicates these stocks have historically outperformed, though evidence is somewhat slim compared to other strategies.
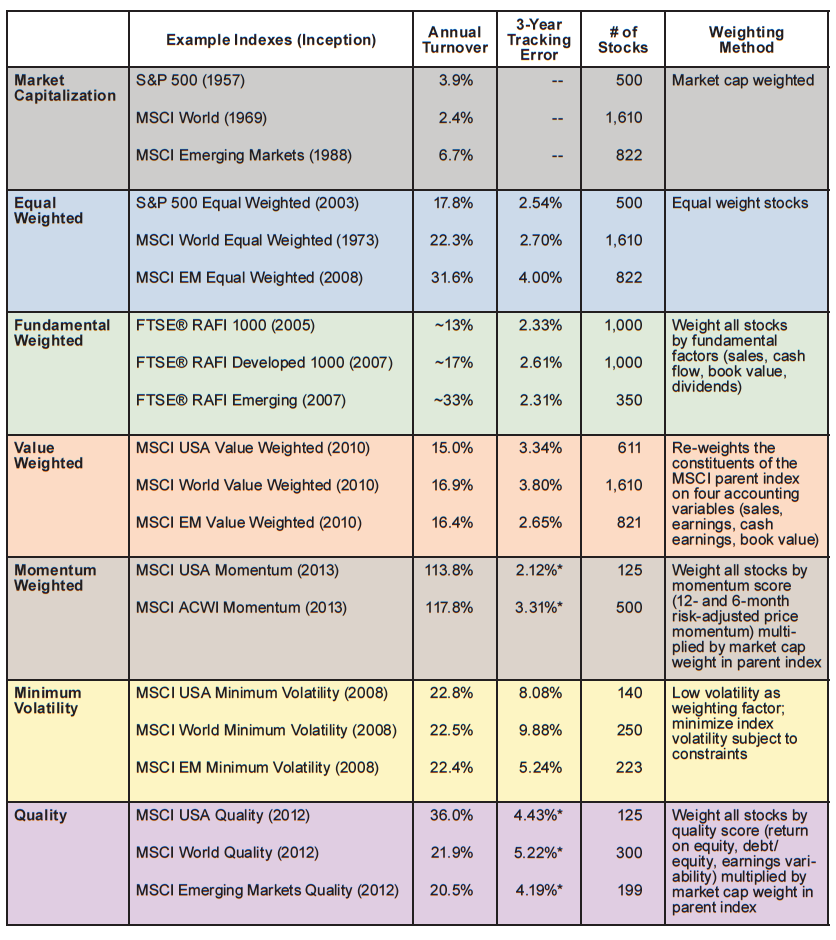
Figure 1. Comparing Traditional and Alternative Indexes

Figure 1. Comparing Traditional and Alternative Indexes (continued)
* Tracking error figures calculated using a backtest for indexes incepted less than three years ago.
Notes: Most data are as of December 31, 2013. Exceptions are estimated figures (marked by ~), which are estimated based on turnover figures for ETFs tracking the index (in the case of FTSE® RAFI indexes). Tracking error is relative to the appropriate cap weighted index, as determined by geography.
Readers who are not fluent in the details of alternative beta strategies should visit the Appendix for an in-depth discussion of the strategies shown in Figure 1, as well as strategies employing a mix of factors.[9]We chose these strategies because equal-weighted indexes are a helpful starting point, and the other strategies appear to be gaining traction among some of the large institutions that have embraced … Continue reading
Return Considerations
Does Alternative Beta Add Value?
Proponents of “alternative beta” typically brand the products as “smart beta” and strongly suggest that traditional cap-weighted indexes represent an outmoded approach to managing money. They describe smart beta as an obvious choice because of higher long-run expected returns, a superior Sharpe ratio, or both. We believe that several of the strategies have the potential to outperform broad indexes; however, the future performance of these strategies, implemented in real markets by managers, will likely be more modest and less consistent than the backtested performance record suggests. In addition, relative performance from this starting point may be influenced by today’s relative valuations for the strategies, and excess returns may erode should assets pile in. Finally, investors should be aware that some of the historical outperformance is coming from systematic rebalancing.
While historical returns seem impressive (as shown in the coming pages), potential investors should keep in mind the following qualifiers:
- The claimed historical returns of these strategies are mostly backtests, with little or no assets explicitly managed until recently. Backtests are notorious for building and then dashing expectations[10]We have yet to see a backtested return series presented by a manager or index provider that was unattractive; subsequent live returns are sometimes another story. The researcher will likely tweak the … Continue reading. What size haircut should the backtest results receive to reflect the risk that out-of-sample results will be different?[11]We do not have a good estimate of this, but the right number could be substantial. One quantitatively oriented money management firm evaluating a backtest applied a roughly 1,000 bp discount of the … Continue reading
- The backtests generally do not incorporate any assumption for transaction costs. These may be material for some strategies, where a significant proportion of the assumed historical return may be coming from rebalancing and where annual turnover is high. For example, annual turnover of 50% and a roundtrip transaction cost (including market impact, bid/offer spread, and brokerage commissions) of 100 bps would lower the strategy’s actual return by 50 bps per year relative to the hypothetical backtest. While transaction costs are not baked into historical analysis of cap-weighted indexes either, cap-weighted indexes of large-cap stocks often have turnover of less than 5%.
- Because these strategies are not yet commoditized like cap-weighted indexes, management fees[12]When investors invest via separately managed accounts, they typically will also pay licensing fees to index providers (these are already incorporated into the fee structure of most traditional index … Continue reading command a moderate premium (typically they fall between the fees for passive products and the fees for traditional, fundamental active products). Those fees would cut into net returns for alternative beta strategies to a greater degree than the very low fees for most cap-weighted index funds.
- Returns are highly cyclical and will go through long periods of underperformance relative to the cap-weighted benchmarks. For example, value stocks underperformed growth stocks during the 1990s tech bubble but subsequently outperformed during the early 2000s. Alternative strategies based on a single risk premium will be subject to long periods of underperformance when that particular factor is out of favor.
Even With a Haircut, Return Prospects Are Worth a Look
With these substantial caveats in mind, Figure 2 illustrates the range of historical rolling three-year outperformance for six alternative beta indexes, both global and US. The median three-year annualized outperformance for the displayed alternative beta strategies ranges from 1.4% to 4.4% for global indexes and 0.7% to 3.1% for US indexes. Market capitalization–weighted small-cap indexes are included in each chart for comparison. The graph’s horizontal axis indicates the historical level of variability of each index’s outperformance over time. As stated previously, to evaluate the potential future outperformance of these strategies, haircutting the historical results would be prudent because the displayed histories are primarily in-sample backtests (and thus may be over-fitted or the product of data-mining) and did not incur transaction costs or manager/index-licensing fees.
Historical excess returns as illustrated here may be elevated compared to the future returns that investors experience, due to numerous factors not necessarily reflected in the periods shown, including: transaction costs, manager fees, back-test bias, and current relative valuations

Figure 2. Historical Excess Returns for Alternative Beta Indexes
Index Inception – June 30, 2014
Sources: FTSE International Limited, MSCI Inc., and Thomson Reuters Datastream. MSCI data provided “as is” without any express or implied warranties.
Notes: Volatility of 12-month excess return calculated by taking the median of the absolute values of all overlapping 12-month excess returns. MSCI World Small Cap and MSCI US Small Cap are the market-cap weighted indexes shown for comparison. The inception date for each strategy, together with the excess return AACR for each strategy since inception, are as follows:
Global Indexes: FTSE® RAFI Developed 1000 [Fundamental] (December 31, 1999; 2.9), MSCI All Country World Momentum (May 31, 1991; 3.2), MSCI World Equal Weighted (December 31, 1998; 3.3), MSCI World Minimum Volatility (December 31, 1998; 1.2), MSCI World Quality (December 31, 1981; 2.3), MSCI World Small Cap (December 31, 2000; 5.1), and MSCI World Value Weighted (November 30, 1976; 1.2).
US Indexes: FTSE® RAFI US 1000 [Fundamental] (December 31, 1999; 4.2), MSCI US Equal Weighted (December 31, 1998; 3.3), MSCI US Minimum Volatility (December 31, 1998; 1.1), MSCI US Momentum (December 31, 1976; 2.7), MSCI US Quality (December 31, 1981; 1.6), MSCI US Small Cap (December 31, 2000; 5.2), and MSCI US Value Weighted (November 30, 1976; 0.7).
Figure 3 shows the annualized returns and Sharpe ratios for each strategy over the longest period that is common to all strategies, which is just over 14 years. The returns are highly endpoint-dependent, and investors should not assume that returns or Sharpe ratios for that historical and largely in-sample period will have any relationship to future returns for the strategies (either in an absolute or even a relative sense).

Figure 3. Alternative Beta AACRs vs Annualized Standard Deviations
January 31, 2001 – June 30, 2014
Sources: Frank Russell Company, FTSE International Limited, MSCI Inc., and Thomson Reuters Datastream. MSCI data provided “as is” without any express or implied warranties.
Notes: The indexes used are as follows:
Global Indexes: FTSE® RAFI Developed 1000 [Fundamental], MSCI All Country World Momentum, MSCI World Equal Weighted, MSCI World Minimum Volatility, MSCI World [Developed Markets], MSCI World Quality, MSCI World Small Cap, and MSCI World Value Weighted.
US Indexes: FTSE® RAFI US 1000 [Fundamental], MSCI US [US Equities], MSCI US Equal Weighted, MSCI US Minimum Volatility, MSCI US Momentum, MSCI US Quality, MSCI US Small Cap, MSCI US Value Weighted, and Russell 1000® [Large Cap].
Rebalancing and Small/Value Factor Tilts Are Major Contributors
Some of the historical excess returns of these strategies appear to stem from systematic rebalancing and from exposure over time to well-recognized risk factors: value, small cap, and, to a lesser degree, momentum. To what degree are these present across strategies, and what are the implications?
Rebalancing. Mechanically rebalancing individual stocks or sectors can add up to outperformance over time (on paper at least, before transaction costs are taken into account) as investors systematically sell securities that have risen in price and buy stocks that have fallen in price. As a simple illustration, imagine an equal-weighted portfolio of the ten S&P 500 economic sectors (rebalancing each sector back to a 10% weight on a quarterly basis): this equal-sector-weight portfolio would have returned 10.4% annually since 1990, beating the average return of its component sectors by 90 bps annualized.[13]The S&P 500 Equal-Weight Index, which holds equal weights in each underlying stock, further improves the returns by an additional 90 bps in this example, to 11.3% annually. Even accounting for moderate transaction costs, this is a significant level of outperformance. (These levels of outperformance are consistent across other equal-weighted strategies, though transaction costs can be higher.)
Because alternative beta strategies are typically not capitalization weighted, they benefit from rebalancing their individual stock components periodically. As in our example above, transaction costs will diminish the backtested rebalancing premium.
Value and Small-Cap Tilts. Academics and practitioners have long recognized that stocks with low valuations tend to outperform over the long term. The value anomaly has a long out-of-sample history, as does the small-cap anomaly, though there is some debate about whether small caps offer higher performance than indicated by their elevated risk level. Regardless, many investors have criticized alternative beta strategies as simply being expensive ways to execute a small/value tilt. Indeed, many of these strategies tend to have exposure to small and value, when measured over long periods.
An important paper published last year[14]Robert D. Arnott, Jason Hsu, Vitali Kalesnik, and Phil Tindall, “The Surprising Alpha from Malkiel’s Monkey and Upside-Down Strategies,” The Journal of Portfolio Management 39, no. 4 (Summer … Continue reading found that equal-weighted, minimum variance, and fundamental strategies all had substantial small and value exposure for the period from 1964 to 2012. This is not particularly surprising—the researchers also found that 100 randomly created “Malkiel’s Monkey” portfolios also had small and value tilts. Portfolios that structurally underweight the large, successful companies at the top of the capitalization-weighted index will naturally tend to have these tilts. However, the small and value exposure of alternative beta indexes is not necessarily steady—it ebbs and flows (Figure 4). Some strategies have more of these tilts than others. It strikes us that engineering these performance streams on a forward-looking basis is likely not as simple as allocating to small caps and value stocks.[15]One of the unexpected conclusions of the “Malkiel’s Monkey” paper (unexpected, given that three of the four authors are affiliated with a pioneering alternative beta asset management firm) was … Continue reading

Figure 4. Exposure to Value and Small-Cap Premiums Across Alternative Beta Indexes

Figure 4. Exposure to Value and Small-Cap Premiums Across Alternative Beta Indexes (continued)
Sources: MSCI Inc. and the Online Data Library of Dartmouth Professor Kenneth French. MSCI data provided “as is” without any express or implied warranties.
Notes: The factors shown are long/short terciles (for example, the value factor is long the one-third of equities with the lowest valuations and is short the highest-valued third). The indexes used are as follows:
Global Indexes: MSCI All Country World Momentum, MSCI World Equal Weighted, MSCI World Minimum Volatility, MSCI World Quality, and MSCI World Value Weighted.
US Indexes: MSCI US Equal Weighted, MSCI US Minimum Volatility, MSCI US Momentum, MSCI US Quality, and MSCI US Value Weighted.
Clearly, there are numerous contributors to these index returns. They naturally capture some broad-market beta, have benefited from rebalancing, and many are exposed (at least periodically) to small-cap and value factors that have tended to outperform historically.
The existence of the small-cap premium is being debated (please see our May 2014 research note The US Size Effect: How Long Will It Defy Gravity?), but few investors or academics question that stocks with low starting valuations should generate higher returns.
Additionally, they are exposed to the factors trumpeted in their names, which may or may not command a risk/return premium.
Future Prospects for Returns
While we cannot be certain that alternative beta indexes will offer superior “live” risk/return behavior, we believe the following:
- Equal-weighted strategies will benefit from rebalancing, assuming turnover and transaction costs are well managed. Given higher transaction costs for less liquid asset classes such as small caps and emerging markets stocks, equal-weighted strategies are most useful for larger-cap, more liquid asset classes.
- Value-weighted strategies will offer long-term benefits from the combination of value exposure and rebalancing, as an approach that weights by company fundamentals should be more effective than a traditional value index that merely cap weights a population of value stocks. However, turnover is moderately higher in a value-weighted index.
- Momentum strategies should continue to offer attractive returns for the long term, supported by behavioral investor biases and some degree of differential risks. Correlations with value are also low, which is beneficial; however, investors must watch transaction costs and expect volatility.
- Minimum-volatility strategies appear likely to continue providing better risk-adjusted returns than their low beta would initially imply, supported by behavioral biases and leverage aversion. That said, given today’s rich relative valuations, a continuation of the recent trend of strong outperformance is less likely.
- Quality/profitability strategies are the new kids on the block, with limited research support and widely disparate methodologies. We expect returns to be comparable to broad equity indexes over long periods, though these strategies should exhibit moderately defensive characteristics.
As mentioned before, all of these risk premiums are factors that some fundamental and many quantitative equity managers already exploit. What is novel about these new strategies is their greater transparency and lower fees compared to traditional active management.
Portfolio Implementation and Relative Valuations
Can Alternative Beta Strategies Play Well With Others?
A well-chosen portfolio of high conviction, active managers can add significant alpha. Our recently published research report Hallmarks of Successful Active Equity Managers highlights how investors might enhance their manager selection process using characteristics including active share. For many investors, passive index products that offer market exposure for a low fee can also play a role in their portfolio.
So how can alternative beta strategies be used, if at all, within a larger portfolio of active and passive products?
- Alternative beta approaches can augment an existing combination of passive and active products to hedge and/or enhance factor exposures. For example, if an overall portfolio has an overweight to active, alpha-generating value managers, adding systematic momentum exposure (using either an active quantitative manager or an alternative beta strategy) would increase portfolio diversification, and the negative correlations of value and momentum excess returns may work together to smooth the overall pattern of manager outperformance over time.
- Capacity constraints often close or limit the assets of highly desirable active managers. If an attractive product is closed, an alternative beta product could be a substitute for that manager’s factor exposure.[16]One of the unexpected conclusions of the “Malkiel’s Monkey” paper (unexpected, given that three of the four authors are affiliated with a pioneering alternative beta asset management firm) was … Continue reading (For example, using a value-centric alternative beta strategy when a desired value manager is closed.)
- Large investment pools may struggle to place the desired level of assets with active managers because their size could overwhelm the manager. Because alternative beta strategies are not currently capacity constrained, investors can use them to get exposure to risk premiums they expected to get with active managers.
- Closet indexers are mutual fund managers that charge active fees for returns that are essentially that of the index. Avoid them! Rather than pay large fees for index-like returns, use either an alternative beta product with lower fees or a better, alpha-focused active manager that’s not afraid to deviate materially from the index.
What Are Relative Valuations Telling Us?
While the “live” histories of many alternative beta strategies are limited, the future outperformance or underperformance of a given strategy is likely influenced by its starting level of relative valuations (compared to a broad index). However, the starting relative valuation is only part of the puzzle. On a P/B basis, some alternative beta strategies tend to trade at a persistent premium or discount to broad markets, so the strategy’s current valuation discount or premium versus the broad market may only tell investors part of what they need to know.
Figure 5 compares each alternative beta strategy’s historical level of discount or premium over the past 15 years with today’s discount or premium. The US value-weighted strategy, for example, currently trades at approximately a 26% discount to the value-weighted MSCI ACWI Index, which is very similar to the strategy’s 27% historical average discount. Momentum, quality, and equal-weighted strategies trade close to their historical median premium/discount today for global indexes.
Current valuation premiums are richer than average for minimum volatility; this is clear in Figure 5 but also evident in other data sets with longer histories. Data shared with us by four authors of a working paper were used to compile Figures 6 and 7. Figure 6 shows that valuation discounts have been the rule for low-volatility US stocks over the past several decades, compared to a very high premium over the past few years. Low-volatility stocks traded at a valuation discount to high-volatility stocks about 80% of the time since 1968, and we believe that this valuation differential (which has been reversed today) explains much of the historical outperformance of minimum-volatility strategies. Figure 7 illustrates that the initial level of discount or premium for low-volatility stocks versus high-volatility stocks influences the subsequent level of outperformance for the MSCI USA Minimum Volatility Index.

Figure 5. Valuation Premium/Discount of Alternative Beta Indexes to Broad Market
January 31, 1999 – June 30, 2014
Sources: MSCI Inc. and Thomson Reuters Datastream. MSCI data provided “as is” without any express or implied warranties.
Notes: The indexes used are as follows:
Global Indexes: MSCI All Country World Momentum, MSCI World Equal Weighted, MSCI World Minimum Volatility, MSCI World Quality, and MSCI World Value Weighted.
US Indexes: MSCI US Equal Weighted, MSCI US Minimum Volatility, MSCI US Momentum, MSCI US Quality, and MSCI US Value Weighted.

Figure 6. Relative Valuation of Low Volatility vs High Volatility US Large-Cap Shares
February 28, 1968 – December 31, 2013
Sources: Center for Research in Securities Prices, Compustat, “Low-Volatility Cycles: The Influence of Valuation and Momentum on Low-Volatility Portfolios” (December 11, 2013, working paper by Luis Garcia-Feijoo, Lawrence Kochard, Rodney Sullivan, and Peng Wang; data provided by Peng Wang and used with his permission), MSCI Inc., and Thomson Reuters Datastream. MSCI data provided “as is” without any express or implied warranties.
Notes: Represents the largest one-third of companies within the CRSP database that have December 31 fiscal-year ends. The fiscal year stipulation eliminates a material fraction of the universe, including some technology and retail firms.

Figure 7. Initial Relative Valuations and Subsequent 5-Year Excess Returns for US Low Volatility Stocks
December 31, 1998 – April 30, 2009
Sources: Center for Research in Securities Prices, Compustat, “Low-Volatility Cycles: The Influence of Valuation and Momentum on Low-Volatility Portfolios” (December 11, 2013, working paper by Luis Garcia-Feijoo, Lawrence Kochard, Rodney Sullivan, and Peng Wang; data provided by Peng Wang and used with his permission), MSCI Inc., and Thomson Reuters Datastream. MSCI data provided “as is” without any express or implied warranties.
Notes: Represents the largest one-third of companies within the CRSP database that have December 31 fiscal-year ends. The fiscal year stipulation eliminates a material fraction of the universe, including some technology and retail firms.
Depending on the chosen data source, low-volatility stocks are currently either moderately overvalued or very overvalued compared to historical relative valuations—neither points to excess returns continuing to be as strong. That said, some investors might be perfectly comfortable with returns that are somewhat below those of broad equities, as long as volatility is substantially lower (i.e., if Sharpe ratios remain appealing compared to broad equities).
Conclusion
While the alternative beta packaging is relatively new and the emphasis on greater transparency and lower fees should be beneficial, most of the research framework supporting the underlying strategies is decades-old. Certain strategies are promising. Fundamental-weighted strategies offer a sensible value tilt and may benefit from rebalancing. Momentum has been extensively researched, and offers strong outperformance that is uncorrelated with value strategies. Low-volatility strategies can be useful as well, particularly for investors that are unable to invest directly in hedge funds; however, the valuation discount historically attached to low-volatility stocks has reversed, which may pressure future relative performance.
Investors that struggle today to build portfolios of highly active fundamental managers (perhaps because of capacity constraints or governance problems such as the inability to hold onto managers when they temporarily underperform) might find alternative beta particularly appealing.
Contributors
Sean McLaughlin, Managing Director
Deborah Christie, Managing Director
Footnotes