The start of the year is always a good time to focus on personal improvements with resolutions. In this edition of VantagePoint, we share in the spirit of a new year by providing investment resolutions:
Ten Temptations to Resist in 2017
- Chasing macro and political developments
- Investing while looking through the rearview mirror
- Sticking with a strategy designed to work only in a falling rate environment
- Ignoring the risk of rising inflation
- Giving up on diversification
- Cutting net returns along with fees
- Bucketing hedge funds as if they are all the same
- Taking too much risk eight years into a bull market
- Ignoring currency risk
- Cutting back on belts and braces ahead of what may well be a bumpy ride
1 Chasing macro and political developments
Investors should not make large tactical portfolio bets based on prospective macroeconomic views or political expectations. Incorporating these views into expectations for upside/downside risk and return is reasonable. However, making big tactical moves based on such ideas involves taking outsized risks that require timing entry and exit of a market correctly. As for political expectations today, accurately predicting election outcomes may be less important than accurately predicting the market reaction! Virtually all pundits expected a Brexit decision and a Trump victory to be bad for risk assets, yet that has not been the case. In a business where a 55%–60% hit rate defines success for most skilled investors, such “low breadth” big bets offer poor odds of being additive to portfolios. Did you predict the decline of 2008 and reduce risk exposure in time? Re-enter in early 2009?
The market offers plenty of opportunities for investors to feed their fears and go to cash, an action that fails to pan out more times than not. Some recent examples include concerns over market implications from SARS, Y2K, the 9/11 attacks, Zika, Brexit, and Trump—all of which subsided, giving way to new market highs in risky assets. Remember the consensus view that inflation would get out of control given quantitative easing? Investors shortened bond duration only to watch yields sink to new lows. Now the tide has turned, and investors are pricing in fiscal reflation, particularly in the United States, where president-elect Donald Trump’s proposed policy priorities have fertilized a nascent reflationary move that began late summer 2016. Markets have priced in high odds that Trump’s initiatives will be implemented and enhance growth. Investments that would benefit from higher infrastructure spending, corporate and income tax cuts, lower taxes on foreign profit repatriation, and a lighter touch on banking, health care, and climate change regulation have moved rapidly to price in improved conditions. Much of this policy agenda may come to pass, yet investors should not lose sight of the potential for proposals to evolve as they move through Congress, for priorities to change, and for the complexities of global capital markets and economies to bring unexpected consequences that shift the landscape yet again.
Examples of prospects for upside/downside surprises are plentiful. Despite the plethora of ailments that afflict the European landscape, economic growth is starting to surprise to the upside; the yield curve is steepening, which could help banks and support lending; and prospects for extremist parties winning 2017’s round of elections are receding. A major downside consideration is that the potential for higher inflation in the United States leads the Federal Reserve to tighten more aggressively than priced in, bringing on the next US, and likely global, recession. Investors would be well served to position portfolios carefully and limit tactical positions, which should be informed by upside/downside potential based on historical performance patterns and valuations.
2 Investing while looking through the rearview mirror
Markets are cyclical. Just when it seemed that value would never outperform growth, commodities were doomed to a long cycle of supply/demand adjustment, and banks were to be priced like utilities forever, markets changed their mind (Figure 1). Oil producers slashed capital expenditures severely for two consecutive years amid modestly expanding demand; Treasury yields increased and the yield curve steepened, flattering bank profit margins; and economic growth stabilized. Market leadership rotates over time. The current cycle has been drawn out, so it is natural that trends have persisted longer than might typically be the case. If you are not willing to accept that markets rotate, you’ll miss the bend in the road while focusing your gaze on the rearview mirror. The next major value cycle may see some setbacks before it is firmly established, but it will turn, as will the cycle for emerging markets equity versus developed markets equity and active versus passive management, among others.

Figure 1. The Cycles Keep Turning
Sources: MSCI Inc. and Thomson Reuters Datastream. MSCI data provided “as is” without any express or implied warranties.
Note: Shading represents periods of value outperformance.
3 Sticking with a strategy designed to work only in a falling rate environment
From the start of the bond bull market in 1981, ten-year US Treasury yields fell 14 percentage points (ppts) through the July 2016 low, returning 6% annually in real terms, while US stocks returned 9%. In contrast, over the preceding bond bear market (1945–81) the US ten-year yield increased 14 ppts, producing real returns of -2%, while US equities returned 5%. What might happen to portfolios if rates undergo a prolonged upturn, particularly in the United States where secular lows have most likely been seen?
An increase in yields (beyond what is priced in) is bad for bond returns,[1]The capital loss from an increase in yields can be offset if the yield curve steepens, as portfolios benefit from higher roll down returns over the holding period. When the yield curve is positively … Continue reading but has mixed implications for equities. (See appendix for a more detailed analysis.) Higher yields will see equity prices fall, all else equal, as cash flows will be discounted at a higher rate. Yet when yields increase because real growth prospects are expected to improve, equities often appreciate as the rise in earnings growth expectations offsets the negative real yield effect. Should confidence in earnings growth increase, the equity risk premium may fall, further offsetting the effects from an increase in sovereign yields. However, an environment where yields increase because of rising inflation expectations is typically negative to neutral for equities.
We have seen these dynamics play out in stock/bond correlations (Figure 2). At the start of the bond bull market, correlations of high-quality sovereigns and equities were generally positive, turning negative at the turn of the century. Both stocks and bonds benefited in the 1980s and 1990s environment of falling yields (and inflation) and reasonable growth. Even during periods of rising growth expectations, the damage to bond returns was eventually offset by high coupons and a resumption of the secular decline in yields. In contrast, since 2000, correlations have turned negative as bond yields and income from coupons have been relatively low, and markets have been driven primarily by economic and earnings growth expectations, especially as central banks have kept real rates down. Negative correlations made bonds worth holding as their diversification benefits increased even as yields—and expected returns—fell. However, if yields are in a secular upturn, their diversification benefits may diminish as correlations turn positive, a condition that would be most concerning in down markets for risky assets. The few periods of positive correlations in recent years (most notably the “taper tantrum” in 2013 and the recent back up in yields from post-Brexit lows) have been short lived, but prospects for a more lasting regime change should be considered. If sovereign bonds and equities fall at the same time (in a scenario where, for example, interest rates rise and real growth disappoints), what would be the impact on your portfolio? How would you meet your cash needs? Diversification into assets that have fundamentally different sources of return from equities and sovereign bonds (e.g., royalty funds) may prove to be additive to portfolios.
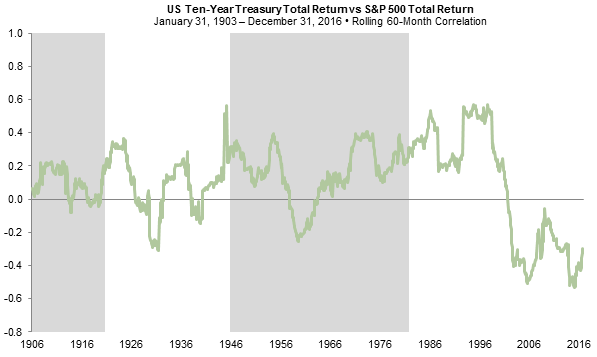
Figure 2. Bonds’ Diversification Benefits May Diminish If Correlations Turn Positive
Sources: Global Financial Data, Inc. and Standard & Poor’s.
Note: Shaded areas represent secular periods of increasing ten-year treasury yields.
4 Ignoring the risk of rising inflation
Please see Meagan Nichols and Eric Winig, “Time to Get Real About Real Assets,” Cambridge Associates Research Report, 2014.
Much economic slack has been worked off globally, particularly in the United States. While deflationary pressure remains, we expect that we have seen the bottom of deflation concerns (possibly for the long term, but at least until the next recession). Increasing fiscal spending and cutting taxes at a time of full employment could result in an increase in inflation. Investors should prepare for this eventuality, which could be particularly challenging should liabilities increase with inflation (given, for example, the use of floating rate debt, pension benefit cost of living adjustments, and lack of pricing power for revenues to keep pace with inflation). While high-quality equities keep up with inflation over the long run, natural resources equities and real assets, which may be more sensitive to rising inflation expectations, may be worth owning today. Real assets can have a high opportunity cost when they are expensively valued and inflation is low. However, reasonably priced real asset investments with attractive return potential can be found today, even if inflation doesn’t get ahead of expectations. Pick up these cheap inflation options.
5 Giving up on diversification
Diversification has received a bad rap in recent years. When one mainstream asset class or investment strategy outperforms virtually everything else, investors reliably will doubt the wisdom of diversification. Since 2009, US equities have outperformed every major asset class by a considerable margin, returning 14.5%, while a simple 70% US equity/30% bond portfolio returned 11.4% annualized. Questions of “why not invest 100% in US equities or a 70/30 portfolio?” are surfacing again, reminding us of the late 1990s when US equities returned over 30% and a 70/30 portfolio returned more than 20% annualized from 1995 to 1998. We suspect the future holds what we have seen time and time again: the tide eventually turns, and diversification protects investors from maintaining too much exposure to the worst performing assets, which are often the best recent performers.
Investors seeking to preserve or grow purchasing power while supporting a steady flow of spending require diversified portfolios to both grow assets and maintain enough stability to support spending without being forced to sell assets at depressed prices during bear markets. Diversified portfolios structured to earn returns comparable to their rate of spending at tolerable levels of risk provide the best long-term strategy for meeting such objectives. Based on our long-term performance assumptions, a diversified portfolio with the same level of expected volatility as a 70/30 portfolio has an expected return nearly 100 basis points (bps) higher, annualized, and is expected to create more wealth even after spending more over time (Figure 3).
Today, diversification is particularly important. As investors consider where returns will come from in the future and how the transition from low yields/high valuations to more “normal” conditions may evolve, investing in a diversified basket of assets that balances return-seeking with stability will be particularly critical.
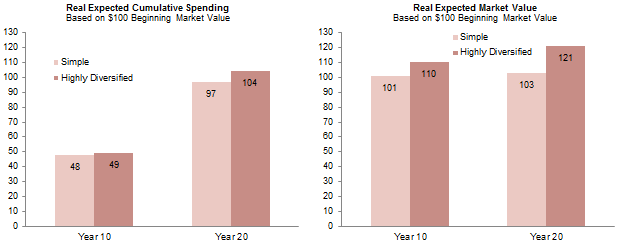
Figure 3. Diversification Increases Expected Returns and Spending to Less Diversified Portfolios with the Same Volatility Relative
Source: Cambridge Associates LLC.
Notes: This illustration uses our equilibrium assumptions for asset class returns and volatility to estimate ending market values and cumulative spending adjusted for inflation after 10 and 20 years for two portfolios. The simple portfolio consists of 50% US equities, 20% developed markets ex US equities, and 30% US government bonds. The highly diversified portfolio consists of: 15% US equities, 15% developed markets ex US equities, 12% equity hedge funds, 8% absolute return hedge funds, 8% private equity, 8% US government bonds, 6% emerging markets equities, 5% commodities, 5% venture capital, 4% oil & gas, 4% real estate, 3% timber, 2% developed market government bonds, 2% real estate securities, 2% US TIPS, and 1% high-yield bonds. Return and standard deviation for simple portfolio are 5.8% and 11.8%, respectively, versus 6.6% and 11.8%, respectively, for highly diversified portfolio. Inflation rate is assumed to be 3% and spending rule is 5% of ending trailing 12-quarter market value.
6 Cutting net returns along with fees
Passive investing and fee minimization have been powerful trends in recent years. Low fees make sense, but don’t overdo it. The vast majority of the best performing institutions (somewhat counterintuitively) have paid the highest fees as a percentage of assets (management and incentive fees), because they have focused on strategies that are expensive and difficult to replicate, such as venture capital, specialized private equity, and other alternative assets that tend to charge higher fees than those levied by long-only stock and bond managers or index funds and ETFs. Yet, such strategies, when well executed, generate returns in excess of public markets net of their higher fees.
Please see Kevin Ely, “Hallmarks of Successful Active Equity Managers,” Cambridge Associates Research Report, 2014.
In addition, we have found that within asset classes and investment strategies, fees are not strongly related to net of fee performance. For example, long-only active equity managers with higher active share or that run more concentrated portfolios tend to charge higher fees than less active managers, but, on average, have produced more value add over their respective benchmarks. Similarly, an examination of the 1500+ hedge funds in HFR’s Equity Hedge Universe that report incentive fees reveals that both net returns and Sharpe ratios are largely unrelated to fees. In fact, on average, net performance for managers charging the highest incentive fees (over 20%) tends to be strongest. Net performance is also unrelated to management fees charged (Figure 4).
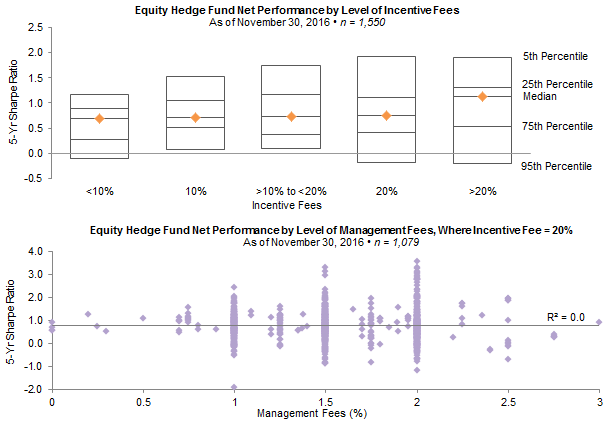
Figure 4. Fees and Performance Net of Fees Are Unrelated
Source: Data derived utilizing HFR Database by Hedge Fund Research, Inc.
Note: Hedge Fund Research data are preliminary for the preceding five months.
At the same time, many of the most popular indexes in recent years have pricey valuations today (e.g., the S&P 500), and structural factors that benefit passive management are approaching a turning point. Valuations are sufficiently elevated that we do not see a way for an inexpensive, indexed portfolio of global stocks and bonds to meet most investors’ return objectives. In fact, if valuations, inflation, and fundamentals were to return to normal conditions over the next decade, we would expect a 70/30 portfolio to produce a real return of about 2%–2.5%.[2]In our return to normal scenario, we incorporate current valuations and assume equity valuations revert to fair value over ten years. This scenario makes assumptions about the market environment … Continue reading Even without valuations mean reverting, it is difficult to develop a plausible scenario where the return after inflation would be much more than 3.5%, unless earnings growth improved significantly and/or multiples expanded further. Value-added returns over indexes today are critical, and their pursuit requires paying fair fees to managers capable of producing higher net returns.
Both fair fees and competitive terms are essential. Limited partners should work with general partners to create an economic value structure that is appropriate and fair for both parties. The balance of fairness in fee structures is susceptible to excess investor demand relative to the availability of high-quality, alpha-generating managers. Today, as investors have flocked to more passive, cheaper strategies, active managers have been increasingly willing to revisit fees and terms. For example, last year Cambridge Associates negotiated better fees and terms with more than 100 managers. More generally, alpha, or manager skill, is rare. If you have found alpha, or difficult to obtain betas/unique exposures, particularly if they are diversifying, you should be willing to pay up.
7 Bucketing hedge funds as if they are all the same
The heyday of easy returns has passed. Investors should not expect a return to the mid- to late 1990s when only 2,000–3,000 hedge funds existed. The number of hedge funds peaked at 10,000+ in 2007 and has remained near that level ever since. At the same time, hedge fund performance has trended down, with the HFR Fund Weighted Composite failing to recapture the over 15% annualized five-year returns in excess of T-bills reached in the 1990s. More recently, the upper end of five-year excess returns has been closer to 8% or 9% as the industry has matured. However, the best hedge funds have been able to add alpha over time, despite a difficult period over the last several years.
Hedge funds have experienced the same challenges faced by active managers more generally, particularly those focused on US equity markets, where macroeconomic factors and technicals (e.g., quantitative easing) have held more sway than fundamentals. Dispersion among stocks and sectors has been low, while correlations have been high, limiting even skilled managers’ ability to differentiate themselves. At the same time, stocks with higher P/E multiples, larger-cap stocks, and bond proxies (e.g., utility stocks, REITs) that tend to be underweighted (or shorted) by active managers have performed particularly well in recent years. If these trends reverse, active managers, including hedge funds, will benefit.
Even during this challenging period for active managers, hedge fund performance has been highly dispersed, reflecting both strategy differences and the wide dispersion in manager skill (Figure 5). While past performance tells us little about the future, the dispersion reflects the importance of not treating all hedge fund strategies and managers as if they are the same. Superb managers should be maintained, as should managers providing exposures that would be difficult to replicate outside of the hedge fund arena.

Figure 5. If You’ve Seen One Hedge Fund, You’ve Seen One Hedge Fund
Sources: Data derived utilizing HFR Database by Hedge Fund Research, Inc. Other sources include Barclays, Bloomberg L.P., MSCI Inc., Standard & Poor’s, and Thomson Reuters Datastream. MSCI data provided “as is” without any implied or express warranties.
Notes: Hedge Fund Research data are preliminary for the preceding five months. Dataset includes 4,007 hedge funds that have reported five-year annualized net of fees returns and Sharpe ratios as of November 30, 2016. Five-year AACRs of S&P 500, MSCI World, and MSCI All Country World are based on monthly returns net of dividend taxes.
8 Taking too much risk eight years into a bull market
It is easy to get lulled into complacency about risk-taking in the later stages of market cycles, a particular concern today in the United States, which is in its eighth year of a bull market and economic expansion. Signs of excess usually crop up in credit markets that see fundamentals deteriorate as easy credit conditions lead to relaxed lending standards and poor capital allocation decisions. Even as the fundamentals for US high-yield borrowers most affected by the commodity sector rout have meaningfully improved, they remain vulnerable to deterioration (Figure 6). For now, debt service ratios for both high-yield and investment-grade bonds look reasonable. But, they are vulnerable to rising policy rates and inflation expectations amid less accommodative monetary policy conditions at a time when the incoming administration seeks to expand fiscal policy at a late stage in the economic cycle. Investors should be sure to focus on segments providing adequate spreads to compensate for this risk. We would be wary of investment-grade and high-yield bonds in the United States and Europe in particular. Leveraged loans and more niche strategies are more attractively priced and positioned to benefit from higher barriers to entry and disruption from regulatory change (e.g., lower-rated CLO debt, some commercial real estate debt, opportunistic credit funds, and some private credit opportunities).
Another area ripe for over-reach is private investments. We continue to believe such investments are a key driver of long-term growth in portfolios. However, as valuations expand, investors would be well served to maintain discipline in commitment sizes, which need not scale to fund size, particularly in segments of the market like late-stage venture capital and mega buyouts that are particularly overheated.
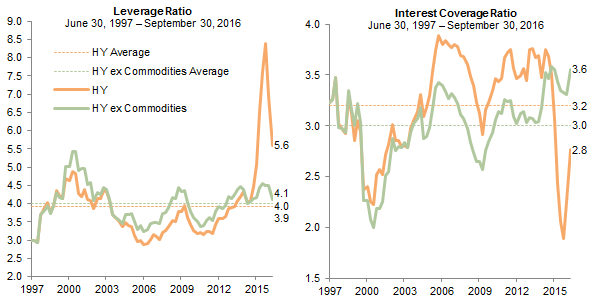
Figure 6. US High-Yield Fundamentals Have Improved But Remain Vulnerable
Source: BofA Merrill Lynch.
Notes: Leverage ratio measures net debt to trailing 12-month EBITDA. Interest coverage ratio measures trailing 12-month EBITDA to trailing 12-month interest expense.
9 Ignoring currency risk
Please see Himanshu Chaturvedi and Kate Miller, “Strategic Currency Hedging Policy: A New Framework,” Cambridge Associates Research Report, 2016.
Low yields combined with divergent monetary policy heighten currency risk today. With strong swings in the pound sterling, US dollar, and Japanese yen in 2016, currencies have been one of the biggest performance differentiators. Consider that in 2016, developed markets equities returned 4.2% in Japanese yen, 7.5% in US dollars, 10.7% in euros, and 28.2% in pound sterling. For UK investors, it almost didn’t matter what underlying assets were included in portfolios last year (Figure 7), provided there was plenty of foreign currency exposure! Reviewing currency risk and exposures to determine if strategic hedging makes sense is appropriate. If you decide not to hedge, understanding currency positioning that comes with your asset allocation is critical, as currency exposure may continue to swamp performance of underlying assets for some markets. For instance, investors with pro-cyclical currencies, like the pound sterling, may find exposure to “safe haven” currencies like the US dollar or Japanese yen to be helpful during down markets, as such currencies tend to appreciate and provide diversification in risk-off environments. For investors with base currencies that are countercyclical in down markets, like the US dollar, overweighting pro-cyclical foreign currencies can result in more downside during risk asset sell-offs. Taking this currency risk may be fine if you have a long-term perspective and see value in cheaper foreign currencies, but the risks should be measured and understood. Hedge or not, but be deliberate.
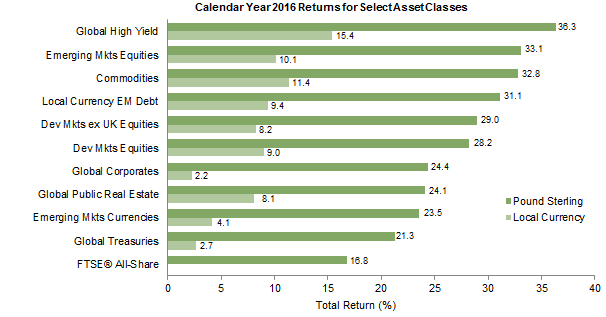
Figure 7. Currency in the Driver’s Seat
Sources: Barclays, Bloomberg L.P., FTSE International Limited, J.P. Morgan Securities, Inc., MSCI Inc., National Association of Real Estate Investment Trusts, Standard & Poor’s, and Thomson Reuters Datastream. MSCI data provided “as is” without any express or implied warranties.
Notes: Total returns for MSCI developed markets equities are net of dividend taxes. Total returns for MSCI emerging markets equities are gross of dividend taxes. “Global High Yield” represented by the Bloomberg Barclays Global High Yield Index, “Emerging Mkts Equities” by the MSCI EM Index, “Commodities” by the S&P GSCI™ Index, “Local Currency EM Debt” by the J.P. Morgan GBI-EM Global Diversified, “Dev Mkts ex UK Equities” by the MSCI World ex UK Index, “Dev Mkts Equities” by the MSCI World Index, “Global Corporates” by the Bloomberg Barclays Global Agg Corporate Index, “Global Public Real Estate” by the FTSE® EPRA/NAREIT Developed Markets RE Index, “Emerging Mkts Currencies” by the J.P. Morgan ELMI+ Index, and “Global Treasuries” by the Bloomberg Barclays Global Treasury Index. Local currency returns for commodities are shown in US dollar terms.
10 Cutting back on belts and braces ahead of what may well be a bumpy ride
It is getting rather late in the economic cycle and investors have quite a bit of geopolitical and macroeconomic uncertainty to digest in the year ahead. Don’t under-allocate to safe assets intended to provide liquidity to meet cash needs in tough times. At the same time, over-allocating can be problematic in a low return environment when it will be difficult to maintain the purchasing power of long-term investment portfolios after spending.
Identifying the right amount of liquidity requires stress-testing portfolios to understand potential vulnerabilities and evaluate preparedness to support future spending needs and capital calls, as well as rebalancing. Additional considerations relate to the potential for debt covenants to be violated or credit ratings to deteriorate. Investors should evaluate portfolios’ ability to weather a wide range of stress environments, including more familiar periods experienced in recent decades, when sovereign bonds served as solid defense to equity-oriented portfolios. Investors should not ignore other environments such as that which has been in hibernation in major developed markets since the 1970s—the risk that economic contraction could be accompanied by rising inflation expectations. Such an analysis should be conducted holistically, not just focused on resources inside of the long-term investment pool.
Summary
Investment Temptations You’ll Want to Resist . . .
. . . and Ways to Set Up for Success
1 Chasing macro and political developments
Use discipline in establishing and sizing tactical positions
2 Investing while looking through the rearview mirror
Understand that markets are cyclical and look ahead to where inflection points may be, based on historical trends and depressed valuations
3 Sticking with a strategy designed to work only in a falling rate environment
Look for investments that can win in a rising rate environment even if growth disappoints
4 Ignoring the risk of rising inflation
Seek out investments that offer cheap protection against inflation, but recognize that they might not pay out when inflation rises, so don’t accept too much opportunity cost
5 Giving up on diversification
Maintain diversification to protect against uncertainty and to find a good balance between return seeking to meet objectives and stability to support spending and other cash needs
6 Cutting net returns along with fees
Negotiate for fees and terms that make sense, but be willing to pay up for skill
7 Bucketing hedge funds as if they are all the same
Maintain selectivity, seeking out managers with a repeatable value proposition and/or unique or difficult to replicate strategies
8 Taking too much risk eight years into a bull market
Evaluate fundamentals and look for investments where you expect to be well compensated for taking risk; remain disciplined in commitments to private investments
9 Ignoring currency risk
Hedge or don’t hedge, but think through the implications, which may overwhelm the return on the underlying assets
10 Cutting back on belts and braces ahead of what may well be a bumpy ride
Stress test portfolios and manage liquidity tightly

Portfolio Tilts From CA’s Chief Investment Strategist
Appendix
Scenario Analysis of Rising Rates’ Impact on US Treasuries and Equities
Please see Celia Dallas and Tim Hope, “Revisiting Fixed Income Investing When Interest Rates Rise,” Cambridge Associates Research Note, October 2015.
The implication of rising rates for bond returns is negative regardless of the driver of the increase. If the ten-year US Treasury yield remains at its current rate of 2.5%, investors should expect slightly higher returns (2.9%) over a five-year horizon for a constant maturity ten-year Treasury investment. However, if rates were to increase by 200 basis points (bps) to 4.5% over a five-year period, returns would be roughly 0.6%, failing to even compensate investors for inflation. The implications of actual versus expected inflation would also have an important impact on real returns. If yields rise, but inflation increases faster than what gets priced in, real returns will be lower than would be the case if investors were prescient. The benefits of higher nominal coupon payments would be confiscated by higher inflation. Of course, should investors err in the opposite direction, extra compensation for higher than expected inflation in the form of higher coupons would help offset any nominal capital loss.
The implications for equities are more complex. Dividend discount model analysis highlights that increases in the discount rate for equities result in falling price-earnings (P/E) ratios, which can have a large negative impact on returns absent a strong enough improvement in earnings growth (Figure 1).[3]The Gordon dividend discount model can be restated to calculate P/E ratios using the following formula: P/E = Dividend Payout Ratio ÷ (Discount Rate – Earnings Growth Rate). For an excellent … Continue reading Over the next five years, if US equities maintain their current discount rate (assumed to be roughly 6% based on the risk-free rate [4]The most common means for estimating the risk-free rate is to use the ten-year Treasury yield. We use the 30-year Treasury yield as the duration of equities is closer to 30 years than ten. plus an equity risk premium) and earnings grow at 4% a year, the P/E multiple would remain unchanged and the annualized return would be about 7%. If the discount rate were to increase 200 bps to 8%, and earnings remained unchanged, the average annual return investors could expect over the next five years would be about -6% as the P/E ratio fell from 21 to 10.5, or a capital loss of 50% (13% annualized). Earnings would need to increase by 180 bps to nearly 6% a year to offset such a steep capital loss (Figure 2).
Movements in the equity risk premium also play an important role in equity returns. For example, if real yields increase based on expectations of stronger real economic growth, the equity risk premium could fall as investors become more confident in prospects for improved earnings growth, offsetting (or even eliminating) the negative effect of the increase in the sovereign yield. Alternatively, if an increase in sovereign yields comes primarily from an increase in inflation expectations, investors might demand a higher equity risk premium on expectations that earnings would not keep pace with inflation, as would be expected in a stagflationary environment. In this case, the discount rate would increase by more than the increase in Treasury yields and earnings growth would not be expected to offset the capital loss as the market P/E ratio would contract.

Appendix Figure 1. P/E Ratio Sensitivity Analysis
Sources: Standard & Poor’s and Thomson Reuters Datastream.

Appendix Figure 2. US Equity Returns’ Relationship with Discount Rate and Earnings Growth
Sources: Standard & Poor’s and Thomson Reuters Datastream.
Notes: Equity returns are based on our dividend discount model. Discount rate changes could be a result of changes in the sovereign yield or the equity risk premium. The starting point for earnings growth is 4% and the discount rate is 6%, which reflect market pricing as of December 31, 2016.
Footnotes