Investors should be wary of modifying their bond exposures solely based on what they think interest rates might do, and focus instead on bonds’ role in the portfolio and on mitigating risk/return asymmetry at current yields
- Shortening duration in advance of rising rates is intuitively appealing, but historical data do not support the notion that shortening the duration of a bond portfolio will improve returns.
- Today’s low sovereign bond yields are unprecedented. Even for long bonds, from a historical perspective, the upside in a falling rate environment is comparable, but the downside in a rising rate environment is more severe.
- This is why we have advised investors that use bonds as a deflation hedge to hold the minimum amount necessary in high-quality intermediate to long duration sovereign bonds and to hold the other portion of their bond allocation in cash or diversifying hedge funds with low equity and credit exposure.
See Max Senter et al., “Fixed Income Investing in a Rising Interest Rate Environment,” Cambridge Associates Research Report, 2003, and “Fixed Income Investing When Interest Rates Rise,” Cambridge Associates Research Report, 2010.
In 2003 and again in 2010, we reminded our readers of the history of bond performance during periods of rising interest rates, which showed that shortening duration was not consistently a winning strategy in rate hike periods and that duration adjustment at the institution level (that is, not mandated and controlled by the manager) was unlikely to add value. An institution has to make two correct timing decisions in such a duration adjustment to be successful and must do so with limited transaction costs. Based on the historical data, shortening duration would seem ill founded: predicting the direction of interest rates is notoriously difficult,[1]Twice a year, for more than 20 years, The Wall Street Journal has published the interest rate forecasts of top economists. These professionals have been wrong about 60% of the time in predicting the … Continue reading and even if rates do rise, shorter-duration portfolios may not outperform.
September 2015 marks nearly seven years since the Fed Funds rate was cut to its current level of 0.25%, by far the longest continual stretch without an increase in at least the last 50 years (Figure 1). However, with tightening labor markets and economic indicators showing stability in the US economy, many investors are expecting the Federal Reserve to finally begin raising rates within the next year. As the interest rate cycle may be finally nearing a turning point (though when the Fed will hike is anyone’s guess), it seems appropriate to revisit the concepts we have shared before, and to consider whether what has happened in the past will really be informative regarding the future.
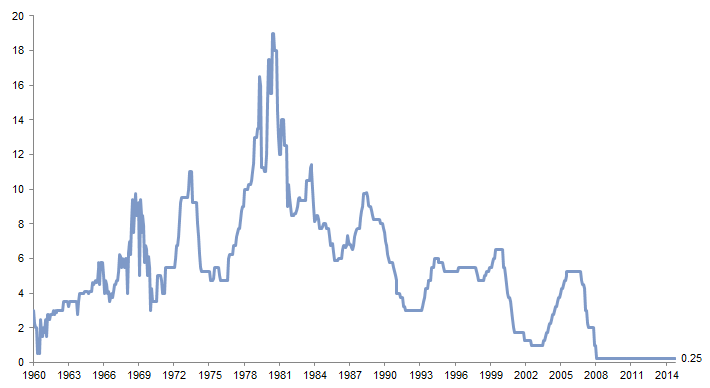
Figure 1. US Fed Funds Target Rate
December 31, 1960 – September 30, 2015 • Percent (%)
Sources: Federal Reserve and Thomson Reuters Datastream.
Note: Data from December 31, 1960 through December 31, 1970 represent the effective Fed Funds rate, not the target Fed Funds rate.
Historical Bond Returns During Rising Rate Environments
First, let’s review the historical record. Since 1970, the Fed has increased the Fed Funds rate by at least 100 bps in 11 periods (Figure 2).
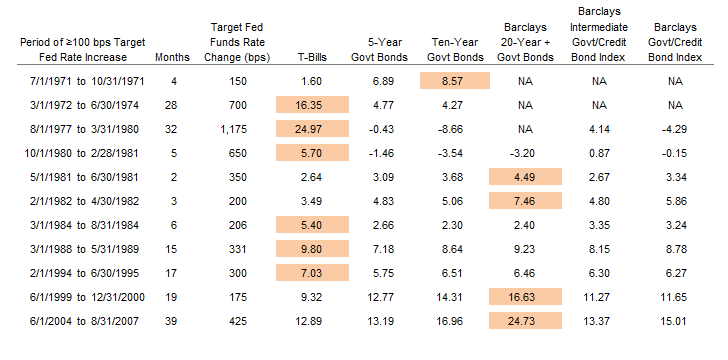
Figure 2. Bond Returns During Periods When Target Fed Funds Rate Increased by 100 bps or More
As of September 30, 2015
Sources: Barclays, Federal Reserve, Global Financial Data, Inc., and Thomson Reuters Datastream.
Examining bond returns for these periods at four points along the curve—Treasury Bills (maturity less than one year), five-year, ten-year, and 20-year-plus maturities[2]Note that 30-year bonds were not issued in the 1970s, and issuance was again suspended from February 2002 to February 2006, so we use the longest-available maturities for analysis.—gives rise to the following observations:
- In five of the 11 periods, government bonds of ten-year or longer maturities were the best performers, and in seven of the 11 periods, the longer maturities outperformed five-year bonds. In fact, five-year bonds were never the best performers, likely because they offered lower yield relative to longer-dated bonds at the start of the tightening periods, and they have more interest rate sensitivity than cash.
- In six of the 11 periods, cash was the best performer. In three of these periods (1984, 1988–89, and 1994–95), cash outperformed by a relatively small amount.
- Cash markedly outperformed in three periods in the high inflation, high interest rate environment of the 1970s and early 1980s, which were also periods when the Fed raised rates by 650 bps or more.
The last two columns of Figure 2 compare two Barclays index return series during periods of rising rates. In the seven periods from May 1981, the longer Government/Credit Index typically matched or outperformed the shorter Intermediate Index—further confirmation that short-duration instruments do not always outperform those of longer duration during periods of rising interest rates.
For the four most recent periods of rising rates, yield curves flattened in response to the Fed’s actions, usually because the short end of the curve rose more than the long end (Figures 3 and 4). In other words, although their longer duration means the price of longer-maturity bonds is more sensitive than the price of shorter-duration bonds to changes in interest rates, in these four instances, the fact that interest rates changed far more for short bonds than long bonds offsets the relative impact of the difference in duration. This twisting action explains why duration cannot be the only guide when making interest rate exposure decisions.

Figure 3. Spread Between Ten-Year and Two-Year Treasury Yields During Periods of Fed Tightening
June 30, 1976 – September 30, 2015 • Percentage Points
Sources: Federal Reserve and Thomson Reuters Datastream.
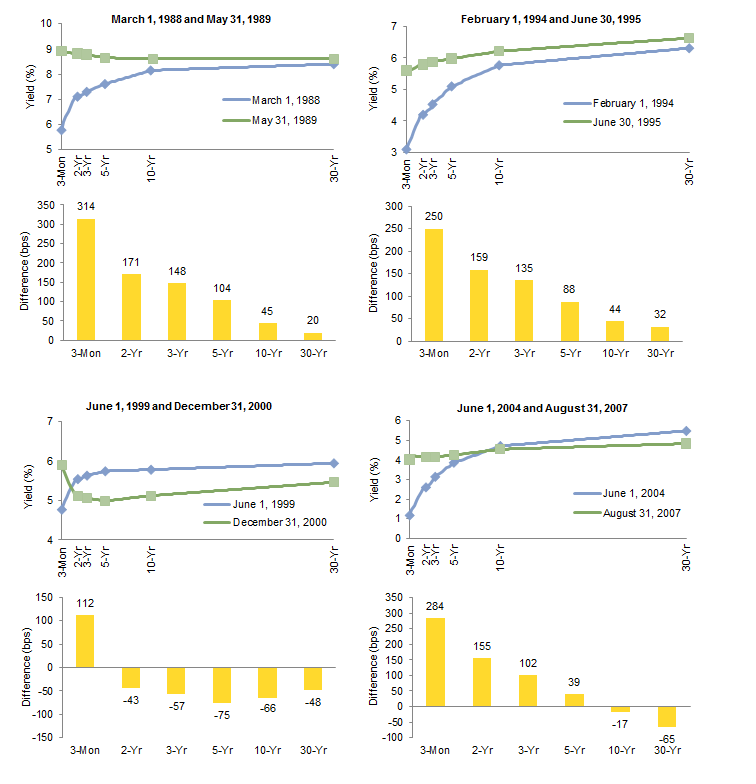
Figure 4. Beginning and Ending Yield Curve During Periods of Increasing Target Fed Funds Rate
As of September 30, 2015
Sources: Federal Reserve and Thomson Reuters Datastream.
How Yield Curve Twists Affect Returns
In the real world, yields change over time, and the “when and how” of these changes is typically just as important as the “how much.” Our analysis suggests that the timing of the rate adjustment matters a lot for returns—on a linear basis, a longer time horizon to get to a higher ending yield results in better returns. Similarly, the path that rates take is also important for returns—if the rise is not linear, a path in which rates rise sharply in the first years rather than in the later years results in better returns given coupon payments.
Consider a simple thought exercise. Today’s ten-year Treasury bond yields 2.06%; what might the implications be if the yield rose to the arbitrary level of 5.0%? With a duration of 9.1 years, a back-of-the-envelope calculation would imply a 27% drop in price (294 bp yield change * 9.1 duration = 26.7). A more precise calculation suggests the price drop should be 22.9% (duration is an approximation and becomes less accurate the larger the yield change). But such snap calculations ignore the effect of time and are of more theoretical than practical use—the yield is unlikely to rise 294 bps instantaneously.
Figure 5 shows the expected total returns of two-, five-, and ten-year US Treasury bonds given a variety of ending yields and time periods. The returns assume interest rates rise in a linear manner and are calculated using a constant-maturity model. Here the ten-year bond would be expected to return a cumulative -15% if a yield shift to 5.0% occurred over two years, to break even between the six- and seven-year mark, and to produce a 10.5% return if the shift took a decade.

Figure 5. Cumulative Returns for Two-, Five-, and Ten-Year Bonds Given Various Ending Yields and Different Lengths of Time to Reach Them
Sources: Cambridge Associates LLC, Federal Reserve, and Thomson Reuters Datastream
Key Yield Curve Concepts
Duration (“modified” duration) measures the price sensitivity of a bond relative to a small change in interest rates. For high-quality, non-callable securities, duration is directly linked to maturity; that is, bonds with longer maturities have longer durations, all else equal.[3]Duration is also a function of the level of interest rates and the size and timing of a bond’s coupons. Because longer-maturity bonds have longer durations, their prices are more sensitive to changes in interest rates. Conventional wisdom assumes that when interest rates rise or fall, the yields of bonds of different maturities will correspondingly “shift” in a parallel manner across the yield curve. If this were so, duration could easily be used to compute the expected returns of bonds of different maturities, given a specified change in interest rates. However, the yield curve is not static, but dynamic, and history indicates that it generally flattens or steepens (“twists”) when rates move to any significant extent. While parallel shifts dominate twists in general impact and frequency, in certain environments twists have had equal or greater impact on returns.
The shape and movement of the yield curve is often described by its relative steepness. Steepness is measured as the difference in yields between two different maturities along the curve. The differential between the two-year and ten-year bond (known as the 2s10s) is a common benchmark for this metric. The shape of the yield curve is typically considered “normal” when longer-maturity yields are higher than shorter-maturity yields. This is the state of the yield curve about 85% of the time. Occasionally, short-term yields exceed those of longer maturities, and the yield curve is said to be “inverted.”
In addition to a point in time snapshot of the curve’s shape (normal or inverted), changes or twists in the shape of the yield curve are referred to as either flattening or steepening. Starting with a “normal” yield curve shape, if short-term rates rise faster than long-term rates (or long rates fall faster than short rates), the curve is said to be flattening. If the opposite is true, the curve is steepening.[4]In some cases the term “butterfly” is used to describe a movement in the shape of the curve. Butterfly means that the curve steepens between some maturities while flattening between others. … Continue reading As short-term rate movements are more volatile than long rates, the curve typically steepens during falling rate environments and flattens in rising rate environments, regardless of the absolute level of yields. Our data on the 2s10s spread go back to 1976, and show nine periods when the Fed has raised its target rate by at least 100 bps (Figure 3). The curve flattened in seven of these nine periods, with short rates rising more than long rates by an average of 109 bps. The two periods when the curve steepened occurred during two months in 1981 and three months in 1982, when the target rate was raised from 15.5% to 19% and from 12% to 14%, respectively.
Despite investors’ worry about negative price returns related to rising rates, the coupon is what really drives returns. Historically, during rising rate environments, coupon payments for the Barclays US Treasury Bond Index have returned a 7.2% average annual compound return (AACR), whereas price returns have posted a -2.3% AACR. Likewise, in flat or falling rate environments, coupon payments have returned 6.8% annually, with price changes accounting for an additional 1.9% per year. With this in mind, we can demonstrate how the path of interest rates, and thus the amount and timing of coupon payments, affects returns. Using a similar methodology as that in Figure 5, Figure 6 shows three different rate-path scenarios playing out over a seven-year period. The “front-loaded” scenario assumes rates rise to their peak over the first two years and are then flat for the remaining five years. The “back-loaded” scenario assumes rates stay at their current level for the first five years before rising over the last two. As might be expected, the faster rates rise (front-loaded scenario), the better returns look due to the investor receiving higher coupons after the rate rise. Conversely, the investor in the back-loaded scenario receives predominantly low coupon payments, suffering the duration hit toward the end of the period.

Figure 6. Evaluating Three Different Rate Paths to 5%
Sources: Cambridge Associates LLC, Federal Reserve, and Thomson Reuters Datastream
Could Today Be Different?
While acknowledging the phrase “this time is different” is considered one of the most dangerous in finance, we nevertheless find ourselves pondering whether it might be. Yields across the curve are at very low levels relative to the last 50 years of history. Previous rising rate environments have all occurred with initial yields at higher levels than they are now (Figure 7), helping to mitigate the effects of rising rates on total returns. A linear 200 bp increase from the current ten-year yield (2.06%) over a three-year period would be expected to produce a total return of about -7%. However, given a starting yield of 6.0%, that same 200 bp increase would produce a positive return of nearly 7% (the ten-year yielded over 6% for nearly 90% of the 1970–2000 period). The fact that our historical analysis largely overlaps a period of high long rates certainly creates questions about its usefulness going forward.
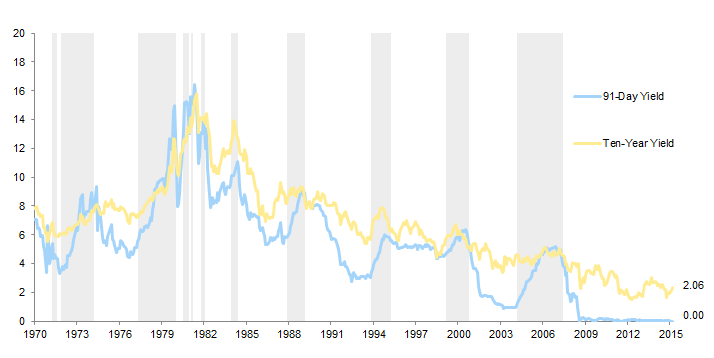
Figure 7. US 91-Day and Ten-Year Treasury Yields During Periods of Fed Tightening
April 30, 1970 – September 30, 2015 • Yield (%)
Sources: Federal Reserve and Thomson Reuters Datastream.
Figure 8 shows the break even path of rates for Treasury bonds of different maturities and time frames. On the short-end, two-year Treasuries can rise nearly 180 bps from their current yield of 0.64% to 2.43% over a two-year time horizon before losing money. Assuming a linear rise in rates, the two-year bond will always have a positive return over a three-year horizon or better, regardless of how high rates rise, as the increased coupon payments more than offset the price drops over time. Likewise, the ten-year Treasury can rise 54 bps to 2.60% over two years and still break even. And if the holding period is ten years or greater, the total return will be positive for any ending-rate scenario. On the long-end of the spectrum, if 30-year yields rise much above 5% over the next decade, these bonds will produce negative returns.

Figure 8. Break Even Interest Rate Ceiling at Current Yields for Various Treasury Maturities
As of September 30, 2015
Sources: Cambridge Associates LLC, Federal Reserve, and Thomson Reuters Datastream
Note: Total returns beyond the timeframe indicated by the dashed line are always positive regardless of ending interest rate level as higher coupon returns offset duration-related price declines.
Looking at forward rates, the market is currently expecting the curve to flatten substantially over the next three years, with the two-year yield rising from 0.6% to 1.9%, while the ten-year rises from 2.1% to about 3.6%. If these forward views turn out to be correct, our model estimates total returns in the low single digits for both bonds. Of course, the forward markets tend to have little predictive power, and return models are completely subject to the accuracy of the inputs and assumptions. Five years ago, forward markets predicted that ten-year yields would now be about 5%, more than twice their current level. Currently, forward markets see the ten-year yield reaching about 2.8% by mid-2020.
Despite current cash yields being effectively at zero, they benefit from the fact that they are almost guaranteed not to lose money (at least in nominal terms), and returns will only increase as rates rise. The tradeoff for this protection is that investors must give up the potential to earn several hundred basis points per year if rates stay about where they are. However, in the context of history, we have probably never been at a point where the potential return differential between cash and bonds has been so asymmetrical. As shown in Figure 9, holding all else equal, a bond’s duration increases as yields decrease.

Figure 9. Comparing Yield and Duration for 30-Year Treasuries
Sources: Cambridge Associates LLC, Federal Reserve, and Thomson Reuters Datastream
Note that the relationship is not one-to-one, but exponential. As yields continue to fall, duration builds at a faster pace. Relative to the beginning of the last rate-tightening cycle, the duration of long bonds is now about one-third greater while yields are nearly half what they were. The combination of lower yields and higher durations for a given maturity mean that bond investors face more potential downside risk than before. Of course, there is more potential upside as well should rates fall sharply, but as discussed previously there is less room for rates to fall at current yield levels (Figure 10).

Figure 10. Total Return of 30-Year Treasuries for a Given Yield Shift
As of September 30, 2015
Sources: Cambridge Associates LLC, Federal Reserve, and Thomson Reuters Datastream
Notes: Yield shifts assume a straight-line change over the given time horizon. The average 30-year yield from 1990 to 1999 is approximately 7.0%.
Since 1982, cash yields have averaged a 170 bp increase during rising rate cycles. However, in most of these cycles, cash yields began at levels substantially above zero, in sharp contrast to today. During the last rising rate cycle, when the Fed Funds rate started at 1.0%, cash yields rose over 400 bps to over 5%. Given their starting point of zero today, a similar type of increase would not be out of the question and is roughly in line with FOMC median expectations. Assuming a linear increase in yields over three years, this would provide investors an AACR of about 2%, not much different that the current yield earned on ten-year Treasuries.
So where does that leave investors? The historical record suggests that despite the widespread assumption that rising rate environments are bad for longer-duration portfolios, the reality has been more nuanced. All else being equal, longer duration portfolios will suffer more from instantaneous rate shocks (parallel upward shifts in the curve) than short duration portfolios. In actuality, the short end of the curve is more volatile, while long rates tend to remain more anchored. This, combined with long rates being high for much of the last 40 years, has largely offset the negative consequences of rising rates for investors.
However, with the ten-year now at 2.06% and the 30-year at 2.87%, investors have much less of a built-in buffer in the form of high coupons than in the past. Although long rates could compress further, their return upside is limited. From a historical perspective, the upside in a falling rate environment is comparable, but the downside in a rising rate environment is more severe (Figure 10). This certainly does not imply that cash or a short-duration portfolio will outperform a longer-duration portfolio over the foreseeable future, but investors should understand that their bond portfolios may not behave as expected given the unprecedented rate environment today.
Implications
For further discussion, see Sona Menon and Greg Meila, “Avoid the Agg Drag,” Cambridge Associates Research Note, June 2014.
Investors should remember the role bonds play in their portfolios. For institutions with defined benefit pension plans seeking to hedge liabilities, matching the duration to their liabilities is the best solution irrespective of bond yields. Since liabilities are typically long duration, long-duration bonds better match these liabilities by reducing the asset-liability mismatch, often a key risk in a defined benefit plan. In other words, risk can be reduced simply by extending duration and without having to increase the allocation to fixed income. If yields were to spike, the fixed income portfolio would fall in value; however, for most plans only a portion of the total portfolio is invested in fixed income, while the entire liability will fall in value, resulting in an improvement in funded status.
For other investors, the role of sovereign bonds is typically to provide protection in a flight-to-quality or deflationary-type environment during which risk assets suffer. Since 1972, the rolling two-year correlation between Treasuries and US equities is only 0.11, and Treasuries have held up well during periods of sharp equity declines (Figure 11).

Figure 11. Rolling Two-Year Returns for US Treasuries and US Equities
December 31, 1974 – September 30, 2015 • Total Return (%) • US Dollar
Sources: Barclays, Standard & Poor’s, and Thomson Reuters Datastream.
Today, such investors should consider the degree to which the protection Treasuries provide is worth the opportunity cost. Low yields translate to low returns, as the current yield to maturity is the primary driver of future bond performance for a buy and hold or constant maturity portfolio. Further, downside risk is elevated relative to the upside. The increased duration that comes with higher yields does allow for more capital appreciation for a given decline in yield, but yields can only fall so far. In contrast, upside yield movement (and capital losses) are not constrained by anything other than supply and demand. For these reasons, on and off since 2009, we have advised investors to hold part of their deflation hedge in cash when yields have been at or near very overvalued levels. We maintain this advice today. We would keep some sovereign bond exposure, given they retain some valuable diversification capacity, and would seek to increase exposures should yields increase to more fairly valued levels. For investors with large sovereign bond allocations that cannot accept the return drag of sovereign bonds and cash, we have recommended reducing such allocations to the minimum amount that would be needed in a stressed environment to meet spending and other liquidity needs. The remainder of the sovereign bond allocation can be put to work in diversifying hedge funds with relatively low equity and credit exposure. However, we would be careful not to increase the total portfolio equity and credit exposure today beyond neutral levels.
What to do with the portion of the allocation that remains in sovereign bonds? Even with perfect foresight as to the direction of interest rates, investors would also have to predict how the yield curve might twist in response to a shift in Fed policy toward higher rates. Put differently, shortening duration only decreases interest rate exposure in a rising rate environment if the yield curve makes a parallel shift. If the yield curve twists, with short rates rising more than long rates, investors that shorten duration to reduce interest rate risk could see their short-duration portfolios underperform. On balance, we continue to prefer a combination of intermediate- to long-duration Treasuries and cash rather than just shortening Treasury duration.
Monetary policy decisions since the global financial crisis have had impacts across asset classes, and bonds are no exception. Investors should bear in mind the difficulties inherent in trying to time such decisions and think twice, then think again, before modifying their bond exposures solely based on what they think interest rates might do. Bonds’ asymmetric risk/return profile at current yields is of more concern to us, and leads us to advise continuing to hold a portion of the allocation in cash.
Celia Dallas, Chief Investment Strategist
Tim Hope, Manager, Analytics
Joe Comras, Investment Associate
Footnotes