Preface
In our 2017 outlook, we were cautiously optimistic, and the year turned into quite the feast for investors, with developed and emerging markets equities posting double-digit returns in nearly all major currencies. Looking ahead, while we would be the first to concede that the rally in some assets has eaten into tomorrow’s gains and intermediate returns may lag from here, at this point it is too early to leave the party and we recommend that investors stick around for dessert.
A variety of dynamics influence our constructive view, many of which are simply a continuation of themes from 2017. Global growth has synchronized and strengthened, central banks haven’t yet taken away the punch bowl, political risks have diminished in several markets, and some countries look set to relax fiscal policy. Hopes are particularly high for US tax reform, and shifting political realities in some Eurozone countries could mean governments loosen the purse strings.
In the pages ahead, we review how these dynamics could affect key assets in investors’ portfolios, including developed and emerging markets equities, sovereign bonds, credits, real assets, and currencies. Heading into 2018, we remain constructive on developed ex US and emerging markets equities, while keeping a wary eye on US stocks, where stretched valuations mean future returns will likely not keep pace with those of the past. In fixed income markets, 2018 looks to offer more of the same, though as some central banks pull back their purchases, high-quality bonds may be in greater supply and we don’t recommend taking long duration bets. Most liquid credit assets are not priced to generate significant gains, yet a rising economic tide could keep defaults low and allow investors to clip coupons, creating a supportive environment for structured credit. Among real assets, with growing levels of free cash flow, better balance sheet positions, and undemanding valuations, natural resources equities and energy MLPs are on firmer ground relative to the start of 2017.
Thus, as 2017 comes to a close, we are again cautiously optimistic for the year ahead. However, the fact that the consensus cites so few risks on the horizon worries the contrarian in us, and with markets very complacent, it may not take much to see volatility pick up. The situations in North Korea and the Middle East are known risks—increasing geopolitical tensions could see investors start to depart the party. Still, given the unpredictability of political events and lack of attractive alternatives, we continue to advise investors to hold neutral equity allocations, remain careful with bonds, and look for upside in more niche, often private, strategies.
Published December 7, 2017
Executive Summary
- Developed markets equities have the potential to deliver a second straight year of healthy returns in 2018 based on a still-supportive macroeconomic backdrop, decent earnings growth prospects, and reasonable starting valuations (outside the United States). Among major developed regions, Eurozone and Japanese stocks seem to offer the best prospects as their earlier stage economic recoveries now appear sustainable, policy remains more supportive, and valuations are still undemanding. By comparison, US stocks are quite expensive, making their upside potential more dependent on further earnings growth. Better performance through the cycle means the US earnings bar is higher, but US tax policy is an important wildcard in the near term. UK stocks have the least promising outlook, given ongoing headwinds to sentiment from Brexit, and an unfavorable sector composition in the current reflationary environment. However, the uncertain environment and bearish investor positioning arguably mean UK valuations already reflect rather dire scenarios.
- Several factors that supported strong emerging markets equity returns in 2017—including decelerating debt growth, constrained inflation, stable currencies, and dovish monetary policy—seem poised to continue in 2018. Earnings remain below prior cyclical highs and may have further room to run as well. However, earnings, and recent share-price gains, are now heavily concentrated in pricey technology stocks. Investors should consider whether any explicit or residual style biases within their emerging markets allocation might lessen or increase this concentration in fast-growing but expensive technology shares. While emerging markets are ebullient, and could well be primed for a pullback in the coming year if optimism regarding earnings growth fades or if risk aversion (or the US dollar) rises, the potential catalysts for such a pullback are not in view today.
- Investors need to be patient when investing in credit in 2018 given the current paucity of attractive choices. This said, a rising macro tide may continue to limit downside risk, even if weakening investor protections and excessive inflows are setting the stage for intermediate-term disappointment. Given the combination of stable fundamentals and the availability of cheap finance, we are constructive on higher-carry structured credit and select lock-up opportunities including real estate credit focused funds and capital appreciation funds. Should dispersion across credits increase, long/short credit funds could also be of interest, though rising equity markets could mean returns might continue to trail those in other hedge fund categories.
- In 2018, investors should focus on natural resources equities and energy MLPs among public real asset investment options. These resource-focused companies—in contrast to richly priced US REITs and structurally challenged commodity futures—are best positioned to continue to grow free cash flow, aided by continued global economic growth and tightening in oil supply/demand fundamentals. With higher levels of free cash flow, these companies would be better able to strengthen balance sheets and return capital to investors. In short, we see resource-focused companies at current prices as having more upside potential than downside risk.
- Sovereign bond investors have experienced unexciting returns in 2017 and 2018 looks to offer more of the same. Labor-market tightness in many countries and rising commodity prices raise the risk that price pressures might eventually overshoot the diminished expectations of central bankers and bondholders. Should investors perceive that central bank posture is becoming less dovish (or should inflation dynamics eventually indicate that it should become less dovish), today’s bond indexes, with their long durations, would suffer. While US Treasuries moved into what we consider to be fairly valued territory in October, sovereign bonds in other developed markets generally remain overvalued (and in some cases very overvalued), and investors should consider holding some cash in lieu of these richly valued sovereign bonds.
- Currency markets may be range bound in 2018 as the outlook for global monetary policy becomes more complicated, with global central banks beginning to tighten policy to different degrees. Even as we see increased odds for a US dollar rebound in 2018, the strong-dollar cycle is clearly near its end. The current cycle has reached the duration of the past two cycles (i.e., more than six years), and although it has not yet seen the same magnitude of USD strength, the dollar is overvalued versus most currencies. On a basket basis versus developed markets currencies, the US dollar is at real exchange rate levels that historically have resulted in weakness on a multi-year horizon. As a result, we expect the dollar to weaken over the intermediate term, although this may not occur until after the next US recession.
- Looking across the landscape, while conditions remain supportive of a risk-on environment in 2018, investors should not be complacent about downside risks, as positive conditions cannot last forever. For the time being, investors are still being compensated for taking risk and, as a result, we remain neutral on risky assets. Investors should seek to determine how much risk they are taking in portfolios relative to neutral risk allocations and adjust positioning accordingly. Diversification and adequate liquidity remain key to managing portfolios through the cycle.
Developed Markets Equities: US Stocks to Pass the Cake
Michael Salerno, Senior Investment Director
The outlook for developed markets equities in 2018 is bright given the synchronizing global economic expansion, still-benign inflation dynamics, largely accommodative major central banks, and reasonable valuations (outside the United States). Among the major developed regions, the combination of attractive relative valuations and more nascent economic recoveries increasingly favors non-US markets over US stocks, though the latter could still surprise on the upside if substantial corporate tax reform passes. Regardless of the ultimate leaders and laggards, prospects for developed equities overall remain quite healthy heading into 2018. However, 2017’s results will be difficult to top and, given the strong and broad-based rally since the February 2016 lows amid record low volatility, the chance of a short-term correction in the coming months cannot be ruled out.
2017 in Brief
Developed markets equities have enjoyed strong gains in 2017 (17.2% for MSCI World through November 30 in local currency terms). All regions saw earnings recover from the oil- and China-related industrial mini-recession of 2015–16, as economic growth accelerated and commodity prices rebounded. Globally, equities also continued to benefit from economic policy support, as weaker-than-expected inflation allowed the major central banks to remain largely accommodative and kept G7 sovereign bond yields not far above all-time lows. US equities (19.9%) had another strong year, despite having by far the richest valuations, although US dollar weakness meant developed ex US equities outperformed US equivalents in common currency terms. The US market’s outsized exposure to information technology, on track to be 2017’s best-performing sector globally, was an important driver. Japanese (18.1%) and Eurozone (13.6%) stocks bounced back from a disappointing 2016 as economic data exceeded expectations, earnings growth remained strong, and political risks (particularly in Europe) subsided. In contrast, UK equities (6.4%) went from 2016’s leader to 2017’s laggard, with recent performance weighed down by high relative exposure to underperforming energy stocks, very little exposure to the high-flying IT sector, and a clouded outlook for domestic-facing sectors given Brexit uncertainty.
Some reflation trades that closed out 2016 continued in 2017. Through November 30, cyclical sectors have generally outperformed—led by information technology, materials, and industrials—while defensive “bond proxy” sectors have mostly lagged. Other reflation trades faded as the heavily value-tilted energy and financial sectors underperformed after leading the value stock rebound in 2016. Growth stocks roared back to resume market leadership in 2017, along with stocks exhibiting momentum and quality. Small caps outperformed in Europe and Japan, where domestic-facing, smaller companies stand to benefit more than large-cap multinationals from the recoveries taking shape in those economies, but underperformed in the United States, where extreme valuations for small caps and tax reform delays may have played a role.
For the first time in several years, consensus earnings estimates were not subject to meaningful downgrades as 2017 progressed, with the latest estimates still suggesting double-digit fiscal year EPS growth across the major regions. Profit margins have been rising along with better top-line growth, driven by the synchronized global expansion currently playing out. Yet, the extent to which margins and earnings can continue expanding varies significantly by region. Profit margins and earnings in Japan and the United States are at or near all-time highs, whereas European margins remain depressed relative to history, with earnings still sitting far below their pre-crisis peaks (Figure 1). Trailing real EPS of UK and Eurozone equities are 55% and 40% below 2008 highs, respectively. While the retrenchment of the European banking sector since the financial crisis has certainly weighed on the region’s earnings recovery and may reflect a permanent structural hit, non-financial earnings also remain well below pre-crisis peaks, suggesting the greatest room for improvement still lies in Europe, irrespective of prospects for European banks.
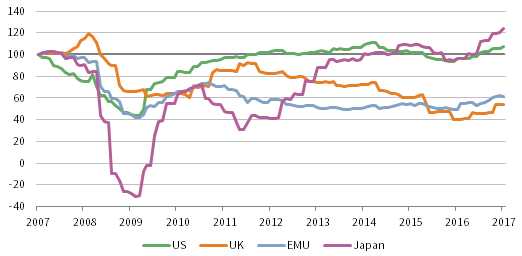
FIGURE 1 CUMULATIVE WEALTH OF REAL EARNINGS PER SHARE BY REGION
November 30, 2007 – November 30, 2017 • November 30, 2007 = 100 • Local Currency
Sources: MSCI Inc. and Thomson Reuters Datastream. MSCI data provided “as is” without any express or implied warranties.
Notes: Cumulative wealth is based on trailing 12-month EPS, adjusted by each country or region’s official consumer price index. Data are monthly.
Looking Ahead to 2018
Developed markets equities posted their sixth consecutive year of positive total returns in 2017; this impressive run is not without precedent, though the analogues give some reason for pause. From 1978 through 1989, developed markets equities notched 12 straight years of gains, nine of which involved double-digit returns. However, this period coincided with the Japanese equity bubble, during which Japan became an outsized component of the global index, and, beginning in 1990, developed markets stocks were down three of the next five years. For the US stock market, 2017’s performance represented the ninth consecutive annual gain following the 2008 crash, matching the duration of the nine-year long run-up to the dot-com bubble; the subsequent crash dragged global equities lower for three straight years. While these comparisons are a reminder of how bull markets end and that the current cycle is getting long in the tooth, we subscribe to the adage that equity bull market cycles do not die of old age alone.
A healthy earnings outlook should support developed markets equities in 2018. Most (if not all) sectors in each of the major regions are estimated to grow EPS in 2018 (Figure 2), the second straight year that earnings growth expectations have been broad-based from a sector standpoint. Still, the rate of earnings growth may be tapering off, with only the United States expected to continue growing earnings at a double-digit pace, with additional upside potential if tax reform gets passed. For other regions, the flipside of having a higher earnings base is that the bar for beating analyst expectations is lower for 2018 than it was for 2017; for example, the United Kingdom is expected to see a fairly modest 6% increase. Consensus estimates for 2018 for the major regions also rely on large contributions from two sectors whose earnings have struggled in recent years, suggesting a potential source of disappointment if growth assumptions don’t play out. Financials in particular are expected to provide outsized contributions to earnings growth in the Eurozone, United Kingdom, and United States in 2018 (Figure 2), reflecting an assumption that banking recoveries from the global financial crisis will continue, as well as some regulatory relief in the United States. Similarly, based on forecasts for stable to moderately higher average oil prices in 2018, the energy sector is currently expected to be a large contributor to UK and US earnings growth.
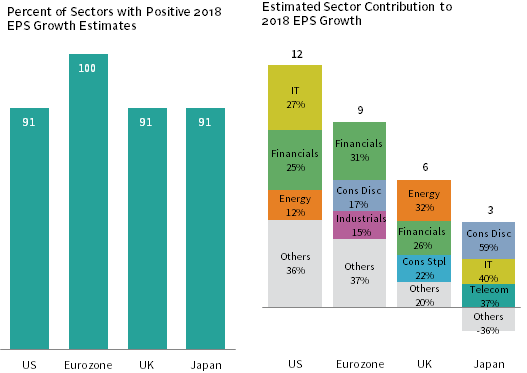
FIGURE 2 2018 EPS GROWTH
As of November 30, 2017 • Percent (%)
Sources: I/B/E/S, MSCI Inc., and Thomson Reuters Datastream. MSCI data provided “as is” without any express or implied warranties.
Notes: Data labels on right chart reflect the percentage of headline earnings growth each sector is estimated to contribute. Data for Japan represent the fiscal year ending March 31 of the subsequent year. The negative contribution to Japan’s 2018 EPS growth estimate is entirely due to a -11.7% expected growth rate for one sector, Industrials, the largest in the index on both a market cap and an earnings-weighted basis.
Valuations across developed markets ticked up in 2017 as a result of the broad-based global equity rally. Developed markets equities in aggregate became overvalued, largely driven by US valuations reaching levels not seen since the run up to (and fall out from) the dot-com crash. In contrast, valuations for the major developed markets regions outside the United States remain fairly valued in absolute terms, and relative valuations versus US equities have rarely been more attractive (Figure 3). We must caveat that starting valuations—whether in absolute or relative terms—have shown little relationship historically with subsequent performance on a one-year horizon, and therefore valuations alone provide no indication whether non-US developed equities will outperform in 2018. Still, the wide disparity between US and developed ex US equity valuations heading into 2018 would seem to favor the latter over the former when considering longer horizons.
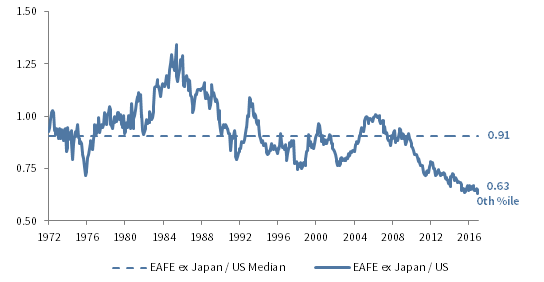
FIGURE 3 RELATIVE COMPOSITE NORMALIZED P/E RATIOS
December 31, 1972 – November 30, 2017
Sources: MSCI Inc. and Thomson Reuters Datastream. MSCI data provided “as is” without any express or implied warranties.
Note: Data are monthly.
US Outlook. The outlook for US equities is constructive, although it largely hinges on whether they can deliver on robust earnings growth expectations given how far valuations have already risen. US profits and equity prices in 2018 should be supported by above-potential economic growth both in the United States and abroad, stable oil prices, and a weaker US dollar relative to one year ago. US earnings growth expectations for 2018 also significantly rest on the continued dominance of the IT sector, as well as financials’ ongoing post-crisis recovery; these two sectors alone are expected to contribute roughly half of the market’s EPS growth in 2018. US profit margins are back near records, indicating limited capacity to rise further from current levels, so continued healthy top-line growth will be required for the recent earnings expansion to be sustained.
As they did in 2017, earnings results for a small group of mega-cap technology stocks—the so-called FAAMGs (Facebook, Apple, Amazon, Microsoft, and Google)—will also help determine if the US market can deliver the strong growth its valuations promise. The key question is whether fundamentals for these stocks, which are forecast to continue commanding net profit margins nearly twice the rest of the market and generate mid-teens sales growth, are sustainable.
Corporate tax reform is an important wildcard, given expectations that tax cuts could boost EPS by 5%–8% in 2018. Some of this potential positive impact appears already priced in, reducing the upside for US stock prices if a tax reform package similar to current congressional proposals gets approved, and creating downside risks if the ultimate bill disappoints or if congressional negotiations break down altogether. How Congress’s tax reform effort progresses could go a long way toward deciding whether US equities outperform again in 2018.
Eurozone Outlook. Eurozone stocks should continue to benefit in 2018 from the region’s now broad-based and thus self-reinforcing economic recovery, as well as from reflationary trends abroad. The ECB’s substantial monetary stimulus has helped generate growth, keep the euro competitive, stabilize inflation, and support financial asset prices. At least thus far, the market seems to be buying the ECB’s “dovish taper” in October, when it announced a reduction in asset purchases starting in early 2018, but provided reassurance that policy will remain accommodative throughout the year. Though important structural issues remain, authorities have taken some steps to safeguard the system, including recent progress cleaning up some of the region’s weakest banks. Eurozone equities should also be supported by rising earnings and by valuations that remain reasonable on an absolute basis and attractive relative to US equities. Political risks represent the main potential obstacle for Eurozone equities and—though these have been diminished given 2017’s election results and 2018’s lighter electoral calendar—could weigh on sentiment again given the recent breakdown in coalition talks to form a majority government in Germany, the upcoming elections in Italy, and the ongoing secessionist push in Spain’s Catalonia region.
UK Outlook. Prospects for UK equities seem less bright in 2018. Brexit negotiations could continue to weigh on confidence, and sterling weakness could lead to further import-led inflation, hurting consumption and profit margins. While the foreign orientation of the UK market makes it appear well placed to benefit from accelerating global growth and an undervalued currency, the sector composition of its offshore revenues could partially negate the benefits. With exposure primarily to companies in energy, materials, staples, and health care, the market is somewhat tilted toward commodity and emerging markets demand, which could face headwinds if the strong US dollar cycle resumes. UK multinationals would also be vulnerable to a reflationary uplift in bond yields given the above average dividend yields offered by these stocks. Reflecting these challenges, UK stocks feature attractive relative valuations and undemanding earnings expectations, offering some ballast if markets turn down. A best case scenario might include progress on the UK’s negotiations with the European Union as well as stable commodity prices, benign global inflation, and low bond yields.
Japan Outlook. Japanese equities could be poised to sustain their recent positive momentum heading into 2018 as the recent election result ensures a continuation of the Abe government’s reform program, which is slowly yielding results. Inflation remains well below target but has begun showing signs of a very gradual pickup, reducing deflationary fears. Meanwhile, Japan’s economy is undergoing its most positive stretch since the global financial crisis, helping earnings grow at a double-digit pace for four straight quarters. Previous cost rationalization and accelerating global growth mean that Japanese companies’ high operating leverage is kicking in, helping rising sales drop straight to the bottom line.
The BOJ is expected to remain highly accommodative, supporting stocks. Yield targeting should help keep the yen competitive and boost corporate profits, including for banks if ultra-long yields begin to rise, while domestic equity ETF purchases will continue to provide a steady bid for Japanese shares.
Corporate governance reform remains a key objective for the Abe government and, despite buyback momentum stalling in 2017, a renewed push for shareholder payouts given record-high corporate cash piles could also help drive returns. Excessive corporate war chests were an important election issue and though a tax on corporate cash holdings remains unlikely, increased moral suasion by the government could pressure Japanese companies to do something more productive with their balance sheets.
Japanese equity valuations remain undemanding. While Japan has become a consensus overweight among Wall Street strategists and the election has encouraged foreign investors to increase their exposure in recent weeks, investor positioning toward Japanese equities is by no means stretched based on longer-term trends. All in all, the outlook for Japanese stocks appears bright.
Summary
Developed markets equities have the potential to deliver a second straight year of healthy returns in 2018 based on a still-supportive macroeconomic backdrop, decent earnings growth prospects, and reasonable starting valuations (outside the United States). Among major developed regions, Eurozone and Japanese stocks seem to offer the best prospects as their earlier stage economic recoveries now appear sustainable, policy remains more supportive, and valuations are still undemanding. By comparison, US stocks are quite expensive, making their upside potential more dependent on further earnings growth. Better performance through the cycle means the US earnings bar is higher, but US tax policy is an important wildcard in the near term. UK stocks have the least promising outlook, given ongoing headwinds to sentiment from Brexit, and an unfavorable sector composition in the current reflationary environment. However, the uncertain environment and bearish investor positioning arguably mean UK valuations already reflect rather dire scenarios.
Emerging Markets Equities: Positioned for Another Productive Year
Sean McLaughlin, Managing Director
Emerging markets equities have returned more than 30% in USD terms in 2017 through November 30, boosted by a combination of an improving macroeconomic environment, reasonable valuations, and encouraging earnings results and expectations. Investors wondering whether this is too much, too fast should take some comfort from the fact that some of 2017’s performance marks a reversal of previous weakness, and that a catalyst for a pullback of shares is not immediately obvious.[1]Of course, negative catalysts don’t always announce themselves in advance! Notably, emerging markets earnings and returns are increasingly being driven by a small number of Asian technology firms, which may challenge returns if tailwinds for the sector fade.
2017 in Brief
Following some market volatility after the November 2016 US election, emerging markets shares went on an extended escalator ride for most of 2017. Reasonable starting valuations supported returns that, while high, were not entirely unusual. Since 1988, calendar year returns for the MSCI Emerging Markets Index in USD terms have topped 30% more than one-third of the time. More noteworthy was the market calm that persisted for most of the year, helped in part by consistent upgrades to earnings and growth forecasts. In 2017, emerging markets stocks fell more than 2% in USD terms on only one day (compared to nine days in 2016), and fell more than 1% on just 3% of days (compared to 13% of days in 2016). And this was in a year that rarely lacked for political troubles, yet even countries faced with strife and scandal delivered double-digit returns.[2]Consider Brazil, with a president who has survived two rounds of corruption charges (his predecessor was impeached in 2016); South Africa, where the backroom influence of a wealthy family on the … Continue reading Why? Perhaps investors didn’t much differentiate across countries, given low overall volatility and broad optimism about GDP and earnings growth.
Tech giants drove the market higher, meaning investors without substantial allocations to these stocks may have failed to keep pace. While a dart thrower’s emerging markets portfolio would have done well in 2017 in absolute terms, it would have certainly underperformed: the cap-weighted index has so far bested its equal-weighted cousin by more than 8 ppts. Emerging markets investors tilting toward value also struggled, but growth and momentum strategies delivered exceptional returns.
Looking Ahead to 2018
Emerging markets equities seem positioned for another productive year. Whether this actually occurs depends on the continuation of a handful of promising trends, favorable policy developments, and uninterrupted economic expansion in both emerging markets and in key developed markets such as the United States.
Fair Macro Winds Blowing. Several macroeconomic developments soothed investor concerns in 2017 (Figure 4), and these could remain supportive for risk assets into 2018. Six countries account for 80% of the MSCI Emerging Market Index’s market capitalization, and debt growth decelerated across all of them in 2017. After the combined debt of non-financial corporations and governments within emerging markets climbed rapidly over the past five years, from 115% of GDP in 2011 to 147% of GDP at the end of 2016, that level was essentially flat over 2017. One reason is that China’s government has gradually pushed to limit the pace of credit growth, both via regulatory means and by increasing short-term borrowing rates that some financial firms use to fund their own lending activities. Most of the six largest component countries of the MSCI Emerging Markets Index had modest increases in debt over the past year, well below the 4.6% growth rate over the past five years.[3]Household debt, not included in these statistics, grew from 34% of GDP to 36% over the past year (it was 27% in 2012).
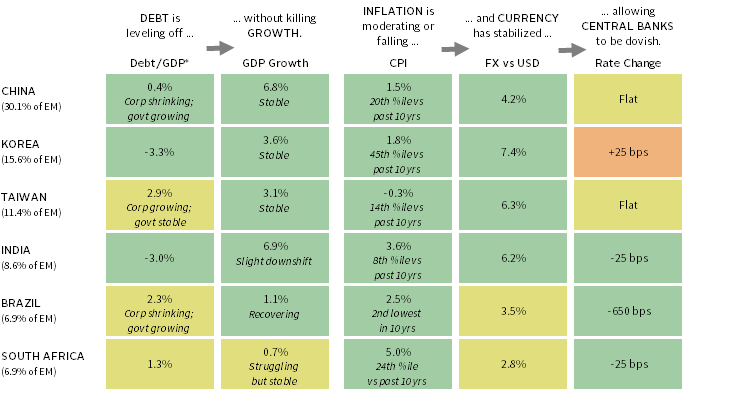
FIGURE 4 MACROECONOMIC CONDITIONS FOR SELECTED EMERGING MARKETS COUNTRIES
As of November 30, 2017
Sources: Bank for International Settlements, Institute of International Finance, International Monetary Fund, MSCI Inc., National Sources, Oxford Economics, and Thomson Reuters Datastream. MSCI data provided “as is” without any express or implied warranties.
Notes: All data represent year-over-year trend. Debt/GDP data as of second quarter 2017. GDP growth data as of third quarter 2017. Consumer Price Index (CPI) data as of October 31, 2017, except for Brazil, China, and South Africa, which are as of September 30, 2017. Currency and policy rate data as of November 30, 2017, except for Taiwan policy rate, which is as of October 31, 2017.
* Refers to the sum of non-financial corporate debt and government debt.
Measured Chinese tightening and other efforts to limit debt growth might have been expected to rein in economic growth, but the impact seems to have been moderate. GDP growth is stable or recovering in major emerging markets. At the same time, low inflation and (related to that) stable currencies are enabling many emerging markets central banks to keep the punch bowls on the table. Of the six largest index constituents, year-over-year inflation topped 3% in only two constituents, and most have seen their currencies appreciate in real terms versus the US dollar. Given this freedom, the central banks of the largest emerging equity markets (China, Korea, and Taiwan) have held policy rates steady, while Brazil, India, and South Africa have implemented rate cuts.
The macro environment within emerging markets appears favorable, though US developments remain critical to watch. US trade policy has been under a microscope since the presidential election, and any moves that impact the competitiveness of goods imported into the United States could present a significant risk to emerging markets that produce goods for US consumption, including China, Korea, and Mexico. Additional risk could come from any change to the actual or perceived future pace of Federal Reserve policy tightening. Currently, market participants are expecting the Fed Funds rate to end 2018 at 1.50% to 1.75%, while the Fed’s economists have the rate at 2.125%. If market expectations begin baking in a more aggressive pace of hikes, that could goose the US dollar and negatively impact emerging markets shares and currencies.
Earnings Chugging Along. As commodity prices crashed and Chinese growth slowed in the early years of this decade, real EPS for emerging markets tumbled, falling an inflation-adjusted 27% from their 2011 peak levels before bottoming. Despite the expected 22% rebound in 2017, EPS remains below peak levels. Meanwhile, ROE stands at 11.5%, in line with average profitability over the past two decades but well below the peak of 17% seen before the global financial crisis. Given that EPS and ROE remain well below prior peak levels, the earnings cycle may have further room to run; analysts currently estimate that earnings will grow another 12% for 2018.
Tech Concentration Bears Monitoring. Historically, emerging markets indexes have been dominated by the financial sector. Financials have contributed one-third of the MSCI Emerging Markets Index’s net income since inception and have always had the largest weight, with a median index allocation of 22% over time. However, powered by recent returns, the IT sector has now surpassed financials, with a whopping 28.3% weight as of November 30, versus 25.9% for financials.[4]In September 2016, real estate, which had previously been a subsector of financials, became its own sector in the Global Industry Classification Standard (GICS). For purposes of this comparison and … Continue reading
Tech stocks drove the MSCI Emerging Markets Index in 2017, contributing 40% of the index’s total return (Figure 5). In fact, for the MSCI All Country World Index, which combines developed and emerging markets stocks, four of the top ten contributors to the year-to-date return are emerging markets technology stocks (Tencent, Alibaba, Samsung, and Taiwan Semiconductor), even though none of the four is a top ten constituent by weight in the index. The tech sector was the biggest driver of earnings growth for the MSCI Emerging Markets Index in 2017 (Figure 5) and is expected to be so again in 2018, contributing more than one-third of expected earnings growth for the index. Two other sectors expected to significantly contribute to 2018 earnings growth are consumer discretionary and heavily weighted but somewhat sluggish financials.

FIGURE 5 SECTOR CONTRIBUTIONS TO 2017 EPS GROWTH AND TOTAL RETURNS
As of November 30, 2017 • Percent (%)
Sources: FactSet Research Systems, I/B/E/S, MSCI Inc., and Thomson Reuters Datastream. MSCI data provided “as is” without any express or implied warranties.
Notes: Financials include real estate sector. Consumer category includes consumer discretionary, consumer staples, and health care sectors. EPS growth data are in USD terms. Total return data for all MSCI indexes are in USD and net of dividend taxes. Labels indicate the sector’s percent contribution to EPS growth/total return.
However, what technology stocks giveth to emerging markets in 2017, they could taketh away in 2018. The five largest tech stocks (which account for about two-thirds of the sector’s total market capitalization) trade at a rich capitalization-weighted P/E ratio of 35.6. These valuations make sense provided technology firms continue to grow at a rapid pace (the analyst expectation for 2018 for emerging markets technology shares is 17.8% EPS growth). However, if revenue growth stalls or if prospects for the sector dim even moderately, today’s elevated P/E ratios offer little cushion, and given these stocks’ outsized weighting in the MSCI Emerging Markets Index, they could drag the broad index with them.
Valuations Still Look Reasonable. Valuations for the MSCI Emerging Markets Index have richened since the deep discounts that prevailed in early 2016 but remain reasonable, with an ROE-adjusted P/E ratio of 15.2 as of November 30, just 6.3% above the historical median and firmly in our fairly valued range (Figure 6).

FIGURE 6 VALUATION OF EM EQUITIES AND OF THEIR ASSOCIATED CURRENCIES
January 31, 1994 – November 30, 2017 • Percent Deviation from Median (%)
Sources: MSCI Inc. and Thomson Reuters Datastream. MSCI data provided “as is” without any express or implied warranties.
Notes: The five-year CAPE is calculated for each country in the MSCI Emerging Markets Index today and then combined at today’s weights to create a historical valuation series. Valuation for emerging markets currencies uses the same countries and weights as in this EM equity basket.
Since the country composition of the MSCI Emerging Markets Index has changed radically over time, adjusting historical valuations for today’s country mix offers a way to double-check today’s value proposition. We calculate a five-year CAPE for each country in the MSCI Emerging Markets Index today and then combine these metrics at today’s weights to create a historical valuation series that may be a better reflection of the current opportunity set. The CAPE of that frozen basket of countries is 16.6, just 6.4% above the historical median, confirming our fairly valued call (Figure 6).
A different consideration for some investors is the vulnerability of the underlying currencies in which these equities are priced. Because hedging emerging markets currencies is generally costly, most investors take the currency risk when owning the equities. Looking at the deviation from historical median for the currencies underlying today’s emerging markets equity basket, emerging markets currencies are fairly valued compared to the US dollar (Figure 6).[5]China is not included, because the stocks in the MSCI China Index are priced in Hong Kong dollars, a currency that is closely managed versus the US dollar. Does fair valuation for emerging markets currencies guarantee that they will hold their own versus the US dollar and other developed markets currencies? Certainly not: rising risk aversion, tough talk on trade, or an increase in the pace of developed markets central bank tightening could trigger currency sell-offs. But fairly valued currencies are less vulnerable than rich currencies.
Summary
Emerging markets equities have delivered very strong returns in 2017, as investors were drawn to the shares by cheap valuations, rising earnings, and strong global growth. Several factors that supported returns in 2017—including decelerating debt growth, constrained inflation, stable currencies, and dovish monetary policy—seem poised to continue. Valuation doesn’t reliably tip the scales on a one-year horizon, but for investors wondering about longer-term prospects, equity valuations are solidly in fair value, as are the valuations of the currencies in which those shares are priced.
Earnings remain below prior cyclical highs and may have further room to run as well. However, earnings, and recent share-price gains, are now heavily concentrated in pricey technology stocks. Investors should consider whether any explicit or residual style biases within their emerging markets allocation might lessen or increase this concentration in fast-growing but expensive technology shares. Investors with a value tilt likely have little exposure as the MSCI Emerging Markets Value Index, for example, has only 19% in tech versus a 43% allocation in the growth index.
Emerging (and developed) markets are ebullient, and could well be primed for a pullback in the coming year if optimism regarding earnings growth fades or if risk aversion (or the US dollar) rises; however, the potential catalysts for such a pullback are not in view today.
Credit: Time to Be Selective
Wade O’Brien, Managing Director
Investors will likely look back on 2017 as a fine vintage for credit, with rarer varietals like structured credit and bank subordinated debt outshining more mass market options like high-yield bonds and leveraged loans. A variety of forces coalesced to support returns, including an improving economic backdrop, recovering corporate fundamentals, and accommodating central banks that left base rates low and pushed investors to search for yield. Looking ahead to 2018, few headwinds to fundamentals appear on the horizon; if anything, prospects may be tilted to the upside given the possibility for corporate tax cuts in the United States and stronger economic growth in other markets. The problem is the magnitude of the upside: low yields across many strategies are likely to cap subsequent returns. To generate the highest returns investors will need to (again) be adventurous and investigate less-picked-over strategies in private and structured credit, while at the same time keeping a close eye on market technicals like the amount of capital being raised across strategies.
2017 in Brief
In what was a generally strong year for the credit markets, returns varied across strategies (Figure 7). Some liquid assets including US high-yield bonds and leveraged loans failed to keep pace with 2016’s returns while less liquid instruments like sub-investment-grade CLO paper and European bank capital securities posted equity-like returns. Looking back at our credit outlook from 12 months ago, we correctly identified the potential for higher-beta and more esoteric credit to outperform, but underestimated the potential magnitude.

FIGURE 7 DEBT MARKETS BY YIELD, PERFORMANCE, AND MARKET VALUE
As of November 30, 2017
Sources: Barclays, Bloomberg L.P., Credit Suisse, and J.P. Morgan Securities, Inc.
Notes: The area of each bubble represents the current market value of each index, shown in USD billions. Global Bank Capital are represented by the Bloomberg Barclays Global Contingent Capital Index, CLO BBB by the J.P. Morgan CLOIE BBB Index, US CMBS BBB by the Bloomberg Barclays US CMBS Baa Index, US Corp IG by the Bloomberg Barclays US Corporate Investment Grade Index, EM Sovereign Debt by the J.P. Morgan EMBI Global Diversified Index, European HY by the Bloomberg Barclays Pan-European High Yield Index, Leveraged Loans by the Credit Suisse Leveraged Loan Index, US Corp HY by the Bloomberg Barclays US Corporate High Yield Index, and US Treasuries by the Bloomberg Barclays US Treasury Intermediate Index.
The macro backdrop in 2017 was supportive for credit in several respects. Low benchmark rates across the globe boosted demand for higher-yielding bonds, while recovering economic growth translated into better corporate fundamentals. Balance sheet health improved in many categories. The leverage ratio for US high-yield borrowers fell steadily over the course of 2017 and stood around 4.5 at the end of September, well below the roughly 7.0 ratio seen in early 2016 as the commodity sell-off caused profits to plunge for energy and materials firms (Figure 8). Similar drivers were behind the declining default rate for high-yield bonds, which fell over 200 bps in 2017 to just 1.2% at the end of October (Figure 8), roughly half its historical average, and nearly identical to the rate on leveraged loans. Investment-grade bonds were an exception to generally improving fundamentals, as leverage ratios and interest coverage for higher-quality US companies were slightly deteriorating as 2017 came to a close.

FIGURE 8 US HIGH-YIELD LEVERAGE RATIOS AND DEFAULT RATES
March 31, 1998 – October 31, 2017
Sources: BofA Merrill Lynch and Moody’s Investors Service.
Notes: Leverage ratio data are through June 30, 2017, and are quarterly. Leverage ratio calculated as: Net Debt / LTM EBITDA. Second quarter 2017 leverage ratio data are based on 97% of the reported issuances relative to previous eight-quarter average. Default rate data are monthly. Default rate data include distressed exchanges. Default rate data prior to June 30, 2017, are represented by Moody’s default rates as provided by the Deutsche Bank US Credit Strategy Chartbook. All default rate data on and after June 30, 2017, are sourced from the Moody’s Investors Service Default Report.
Despite worries at the start of 2017 about what further Federal Reserve rate hikes might do to affordability for residential housing and headwinds for certain commercial real estate sectors, improving real estate fundamentals helped structured credit backed by these assets post attractive returns. Non-Agency RMBS have returned over 10% as of November 30 as default rates continued to decline, in part because US single-family home prices hit all-time highs. CMBS also generated attractive returns (with BBBs returning over 9%) despite retail sector headwinds; however, rates of improvement in metrics like vacancy rates and NOI growth seem to be slowing.[6]For more discussion on commercial real estate fundamentals, please see the Real Assets section of this paper.
Looking Ahead to 2018
Lower yields create fewer attractive opportunities across the credit markets, and the potential for further US rate hikes should make investors cautious about longer-dated assets. The flipside is that tight spreads may help boost returns for strategies that acquire and finance pools of loans via securitization, as managers are locking in low funding costs. A key determinant of the credit outlook for 2018 will be the monetary policy decisions made by developed markets central banks, and how investors, who have been starved for yield, respond by allocating to various strategies.
While some central banks (including the ECB and Fed) will be less accommodating in 2018, an overall dovish policy bias remains a favorable tailwind for markets. Around $8 trillion of sovereign and corporate bonds across developed markets still trade with negative yields. Investors looking for income may continue to have little choice but to move down the capital stack or outside their domestic market, especially if located in the Eurozone, where investment-grade bonds yield sub-1% and junk bonds less than 3%. Despite yield compression, private credit strategies will continue to offer some attraction to these investors, as will some of the remaining higher-yielding liquid assets like US leveraged loans and structured credit.
Investors should watch the slope of the US yield curve and consider what might happen if steadily expanding growth translates into higher inflation expectations. The Fed’s three rate hikes since December 2016 have had little impact on credit thus far, because the yield curve has flattened, helping longer duration assets like USD-denominated emerging markets debt and bank capital securities generate large gains. Notwithstanding the positive impact of other central bank buying, we see asymmetric risks for long duration assets even if some credit fundamentals continue to improve. Credit spreads, which sit near the bottom quartile of historical values for many strategies, have limited room to tighten and thus offset the impact of rising rates (Figure 9). However, improved balance sheets and an ongoing economic expansion should mean they have less excuse to widen.
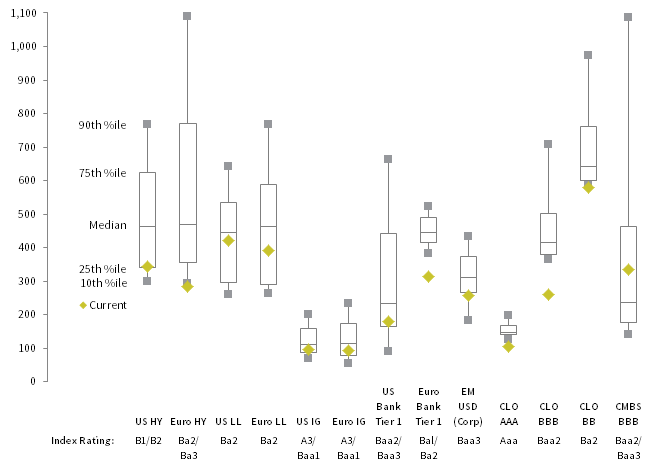
FIGURE 9 CURRENT CREDIT SPREADS IN HISTORICAL CONTEXT
As of November 30, 2017 • Basis Points (bps)
Sources: Barclays, Bloomberg, L.P., BofA Merrill Lynch, Credit Suisse, and J.P. Morgan Securities.
Notes: Asset classes represented by: Bloomberg Barclays US Corporate High Yield Index (US HY), Bloomberg Barclays Pan-European High Yield Index (Euro HY), Credit Suisse Leveraged Loan Index (US LL), Credit Suisse Western European Leveraged Loan Index (Euro LL), Bloomberg Barclays US Corporate Investment Grade Index (US IG), Bloomberg Barclays Pan-European Aggregate Corporate Index (Euro IG), Bloomberg Barclays Capital Securities Tier 1 Index (US Bank Tier 1), Bloomberg Barclays European Banks CoCo Index (Euro Bank Tier 1), J.P. Morgan CEMBI Diversified Index (EM USD [Corp]), J.P. Morgan CLOIE AAA Index (CLO AAA), J.P. Morgan CLOIE BBB Index (CLO BBB), J.P. Morgan CLOIE BB Index (CLO BB), and Bloomberg Barclays US CMBS Baa Index (CMBS BBB). Observation periods begin: January 31, 1994 for US HY; August 31, 2000 for Euro HY & Euro IG; January 31, 1992 for US LL; January 31, 1998 for Euro LL; June 30, 1989 for US IG; December 31, 2001 for US Bank Tier 1 & EM USD (Corp); May 31, 2014 for Euro Bank Tier 1; December 31, 2011 for CLO AAA, CLO BBB, & CLO BB; and August 31, 2000 for CMBS BBB.
Few Good Options in Liquid Credit. Liquid credit strategies like high-yield bonds and leveraged loans offer limited opportunity in 2018. The current 5.7% yield will cap any upside in high-yield bonds. Mid-single-digit returns may be the best investors can expect, assuming Fed action is more dovish than its guidance. US leveraged loans, which posted disappointing returns in 2017, seem marginally more attractive as their returns could get a lift from further hikes. However, given the current discount margin for leveraged loans sits somewhat close to its historical median, another wave of refinancing at lower spreads would generate headwinds. Weak covenant drafting and more aggressive capital structures are eroding the traditional argument that loans will offer more protection than bonds during the next credit sell-off. According to Barclays, roughly 55% of all large corporate loans originated in 2017 had more than 5 turns of leverage, well above levels in recent years.
Structured credit looks to be the best option in this space, even if such investments may be less liquid during times of market dislocation. Spreads on CLO tranches rated BB and B remain at least double those on similarly rated, high-yield bonds even as CLO issuance levels approach historical records. Property-backed structured credit should also generate excess returns in 2018. CMBS paper rated BBB now yields around 5.7%, roughly 60% more than comparably rated corporate bonds. Real estate fundamentals including property price appreciation and vacancy rates (for commercial property) look healthy outside of the retail landscape and should benefit from the strengthening US economy. The catch is that some of these opportunity sets are limited. For example total non-agency CMBS issuance in 2017 has been less than $80 billion and tranches rated BB or BBB are just a small percentage of this amount.
Opportunities in Private Credit. Several types of private credit funds may offer investors diversification and attractive returns in 2018. This includes those that, while heterogeneous, share a strategy of capitalizing on today’s tight spreads by using securitization to help fund asset purchases. Among these are closed-end funds that invest in real estate loans (both commercial and residential) as well as asset-backed securities supported by these claims. Managers pool the loans they acquire into a securitization vehicle, and retain only the tranches they believe are attractively priced. Closed-end vehicles that invest in CLO equity (and often debt) also could be placed in this group. Lower credit spreads on leveraged loans are a headwind today for CLO equity investors. However, they are also a tailwind in that spreads on CLO debt issued to fund loan purchases have fallen. Moreover, CLO financing costs are locked in (typically for ten years), providing an opportunity for CLO managers (and thus equity holders), when the current cycle turns, to reinvest maturing loan proceeds in higher-yielding assets.
Narrow spreads limit the opportunity set on the corporate credit side. Capital appreciation funds, which often make subordinated loans or specially tailored investments in smaller companies, are one strategy that might circumvent this headwind and generate attractive returns. Smaller companies typically lack access to public markets, and equity owners may be reluctant to have their stake diluted when capital is needed to expand. Manager selection is critical as this is more of an alpha play than a beta play.
Scanning other opportunities in private credit in 2018, investors should proceed cautiously. Large volumes of capital have been raised by US direct lending funds, but the scale of the opportunity set may not match the capital targeting it, leading returns to suffer. The situation could get worse before it gets better; according to Preqin, over 150 managers were raising funds for this strategy at the end of third quarter 2017. Distressed funds may also find fewer opportunities in 2018 if growth and inflation remain stable, though the capital overhang appears smaller. Sector-focused opportunities for distressed seemed limited as we went to press; however, many expect retail fundamentals to continue deteriorating and some telecommunications credits also face challenges. An exception to this generally limited opportunity set are specialty finance strategies, which include leasing, royalties, and other niches like merchant finance and factoring. Aside from being less correlated to overall equity markets, the shorter duration of these investments is also attractive.
Summary
Investors need to be patient when investing in credit in 2018 given the current paucity of attractive choices. This said, a rising macro tide may continue to limit downside risk, even if weakening investor protections and excessive inflows are setting the stage for intermediate-term disappointment. Given the combination of stable fundamentals and the availability of cheap finance, we are constructive on higher-carry structured credit and select lock-up opportunities including real estate credit–focused funds and capital appreciation funds. Should dispersion across credits increase, long/short credit funds could also be of interest, though rising equity markets could mean returns might continue to trail those in other hedge fund categories.
Real Assets: Focus on Resource Companies
Kevin Rosenbaum, Senior Investment Director
We have a positive outlook on natural resources equities and energy MLPs in 2018, despite recent challenges. With growing levels of free cash flow, better balance sheet positions, and undemanding valuations, these resource-focused companies are on firmer ground relative to the start of 2017. Moreover, we expect market interest in these investments to pick up as continued declines in crude oil stocks reduce downside risk in oil prices. We are less optimistic about US REITs, whose underlying valuations look stretched, and commodity futures, which continue to be dogged by negative roll yields. For those investors able to take on illiquidity risk, we continue to find compelling opportunities in private real assets.
2017 in Brief
The momentum real assets carried into 2017 fizzled in short order, as concerns about the pace of US crude oil production growth weighed on energy prices and related investments. By the second half of the year, with global activity measures picking up and increased chatter about OPEC extending its supply cuts, the pressure eased, helping natural resources equities and commodity futures pare earlier losses. This late pick up in performance, though broad, failed to support energy MLPs, which stumbled on retail selling and questions of growth.
US REITs avoided sector-wide turmoil in 2017, posting returns that led other major real asset investment options for the year. Steady commercial real estate fundamentals underpinned the asset class’s positive performance, particularly for those properties in the industrial sector, which benefited from booming e-commerce–linked demand. Yet, the asset class underperformed high-flying US equity benchmarks, held back in part by high valuations and retail-focused REITs, which suffered as their tenants lost market share to online retailers.
Looking Ahead to 2018
Natural Resources Equities. Few assets have shaken investor confidence in recent years as much as natural resources equities. A little more than three years ago, their favor began to slip, as global markets wrestled with what burgeoning US supplies would mean for crude oil prices. This negative sentiment persists—wrongly in our view—today. With growing levels of free cash flow, better balance sheet positions, and undemanding valuations, we think this out-of-favor asset class has more upside potential than downside risk.
Industry revenue is roughly 15% higher than the prior year, and with better operating leverage, free cash flow has grown by more than 30%. This growth came as management teams pulled back sharply on capital expenditures, a fact that will tighten future supply/demand conditions in oil markets, and lowered debt from high levels (Figure 10). Looking ahead, analysts are currently penciling in top-line growth of around 6% in 2018, which, considering the low base revenues fell to during the energy commodity downturn, appears more than reasonable.

FIGURE 10 FUNDAMENTALS OF NATURAL RESOURCES EQUITIES
First Quarter 2005 – Third Quarter 2017 • Year-Over-Year Percent (%) Change
Source: Thomson Reuters Datastream.
Notes: Data reflect the year-over-year change in each measurement for a broad basket of public natural resources–focused companies. The net debt chart is capped for consistency purposes, but it surged to 65.5% in fourth quarter 2007.
Reflecting this fundamental rebound, price multiples for natural resources equities have expanded in recent months. Still, compared to the long-term median level, they aren’t expensive. Our basket of natural resources companies trades at 11.5 times normalized earnings, a level lower than about three quarters of historical month-end observations dating back to 1980. Moreover, while our basket typically trades at a discount to the broad equity market, rarely has that discount been as large as it is today. By our measure, natural resources equities are priced at 60% the cost of developed markets equities. While the low valuations may not revert back to their historical medians any time soon, they at least aren’t likely to be a headwind.
Our positive outlook on the asset class also stems from encouraging signs that oil market supply/demand fundamentals are tightening. Global oil demand data released in recent months has come in stronger than forecasted, buoyed by an uptick in global economic activity. In the United States, this uptick has resulted in clear draws in oil and refined products inventories. And, despite signs that the pickup in economic activity may continue, OPEC and several other nations agreed to extend their production cuts through 2018 to aid in further tightening the market. Taken together, recent developments have positioned oil markets much more favorably than late 2016, a fact that should support natural resources equities.
Energy MLPs. Like natural resources equities, MLPs are currently recovering after a tumultuous few years. High costs of equity and debt capital have forced many partnerships to increasingly look to their own coffers to fund new capital projects. While this pivot away from external financing has flattened growth expectations, prospects remain positive, due to increased crude oil, natural gas, and natural gas liquids production across the United States. Together with reasonable valuations, we are optimistic about MLPs, although we are closely watching the fast-moving tax reform legislation currently being debated by the US Congress to ensure its relative tax advantage status endures.
Although 2018 distribution growth estimates have been reduced since the start of 2017—from roughly 9% to 6%—partnership fundamentals are still trending in a positive direction. Both industry revenue and free cash flow have surged by approximately 30%, and while net debt is high, it has moderated as a multiple of EBITDA from 6.3 to 5.5 times. Falling growth expectations could be a positive development for the industry if the new self-financing strategy encourages a more disciplined approach to capital deployment.
Our confidence in the asset class is linked to rising production forecasts for the underlying commodities MLPs transport (Figure 11). In a telling signal, even OPEC recently revised up its low annual US shale production estimates, and by staggering amounts—2020 estimates increased by 56%—tacitly admitting shale producers aren’t going away. As with oil, large increases in US natural gas production seem likely, driven by large demand growth linked to gas-based power generation and increases in gas exports via pipeline shipments and liquefied natural gas cargos.

FIGURE 11 US OIL AND NATURAL GAS PRODUCTION
First Quarter 2014 – Fourth Quarter 2018
Sources: Thomson Reuters Datastream and US Energy Information Administration.
Notes: Data are quarterly. Forecasts begin in fourth quarter 2017.
Despite the positive outlook, valuations are reasonable. The yield on the Alerian MLP Index, a prominent industry benchmark, is just south of 8%. While that yield is only slightly more attractive than the industry’s long-term median, as a spread over the yield offered by corporate credits it is in rare territory, suggesting the asset class is attractive. Although investors need to carefully navigate end of year tax-loss selling and understand the impact of any tax reform legislation, we continue to think this asset class’s yield and leverage to US energy production growth will benefit investors.
US REITs. The sizeable drop in cap rates since the end of the global financial crisis has been a boon to commercial real estate investors across the globe. Particularly in the United States, falling cap rates have been a major force propelling prices higher, accounting for nearly half the gains since 2010 (Figure 12). But the trend stalled this past year, as short-term interest rates moved higher. With the Federal Reserve planning more rate hikes in 2018, we see changes in cap rates as likely to be a headwind for US REIT investors, limiting our confidence in the asset class.

FIGURE 12 CONTRIBUTION TO COMMERCIAL PROPERTY PRICE CHANGES
Fourth Quarter 1983 – Third Quarter 2017 • Percent (%)
Source: National Council of Real Estate Investment Fiduciaries.
Notes: Data are quarterly and represent the NCREIF US Property Index. Net operating income contribution shows the rolling four-quarter NOI growth rate. Cap rate contribution is the difference between the quarterly price change and the NOI contribution.
To be sure, commercial real estate fundamentals are generally healthy. Occupancy rates across all major sectors are high and generally stable, despite some weakness in the multifamily and retail subsectors. And, while total commercial real estate spending is close to levels hit before the financial crisis, it is low as a percentage of GDP and credit conditions for new projects are generally tight. The uptick in global economic activity we see as continuing in 2018 should support continued growth in NOI.
If the Fed hikes interest rates in 2018 as planned, cap rates could widen, limiting any price gains linked to NOI growth. Currently, a cap rate measurement of US commercial real estate is near the lowest in its history and with the spread between it and ten-year Treasury yields narrowing in recent quarters to 266 bps—compared to a long-term level of 294 bps—cap rates appear more vulnerable to rate hikes than prior tightening cycles. Even if cap rates don’t widen, material cap rate compression seems highly unlikely going forward.
The market’s pricing of US REITs reflects this balance. Currently, a broad basket of these investments trades at 15.5 times normalized funds from operations—an earnings-like metric used by the REIT industry. Relative to the long-term median of 10.3, this appears rich and suggests performance over the long term will moderate. Still, commercial real estate investors may benefit from modest price appreciation linked to NOI growth in addition to the asset’s ability to generate stable income.
Commodity Futures. We have held an unfavorable view of commodities futures for several years now, and our view is no different for 2018. Our unfavorable view stems from their construction. Brand name benchmarks, such as the Bloomberg Commodity Index and the S&P GSCI™ Index , both hold liquid contracts at the front end of the term structure, rolling positions from the front to the second nearest contracts. This limitation to rolling contracts near maturity, where prices often differ the most relative to other parts of the term structure, can be a material source of positive return when markets are backwardated. Unfortunately, markets have tended to be in contango most of the past decade, muting performance. We have little confidence that this will change in 2018.
Summary
In 2018, investors should focus on natural resources equities and energy MLPs among public real asset investment options. These resource-focused companies—in contrast to richly priced US REITs and structurally challenged commodity futures—are best positioned to continue to grow free cash flow, aided by continued global economic growth and tightening in oil supply/demand fundamentals. With higher levels of free cash flow, these companies would be better able to strengthen balance sheets and return capital to investors. In short, we see resource-focused companies at current prices as having more upside potential than downside risk.
Sovereign Bonds: Fingers Crossed for Steady Central Banks, Limp Inflation
Sean McLaughlin, Managing Director
Are markets poised for more excitement in 2018, as Janet Yellen steps aside as the chair of the US Federal Reserve, the ECB continues to taper its asset purchases, and the Fed’s pace of balance sheet normalization accelerates? We doubt it, though tight US labor markets and Middle East tensions might conspire to stoke worries about a potential inflation pick-up.
Among a relatively unattractive opportunity set, US bond yields are some of the highest and remain the best house in a bad neighborhood, both in terms of nominal and inflation-linked bonds.[7]Note that the use of currency hedges (which are often employed by global bond investors, since currency volatility can be much higher than bond volatility) can boost or shrink the effective yields of … Continue reading However, given that the United States appears to be at a more advanced stage of its economic cycle and a steady hand at the Fed tiller is assumed (but not guaranteed), investors should avoid taking too much duration risk.
2017 in Brief
Developed market sovereign bonds in 2017 generally have offered low returns commensurate with their initial yields. The Bloomberg Barclays US Treasuries Index yielded 1.9% at the end of 2016 and has returned 2.0% in 2017 through November 30. The Bloomberg Barclays Euro Aggregate Government Index yielded 0.5% bps at year-end 2016 and has returned 1.0%. In the United Kingdom, yields have increased in 2017 given inflation and Brexit-related turmoil; gilt returns of just 0.3% have undershot December 2016 yields of 1.1%.
Yields for US ten-year Treasuries have been range-bound (trading between 2.0% and 2.6%) in 2017 despite significant leadership and policy changes at the Fed, as well as changes in reflation expectations associated with the Trump administration’s fiscal policy agenda. In contrast, yields of two-year Treasury notes have risen, signaling investors’ expectations for future Fed Funds rate increases. The net effect is that the curve has flattened, and the spread between ten-year and two-year Treasuries has compressed by more than 60 bps to around 65 bps (Figure 13). While this same dynamic was less evident in the Eurozone, the spread for UK gilts similarly compressed in 2017.
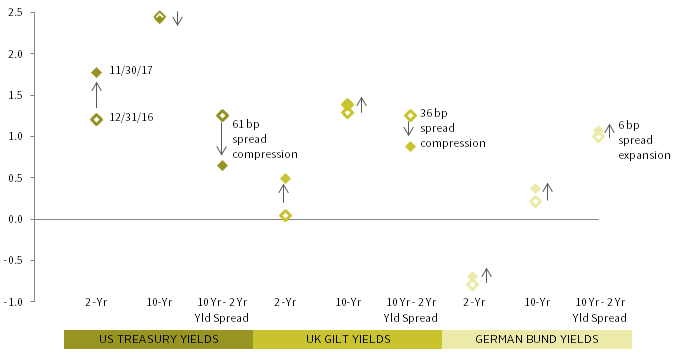
FIGURE 13 SOVEREIGN BOND YIELDS
December 31, 2016 vs November 30, 2017 • Percent (%)
Source: Thomson Reuters Datastream.
Central banks did not pull away the punch bowl in 2017, but some have begun diluting the potion. In the United States, the Fed hiked rates twice during the first half of 2017 and is widely expected to raise them again in December; it also has committed to slowing the reinvestment pace of maturing securities. The ECB appears unlikely to raise policy rates in 2018 given modest growth and low inflation, but recently announced that in January it will halve its volume of QE purchases (albeit to a still-significant €30 billion per month). And while the size of the BOE’s balance sheet remains stable, the Monetary Policy Committee hiked rates in October (a decision that was not unanimous).
Looking Ahead to 2018
The nature of the limited amount of central bank tightening that is occurring, and the reasoning behind it, offer important perspectives on the prospects for developed sovereign bond returns in 2018.
Tighter Policy, Higher Risks? As noted, central banks in the United States, United Kingdom, and continental Europe are gradually tightening policy, either by pushing up policy interest rates, or constraining QE, or both. How this impacts bond investors in 2018 may depend on the duration of their bond holdings. We would expect that for long-term bonds, the impact of rate hikes that follow the expected path will likely be modest. The experience of 2017 offers some support for this view; despite Fed rate hikes, ten-year Treasury yields have not risen apace. Conversely, yields on short-term Treasuries rose more dramatically, but because of their low duration the impact on returns was relatively muted.
Will ECB tapering and Fed normalization drive yields higher and lead to a sell-off in rates in 2018? This seems unlikely as long as the pace of these activities doesn’t accelerate unexpectedly. Ongoing asset purchases will still be significant relative to new supply, and the combined balance sheets of the BOE, BOJ, ECB, and Fed will still be growing in 2018 (Figure 14). The ECB balance sheet’s growth, while decelerating, will still be enough to offset the roughly 7% Fed contraction. The BOJ has communicated that its ongoing pace of bond purchases will continue to boost its bond holdings (while the BOJ claims the targeted pace continues to be $60 billion per month, in reality purchases have slowed over the past year). In other words, despite the Fed allowing $10 billion of bonds to mature each month (with the cap expanding over time), newly issued developed sovereign bonds may simply go from being very scarce to somewhat scarce.

FIGURE 14 CUMULATIVE BALANCE SHEET ASSETS FOR MAJOR CENTRAL BANKS
December 31, 2007 – December 31, 2018 • USD Trillions • Forecasts begin after November 30, 2017
Sources: Bank of England, Bank of Japan, European Central Bank, Thomson Reuters Datastream, and US Federal Reserve.
Notes: Data are monthly and converted into USD based on the prevailing exchange rate at each month end. Estimates are based on each bank’s announcements regarding its asset purchase plan through the end of 2018 and converted to USD based on November 30, 2017 exchange rates. Beginning September 2014, the Bank of England discontinued reporting of its total balance sheet asset value, instead detailing approximately 90% of the value of total assets. Therefore, after that time we assume that reported assets total 90% of total asset value (and adjust the reported values upward accordingly).
Why Are Central Banks Tightening? Investors should continue to watch the rationale offered for central bank tightening and ensure underlying conditions remain supportive for banks’ current relatively dovish stance. Growth, while quite moderate, appears to be both steady and reasonably healthy in the context of aging populations and maturing economies (it has been running at roughly a 1.5% to 2.25% pace in the Eurozone, United Kingdom, and United States). Job markets are also tightening in many countries,[8]For example, in the United Kingdom, 4.3% of residents aged 15–74 are unemployed, the lowest level since at least 1999. The civilian unemployment rate in the United States is 4.1%, which is in the … Continue reading creating the risk that wage pressures start to appear in rising consumer price indexes. While there are many moving pieces and potential arguments for why wages might remain low (offshoring, technology, decline of unions, etc.), tight labor markets typically aren’t a problem until they are a problem.
Inflation has remained below target for many years in most regions (though the United States remains somewhat close to target). Central banks, eyeing recent improvements in employment and growth, are cognizant that the optimal level of economic stimulus has fallen and appear more worried than the market about the potential for an inflation overshoot. For example, breakeven levels of US inflation (based on the difference between the yield of US five-year Treasury notes and the real yield of five-year TIPS) have remained below 2% for 50 of the past 60 months. If inflation begins to pick up even moderately and if such an acceleration appears supported, investors might rationally assume that central banks will adopt a less dovish course (and inflation of course makes bonds less valuable even if investors knew that central banks would not respond to it). Recent hints of upside inflation surprises are admittedly few and far between, but arguably they could become more likely, given rising commodity prices, recent dollar weakness, and today’s tight labor markets.
What Returns Can Bondholders Expect? Over the long term, initial bond yields are reliable indicators of subsequent returns, typically within about 150 bps. However, the same is not true for the short term. For periods dating back to 1980, we evaluated the starting yield on ten-year bonds and the bond’s subsequent 12-month return. Initial yields were not especially predictive of subsequent returns (Figure 15); half the time subsequent one-year returns either topped initial yields by more than 6% or undershot them by around 4% or more. This is because short-term returns can be influenced by factors other than initial yield (in particular, by changes in the level of yields). Given today’s high durations, investors could see 2018 bond returns that are fabulous or punitive, but somewhere in the middle seems more likely. Still, for the long term, returns are unlikely to be much better or much worse than the meager yields on offer today.
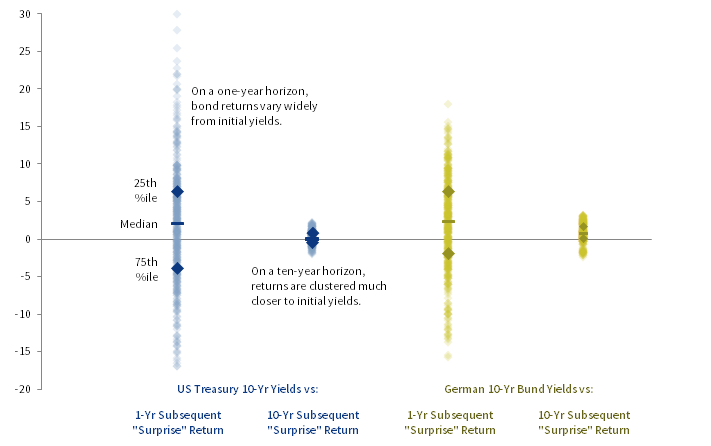
FIGURE 15 RETURN “SURPRISE” OF 10-YEAR SOVEREIGN BONDS
January 31, 1980 – November 30, 2017 • Percent (%)
Sources: Thomson Reuters Datastream and US Federal Reserve.
Notes: Data represent the degree to which the subsequent annualized total return of the specified government bond exceeded its starting yield over the specified time period. For example, if the ten-year bond started the period with a 5.0% yield and returned 5.7%, the return surprise would be 0.7%.
Are Linkers a Better Bet? Inflation-linked bonds are riskier than nominal bonds in some ways. They are less liquid than nominal bonds, they tend to correlate with commodity prices at inconvenient times, and they are vulnerable to a sell-off if risk parity products are forced to deleverage or have outflows.[9]Risk-parity funds typically have significant exposures to inflation-linked bonds, and the funds are leveraged. If increased volatility or increased cross-asset correlations cause the funds to quickly … Continue reading However, in one critical respect, they have a lower risk: they do not fundamentally lose value when inflation rears its head. For that reason, linkers can be a valuable addition to portfolios, yet many investors have shied away from them since the global financial crisis given low real yields. This has not necessarily been a bad choice; US TIPS, for example, have delivered a negative return over the past five years, even as nominal US government bonds have returned 1.1% annualized.
Is now a better time to own inflation-linked bonds? It depends in part on geography. In the United States, TIPS yields have made their way out of the cellar over the past two years. While TIPS remain overvalued, layering today’s real yields of 50 bps onto tomorrow’s realized inflation may have appeal in the context of generally low yields globally (breakeven inflation levels for ten-year TIPS are about 1.9%). In the United Kingdom, voracious pension demand for linkers has kept real yields at punitive levels (-1.7% for ten-year linkers), giving these bonds little fundamental appeal on an absolute basis.[10]Ten-year breakeven inflation is 3.1%, and recent inflation based on the index (UK Retail Price Index) that governs linker yields is running at almost 4%. The elevated level is in part due to currency … Continue reading And in the Eurozone, where nominal bond yields are well under 1%, real yields for inflation-linked bonds naturally are as well (-0.9% for 10-year French linkers), again limiting investor interest on an absolute basis.[11]Ten-year breakeven inflation for French linkers is about 1.4%, roughly consistent with recent inflation levels.
Summary
Sovereign bond investors have experienced lackluster returns in 2017, even as central banks have begun to slowly withdraw their exceptional stimulus both from economies (in the form of low policy rates) and from bond markets themselves (QE).
Looking ahead to 2018, while an inflation spike may seem unlikely, labor-market tightness in many countries and rising commodity prices raise the risk that price pressures might eventually overshoot the diminished expectations of central bankers and bondholders. UK gilt markets hiccupped in September when the BOE began telegraphing a November policy rate hike, though other markets have generally been relatively quiescent in the face of major changes including to the pace of ECB QE as well as to Fed leadership, policy rates, and bond-buying. Should investors perceive that central bank posture is becoming less dovish (or should inflation dynamics eventually indicate that it should become less dovish), today’s bond indexes, with their long durations, would suffer. US Treasuries moved into what we consider to be fairly valued territory in October, but sovereign bonds in other developed markets generally remain overvalued (and in some cases very overvalued), and investors should consider holding some cash in lieu of these richly valued sovereign bonds.
Currencies: Here We Go Again
Aaron Costello, Managing Director
Unhedged investors were whipsawed in 2017 as broad-based USD strength early in the year gave way to broad-based weakness. As 2017 closes, the dollar has found some footing that sets the stage for a potential rebound in 2018. Yet investors have the right to be skeptical, given the arguments for renewed USD strength are the same as they were a year ago. While we remain in the dollar-bullish camp for the near term, the strong-dollar cycle is nearing its end. Over the intermediate term, we expect the US dollar to weaken given elevated valuations, although this may not occur until after the next US recession.
2017 in Brief
The US dollar had a strong start to 2017 and then spent most of the year heading lower, especially against a resurgent euro. The dollar fell 10% versus a basket of developed markets currencies until rebounding in September on the belief that strong US growth and potential tax cuts will drive inflation higher and allow the US Federal Reserve to continue tightening over 2018 (Figure 16).
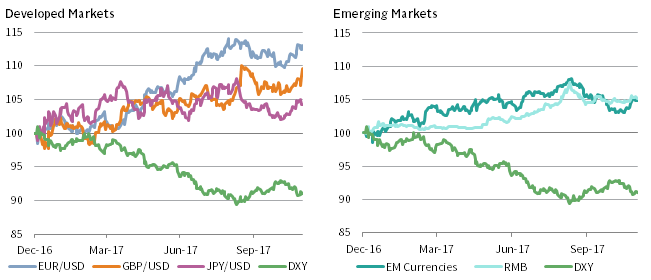
FIGURE 16 YTD 2017 CURRENCY MOVEMENTS
As of November 30, 2017 • December 31, 2016 = 100
Sources: J.P. Morgan Securities, Inc., MSCI Inc., and Thomson Reuters Datastream. MSCI data provided “as is” without any implied or express warranties.
Notes: Data are daily. EM Currencies is shown vs the USD and is based on the implied basket of currencies in the JP Morgan GBI-EM Diversified Index of local currency debt.
Of course, exactly the same sentiment was expressed in late 2016 following the US presidential election. What happened to make the consensus view so wrong? Part of the issue was positioning—the market was very net long the US dollar and short the euro in late 2016/early 2017. This set the conditions for a powerful reversal once it became clear that (1) the Trump administration would have difficulty achieving its legislative goals; (2) elections in Europe, and particularly France, reduced the tail risk of anti-EU parties gaining majorities; (3) US inflation had begun to tick down, causing the market to doubt the Fed’s resolve to hike rates beyond 2017; and (4) the economic recovery in Europe raised the prospect of potential ECB monetary tightening.
Emerging markets currencies also bucked expectations, strengthening for most of the year (Figure 16). This reflected the general weakness in the US dollar, but also an acceleration in emerging markets growth and relief that the Trump administration has yet to follow through on the protectionist rhetoric on display during the campaign. A steady RMB amid a generally resilient Chinese economy also helped underpin the general rally in emerging markets assets.
Looking Ahead to 2018
If 2017 saw the US dollar sink under the weight of lofty expectations, the bar is set lower for 2018. Today, markets are very net long the euro and still modestly net short the US dollar (Figure 17). Aside from the fading hype over US fiscal stimulus, inflation was the primary missing ingredient in 2017, and continued global growth and low unemployment in 2018 may see cyclical inflationary pressures start to emerge in the United States. This may force the bond market to reprice expectations for Fed hikes, which could help drive the US dollar higher. The nomination of Jerome Powell as the replacement for Janet Yellen at the Fed suggests the current status quo will be maintained, including the Federal Open Market Committee’s view that the Fed funds rate will peak in 2019 near 3%, something not currently reflected in the markets.

FIGURE 17 NET SPECULATIVE POSITIONS
January 5, 1999 – November 28, 2017 • Percent (%) of Open Interest
Sources: Thomson Reuters Datastream and US Commodity Futures Trading Commission.
Notes: Data are weekly. USD positioning tracks the net aggregate futures positions of non-commercial speculators against the Australian dollar, Canadian dollar, euro, Japanese yen, Mexican peso, New Zealand dollar, Swiss franc, and UK pound traded on the Chicago Mercantile Exchange as a percent of the total open interest. A negative number indicates a net short position on the dollar while a positive number indicates a net long position.
Developments in Europe may also drive currency markets in 2018. Even as the ECB has announced plans to cut its bond purchases in half starting in 2018, the bank maintains its dovish outlook for monetary policy, stressing that rate hikes are still far off and that QE will remain until the end of 2018 (and could be extended if needed). Any change in this outlook could drive a second leg higher in the euro. Meanwhile, as Brexit negotiations between the European Union and United Kingdom drag on, the pound sterling remains vulnerable, despite the recent BOE rate hike. The pound has rebounded strongly from its 2016 lows, but a sustained rise in the currency is unlikely until the Brexit uncertainty is lifted.
While the Fed is no longer the only central bank tightening policy, the BOJ is very likely to maintain its asset purchases and targeting of a 0% yield on the ten-year JGB. The lack of yield in Japan should keep the yen weak against most currencies in 2018, which is an implicit goal of the BOJ. However, a weak yen has become a consensus view and has encouraged the resurgence of the yen carry-trade, which raises the risk of yen strength amid any outbreak of market volatility.
The outlook for emerging markets currencies will largely be a function of whether the US dollar can resume its rise. Rising rates in the United States and a strong dollar have historically been negative for emerging markets currencies. Further, protectionism could again rear its head in 2018 in the run-up to the US mid-term elections in November, creating downward pressure on currencies of select trading partners (for example, China and Mexico). Yet if global growth and risk appetite remain solid, then emerging markets currencies could remain well supported, as valuations are not currently elevated (Figure 18).
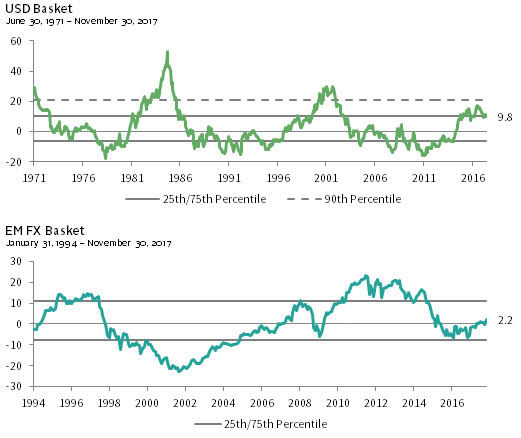
FIGURE 18 REAL EXCHANGE RATE: PERCENT FROM MEDIAN
Percent (%)
Sources: MSCI Inc. and Thomson Reuters Datastream. MSCI data provided “as is” without any express or implied warranties.
Note: The USD basket includes six developed markets currencies and the EM FX basket includes 22 emerging markets currencies.
Summary
We remain dollar bullish. The market is decidedly less dollar bullish now than a year ago, which increases the odds of a dollar rebound in 2018. Regardless of the outlook for US tax cuts, an old-fashioned uptick in inflation on the back of a tight labor market that sends interest rates higher will be the more important driver of renewed USD strength. This implies emerging markets currencies could also struggle to rise further. Currency markets in general may be range bound as the outlook for global monetary policy becomes more complicated, with global central banks beginning to tighten policy to different degrees.
Still, while a case can be made for a USD rebound in 2018, the strong-dollar cycle is clearly near its end. The current cycle has reached the duration of the past two cycles (i.e., more than six years), and although it has not yet seen the same magnitude of USD strength, the dollar is overvalued versus most currencies. On a basket basis versus developed markets currencies, the US dollar is at real exchange rate levels that have historically resulted in weakness on a multi-year horizon (Figure 18). As a result, we expect the dollar to weaken over the intermediate term, although this may not occur until after the next US recession.
Conclusion: Enjoy Dessert, But Be Prepared for the Party to End
Celia Dallas, Chief Investment Strategist
Looking across the landscape we’ve covered in these pages, conditions remain supportive of a risk-on environment in 2018. Nonetheless, investors should not be complacent about downside risks, as positive conditions cannot last forever. While no obvious catalysts stand out, risks that could end the festivities before partygoers have had their fill are clearly lurking in the shadows. For the party to continue, positive factors like strong and widespread global growth, strong corporate fundamentals, and generally reasonable equity valuations will need to offset geopolitical risks and uncertainty surrounding pullbacks in central bank accommodation.
Notably, as the market cycle continues, valuations across the board have been getting more expensive. At present, the most extreme valuations are found in US equities, select segments of private markets (e.g., late-stage US venture capital, US private equity, and European private equity), and segments of tradeable bonds, particularly core EMU sovereign bonds and euro-denominated credits. Many other asset classes and investment strategies are fully priced or expensive, but not excessively so. A helpful framework to consider when evaluating the impact of valuations on portfolio construction is to look at the degree to which investors are being compensated for taking risk. To evaluate this, we look at the spread between prospective returns for global equities and cash if valuations reverted to fair value and fundamentals to average levels over the next decade.
On this measure, compensation for taking risk has been falling since its peak in 2009, but remains positive and well above spreads seen near prior market tops. Over the long term, we expect the equity risk premium to be about 500 bps. Today, investors are getting paid less than half that amount—190 bps—for taking risk. By comparison, at prior market peaks, the equity risk premium was deeply negative (Figure 19).

FIGURE 19 PROJECTED 10-YR FORWARD EQUITY RETURNS IN EXCESS OF CASH
September 30, 1995 – November 30, 2017 • Annualized Return Differential (%)
Sources: MSCI Inc. and Thomson Reuters Datastream. MSCI data provided “as is” without any express or implied warranties.
Notes: This analysis uses our valuation-based scenario return projection models. Our return to normal scenario incorporates current valuations and assumes equity valuations revert to fair value over ten years. This scenario makes assumptions about the market environment including mild inflation; moderate real earnings growth; and low corporate default rates, government bond yields, and credit spreads. Projections are in local currency terms and are intended to represent total returns. Projected global equity returns are based on a weighted average of the projections for US, developed ex US, and EM equities using month-end weights for the MSCI All Country World Index. Cash returns are based on 3-Month US Treasury Bill yields.
The equity risk premium may bottom at a higher level than marked the end of the past two cycles, as the yield on cash might not increase as much as it did in the past. For the time being, however, investors are still being compensated for taking risk. As a result, we remain neutral on risky assets. Investors should seek to determine how much risk they are taking in portfolios relative to neutral risk allocations and adjust positioning accordingly.
We would tilt away from expensive US equities toward developed ex US and emerging markets equities. As we discussed, evidence is building that market forces have started to rotate in favor of non-US companies after a long stretch of US equity outperformance. Outside the United States, valuations are more attractive and earnings have more growth opportunity as companies catch up to the United States, boosted by improvements in margins and sales growth. However, a reduction in US corporate taxes (should tax law change) may yet boost US earnings growth, prospects for which are not fully priced in. Opportunities outside the United States also extend to private investments.
Among credits, as noted earlier, investors must remain highly selective. Liquid credits offer tight spreads on top of low sovereign yields, providing little appeal despite generally stable fundamentals. Select opportunities using skilled managers in higher-carry structured credit and select lock-up strategies, such as real estate credit and capital appreciation funds, offer the most appeal.
We are neutral on real assets on the whole. As outlined earlier, within public real assets we favor natural resources equities and energy MLPs over commodities and US REITs. After a difficult year, out-of-favor natural resources equities and MLPs trade at reasonable valuations amid improving fundamentals, setting the stage for an improved 2018. Oil supply and demand also appear to be moving into balance, providing further support for earnings among energy companies. In contrast, commodity futures continue to struggle under low cash collateral returns and negative roll yields, and upside in US REITs is limited amid stretched valuations, despite healthy fundamentals.
Investment strategies with limited economic exposure, such as pharmaceutical royalties and life settlements, are discussed in the second quarter 2017 edition of VantagePoint.
For more discussion of trend following, please see the fourth quarter 2016 edition of VantagePoint.
We would continue to own high-quality sovereign bonds as they remain valuable, but would minimize allocations given low yields mean low expected returns and high downside should rates rise. In place of some sovereign bonds, we would seek to add other diversifiers. For markets where yield curves are flat and/or sovereign bonds are overvalued, cash provides a reasonable substitute for sovereign bonds. For those investors able to take some illiquidity risk, a wide range of investment strategies with limited economic exposure offer competitive returns to equities. Such investments require skilled implementation and are not for everyone, as they involve headline and behavioral risks, but are well worth considering. Among more liquid diversifiers, we prefer trend following strategies and low equity and credit beta hedge funds.
After a soft patch in 2017, the US dollar may resume its secular run in 2018, but we suspect that most of the appreciation of this cycle has already occurred. Over the near term, we are neutral on USD exposures. Over the intermediate term, as discussed, we expect USD weakness, particularly relative to developed markets currencies against which valuations are most extended.
Overall, the conditions for 2018 look supportive for risky assets. However, it’s getting late in the evening, so even as you stick around for dessert, be prepared for the party to end. Diversification and adequate liquidity will be welcome sights the morning after.
Other contributors to this report include Anne Richardson, Christina Fenton-Neblett, Hope Brown, Stuart Brown, Joseph Comras, Jimmy Crivella, Daniel Day, Sean Duffin, Brandon Smith, and Han Xu.
List of Acronyms
BOE: Bank of England
BOJ: Bank of Japan
bps: basis points
CAPE: cyclically adjusted price-earnings ratio
CLO: collateralized loan obligation
CMBS: commercial mortgage–backed securities
EBITDA: earnings before interest, taxes, depreciation, and amortization
ECB: European Central Bank
EMU: European Monetary Union
EPS: earnings per share
ETF: exchange-traded fund
JGB: Japanese government bond
MLP: master limited partnership
NOI: net operating income
OPEC: The Organization of Petroleum Exporting Countries
P/E: price-earnings ratio
ppts: percentage points
QE: quantitative easing
REIT: Real Estate Investment Trust
RMB: Chinese renminbi
RMBS: residential mortgage–backed securities
ROE: return on equity
TIPS: Treasury Inflation-Protected Securities
USD: US dollar
Footnotes