Australia should benefit from a continuation of the reflation trade, but investors should not get too excited given risks to the outlook, particularly protectionism from the Trump administration
- The consensus outlook is for the ‘reflation trade’ to gather steam and equity markets hit new highs in 2017. Yet investors should not get too excited, as markets may be under-discounting the potential negative impact from protectionism and rising global rates, especially if the global economy starts to overheat.
- We favour tilting equity portfolios toward ‘value’ strategies and markets, which includes Australian, non-US developed markets, and emerging markets equities. Still, it is hard to have conviction in any portfolio tilts, suggesting a cautious approach to positioning is warranted.
- Remain underweight duration by holding both cash and Australian government bonds and stay partially unhedged to benefit from AUD weakness, but somewhat protected from any surge.
Last January, global markets were gripped by panic as the Chinese renminbi (RMB) weakened and commodity prices tumbled amid global recession fears triggered by a December 2015 US Federal Reserve rate hike and a rising US dollar. This January, the mood among investors is quite different despite rising US rates and a strong US dollar. A sense of optimism seems to have swept markets since the election of Donald Trump as president of the United States.
Even before the US election, global growth was accelerating. Add the prospect of fiscal stimulus in the United States and elsewhere, and you have a recipe for an economic boom, especially if monetary policy remains accommodative.
Or so the story goes. But rarely do things go so smoothly. While the political winds seem to have shifted toward ‘reflationary’ fiscal stimulus, markets seem to be downplaying the protectionist rhetoric coming from the Trump administration and the potential for a trade war between the United States and China. With a swath of elections in Europe, and the United Kingdom preparing to exit the European Union, a lot of things could sour the markets’ mood.
Please see Jason Widjaja and Aaron Costello, ‘Australian Outlook 2016: Déjà Vu All Over Again . . .’, Cambridge Associates Research Note, January 2016.
Last year, amid all the gloom, we advised investors to avoid de-risking portfolios as 2016 would be similar to 2015 or even 2011 — a year with market volatility, but one in which the global economy would avoid recession. This year, amid all the optimism, we caution investors not to get too excited. While the positive reflation story deserves the benefit of the doubt, 2017 may be as good as it gets if the global economy begins to overheat, resulting in more aggressive monetary tightening in 2018. Unlike last year, most risk assets are more expensive, and thus more vulnerable to any growth shock. And if protectionism does become more than rhetoric, the seeds could be sown for a transition from reflation to stagflation in the years ahead.
Please see ‘Outlook 2017: A Break in the Clouds’, Cambridge Associates Research Report, 8 December 2016.
For now, investors should remain underweight duration, credit, and bond proxies and tilt toward value strategies (like Australian equities), while retaining broad diversification.
Macro: Reflation for Now
The Australian economy unexpectedly contracted 0.5% in third quarter 2016 on the back of falling business investment, housing investment, and government spending. This brought year-on-year GDP growth to 1.8%, and prompted a spirited debate in the press as to whether Australia is on the verge of its first technical recession (defined as two consecutive quarters of negative growth) in 25 years. Consensus forecasts expect Australia to dodge that bullet, anticipating growth of 2.4% year-on-year in the fourth quarter, and 2.6% for 2017 (Figure 1).
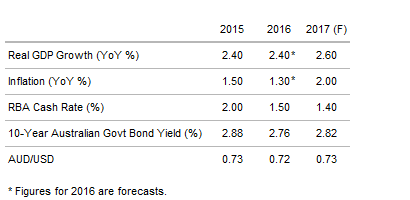
Figure 1. Australian Economic Indicators
As at 3 January 2017
Source: Bloomberg L.P.
Some economists are even more bullish on the outlook given the 40% rise in the prices of Australia’s key exports in 2016 (Figure 2). This is expected to provide a boost to national income equivalent to 3.5% of GDP, and the impact could be even greater if prices continue to rise in 2017.
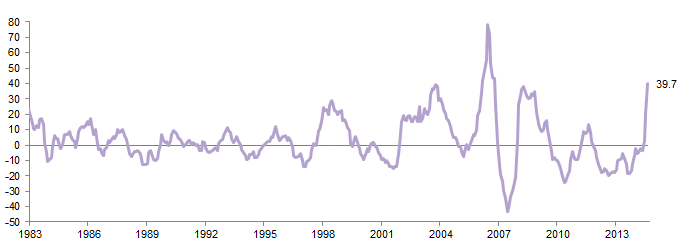
Figure 2. RBA Index of Commodity Prices
31 December 1983 – 31 December 2016 • Year-on-Year Percent (%)
Sources: Reserve Bank of Australia and Thomson Reuters Datastream.
Note: All data are monthly.
Offsetting this positive boost is the expectation that housing investment will contract 3.2% in 2017, with an even larger contraction (-10.9%) expected in 2018. House prices have plateaued, and new building approvals have tumbled (Figure 3). Adding to the headwinds is an expected contraction in broader business investment of -2.8% in 2017. The ongoing contraction in investment puts even more burden on commodity exports and government spending to support the economy. The hope is that a continued rise in commodity prices will spur renewed activity in the mining sector, while the third quarter GDP numbers will shock the government into agreeing on a national stimulus plan.
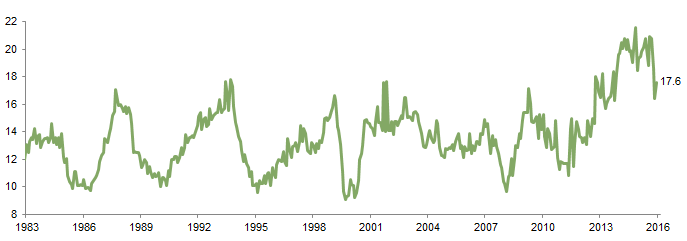
Figure 3. New Dwelling Approvals
31 December 1983 – 30 November 2016 • in thousand units
Source: Thomson Reuters Datastream.
This has complicated the outlook for central bank policy. The Reserve Bank of Australia (RBA) is reluctant to cut rates lower and further fuel a housing market that needs to deflate. With the outlook increasingly dependent on rising commodity prices, which are largely dependent on Chinese demand, the RBA may be forced to ease further in 2017 and hope exports and broader growth increase alongside a weakening Australian dollar. As a result, consensus forecasts expect no increase in the RBA cash rate, despite a modest pickup in inflation to 2.0% in 2017.
In essence, a positive outlook for Australia requires that global reflation remain in place. Investors have focused on the potential for large-scale US fiscal stimulus to drive growth higher, and seem to have downplayed the odds and impact of meaningful trade tensions. This assumption will be tested very soon, as the Trump administration unveils its policy objectives. While increased fiscal stimulus is certainly a priority for the new administration, Trump won the election largely on the premise that he would take a tough stance on trade and bring jobs back to the United States. This is a key promise to fulfil, and, contrary to popular belief, the president does not need congressional approval to impose tariffs or launch a host of other protectionist policies. Thus, markets may be in for an unpleasant surprise.
Indeed, analysis by Goldman Sachs suggests that the boost to US growth from tax cuts and infrastructure spending may be offset over the coming years by drags from lower immigration, trade barriers, and rising rates due to inflation pressures. The more draconian the protectionism, the more likely it will lead to lower growth and higher inflation in the years ahead.
At the same time, elections in France, Germany, and potentially Italy (among other countries) will take place this year, any of which has the potential to offer new political upsets to the status quo. The current consensus is that mainstream parties will win the French and Germany elections, but anti-EU parties appear set to gain seats in national legislatures. Meanwhile, the United Kingdom’s negotiations to leave the European Union will soon begin in earnest, adding to the angst in Europe.
In China, rising US rates put pressure on the central bank to follow suit to support the RMB, but rising rates will place additional downward pressure on growth, given high corporate debt levels. Thus, the People’s Bank of China is likely to keep rates relatively steady and let the RMB weaken. So far, investors have been blasé about a weakening RMB. The combination of rising US rates and tariffs by the Trump administration may set the stage for a more aggressive depreciation of the RMB, which could rattle markets.
Overall, for now, we reluctantly agree with the consensus view: fiscal stimulus will outweigh any drag from rising US rates as monetary easing in Europe and Japan will continue; mainstream parties will remain in power in Europe; and China will slow but avoid a hard landing.
However, all bets are off if the Trump administration takes a hard line on trade and China. The key risks are protectionism and whether the rise in inflation and interest rates occurs more abruptly than expected. And this is especially so for Australia, given how the current positive consensus view on the economy is dependent on stable commodity prices and Chinese demand.
Australian Dollar: Risks Are to the Downside
Currency markets saw large moves in 2016, as USD weakness for much of the year gave way to renewed strength in the fourth quarter. For 2017, we expect the US dollar to grind higher, especially against European and emerging markets currencies, driven by Fed rate hikes and uncertainty over European politics and rising trade tensions with China.
The Australian dollar fell 0.5% against the US dollar in 2016, dragged lower by a 5.4% fall over the fourth quarter. Current consensus forecasts expect the Australian dollar to be flat versus the US dollar in 2017 at 0.73 (albeit with a forecast range of 0.84 to 0.60) (Figure 4).
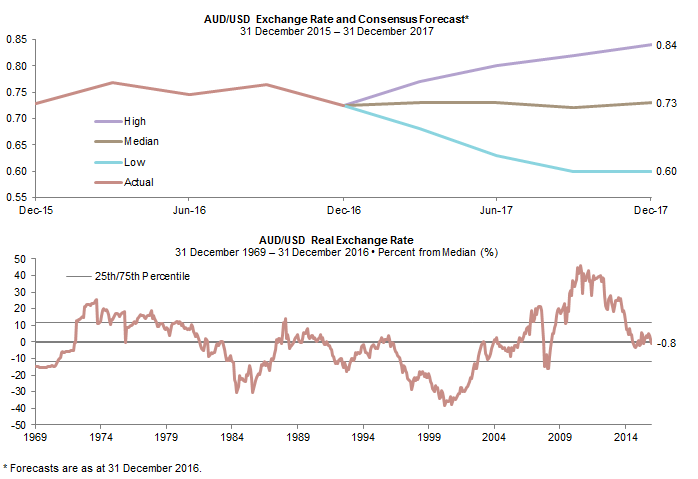
Australian Dollar: Consensus Forecast and Valuation
Sources: Bloomberg L.P., MSCI Inc., and Thomson Reuters Datastream. MSCI data provided ‘as is’ without any express or implied warranties.
Note: Data for the top chart are quarterly and for the bottom chart are monthly.
From our perspective, the risks remain to the downside for the Australian dollar, especially if the RBA stays on hold for most of 2017 as the Fed hikes rates by 75 basis points (bps) (Figure 5). This would eliminate the interest rate spread between the two currencies, something not seen since 1999/2000, when the Australian dollar was much lower than today’s levels. Although the relationship between relative interest rates and currency movements isn’t perfect, they typically move in the same direction. Such an outcome would likely drive the Australian dollar to undervalued on our real exchange rate framework.
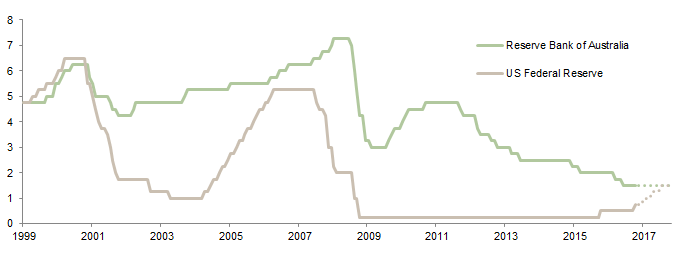
Figure 5. Policy Rates
31 March 1999 – 31 December 2017 • Percent (%)
Sources: Federal Reserve, Reserve Bank of Australia and Thomson Reuters Datastream.
Note: Forecasts for 2017, represented by the dashed lines, are based on the respective central bank statements.
Yet, a strong rebound in the Australian dollar cannot be ruled out. The Australian dollar has not followed the surge in commodity prices. This is likely due to investors doubting the durability of the commodity rally given concerns over China. But the currency could snap back to life if commodity prices remain elevated. At the same time, the RBA’s current preference for a weak exchange rate may change if inflation unexpectedly rises above the policy band, resulting in more rate hikes than the consensus currently expects.
For more on developing such a policy, please see Himanshu Chaturvedi and Kate Miller, ‘Strategic Currency Hedging Policy: A New Framework,’ Cambridge Associates Research Report, 2016.
As a result, we advise AUD-based investors to remain partially hedged, especially versus the US dollar. Given the volatility seen in currency markets in 2016, investors should focus on developing a strategic currency hedging policy and sticking with it, rather than trying to time the markets.
Equities: More Upside for Australia
Global equities posted solid returns in 2016 despite the rocky start to the year and the short-lived ‘Brexit’ shock in June. Australian equities outperformed most other markets last year (Figure 6). Yet almost all of the 11.8% return for the ASX 200 occurred after the US election, as Aussie equities surged 11% amid the reflation trade that has gripped global equities (Figure 7). Resources stocks saw a massive rally, returning 42% in 2016; non-resources stocks posted a more prosaic 7.5% return, lower than developed markets as a whole.
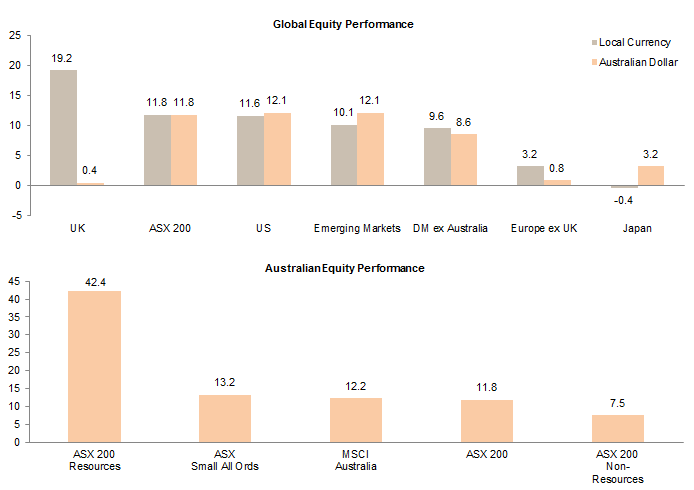
Figure 6. Australian and Global Equity Performance: Calendar Year 2016
Total Return (%)
Sources: MSCI Inc. and Thomson Reuters Datastream. MSCI data provided ‘as is’ without any express or implied warranties.
Note: Total returns are gross of withholding taxes.
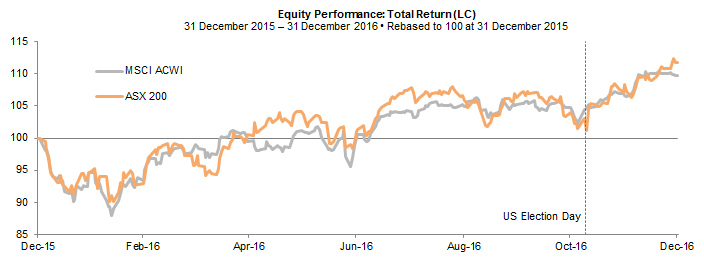
Figure 7. The Post–US Election Bump
Sources: MSCI Inc. and Thomson Reuters Datastream. MSCI data provided ‘as is’ without any express or implied warranties.
Despite the strong rally, Australian equities are only 8.5% above historical median on a return on equity–adjusted price-earnings basis and within our fair value range (Figure 8). The market has more upside if the reflation trade continues to support mining stocks (12% of the market) and especially if rising global rates lead to a re-rating of banks (35% of the market) on the back of rising net interest margins. Given the headwinds facing the property sector discussed earlier, the ultimate upside for Australia banks may be more limited than for banks in other markets.
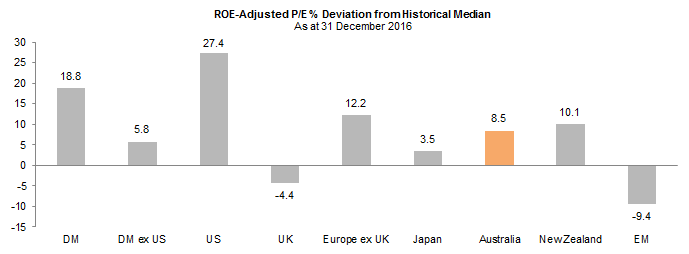
Figure 8. Australian and Global Equity Valuations
Sources: MSCI Inc. and Thomson Reuters Datastream. MSCI data provided ‘as is’ without any express or implied warranties.
Notes: DM valuation is the weighted average of the United States, the United Kingdom, Europe ex UK, Japan, Australia, Singapore, Hong Kong, Canada, and New Zealand valuations. DM ex US valuation is the weighted average of the United Kingdom, Europe ex UK, Japan, Australia, Singapore, Hong Kong, Canada, and New Zealand valuations.
We still favour tilting portfolios toward ‘value’ strategies and markets, which means away from US equities and toward non-US developed markets and emerging markets equities. This also implies a more constructive view and tilt toward Australia. However, the recent rally has lifted the valuations for several markets, leaving emerging markets equities the only clear ‘value’ opportunity globally. These low valuations reflect the real threat of rising trade tensions and a strong US dollar, which has historically been a headwind for emerging markets assets. European markets are no longer undervalued despite the political risks posed by upcoming elections and the United Kingdom’s Brexit negotiations. Japanese equities face their own challenges given trade and currency uncertainty.
Thus, it is hard to have conviction in any portfolio tilts, suggesting a cautious approach to positioning is warranted. A pullback in global markets seems likely as the euphoria over the prospect of large US fiscal stimulus fades given that the economic impact of any legislation won’t be felt until well into 2018. In other words, the good news is likely already in the price and markets may be under-discounting the negative impact of protectionism and rising global interest rates.
Ultimately, global equities should grind higher over 2017, with the recent shift in market leadership from growth to value continuing. But expect investors’ newfound optimism to be tested.
Fixed Income: Remain Underweight Duration
Australian government bonds returned a decent 2.6% for 2016, despite suffering a 4.1% loss in the fourth quarter. Ten-year yields have jumped nearly 100 bps from their August lows to reach 2.77% at the end of December (Figure 9), reversing the entire yield rally since 2015. Despite this, we still consider Australian government bonds overvalued. Yields have further to rise, especially if inflation surprises to the upside or the RBA decides to tighten policy this year. We continue to advise that investors hold a mix of cash and government bonds to reduce overall duration risk while also benefiting from any rally in yields should current optimism on the reflation trade fade away. We would be more constructive on increasing duration risk if yields rose above 4.50%.

Figure 9. Ten-Year Government Bond Yields
31 December 2014 – 31 December 2016 • Percent (%)
Source: Thomson Reuters Datastream.
Note: All data are daily.
We are less constructive on global government bonds or investment-grade credit for Australia-based investors, as yields are not compelling relative to domestic fixed income. We are also not excited about global high-yield bonds given their current yields (sub-6%) and narrow spreads. We see better opportunities in private credit strategies. While these are no replacement for government bond exposure, for investors willing to lock up their capital, this space is more compelling than traditional high-yield and other credit strategies at this juncture.
Conclusion
While the positive reflation story deserves the benefit of the doubt, investors should not get too excited because markets may have already priced in the positive impacts from potential fiscal stimulus, and under-discounted the potential negative impacts from protectionism and rising interest rates. For Australia, and the global economy as a whole, 2017 may be as good as it gets, especially if fiscal stimulus and protectionism cause inflation to rise in 2018, forcing a more aggressive tightening in monetary policy. At the same time, a trade war between the United States and China would certainly have a negative impact on the global economy and Australia. For now, Australia-based investors should overweight ‘value’ by modestly tilting equity portfolio away from US equity and toward non-US, Australian, and emerging markets equities. Remain underweight duration by holding both cash and Australian government bonds, and stay partially unhedged to benefit from any weakness in the Australian dollar, but somewhat protected from any surge in the currency.
Aaron Costello, Managing Director
Han Xu, Investment Associate
Index Disclosures
Cambridge Associates does not provide stock selection recommendations, and any reference to specific companies is not to be interpreted as a recommendation of that company as an investment option.
MSCI All Country World Index (ACWI)
The MSCI ACWI is a free float-adjusted market capitalization weighted index designed to measure the large- and mid-cap equity market performance of developed and emerging markets. The index covers approximately 85% of the free float–adjusted market capitalization available to foreign investors and consists of 46 country indexes comprising 23 developed and 23 emerging market country indexes. The developed market country indexes included are: Australia, Austria, Belgium, Canada, Denmark, Finland, France, Germany, Hong Kong, Ireland, Israel, Italy, Japan, the Netherlands, New Zealand, Norway, Portugal, Singapore, Spain, Sweden, Switzerland, the United Kingdom, and the United States. The emerging market country indexes included are: Brazil, Chile, China, Colombia, Czech Republic, Egypt, Greece, Hungary, India, Indonesia, Korea, Malaysia, Mexico, Peru, the Philippines, Poland, Qatar, Russia, South Africa, Taiwan, Thailand, Turkey, and the United Arab Emirates.
MSCI Australia Index
The MSCI Australia Index is a free float–adjusted, market capitalization–weighted index designed to measure large- and mid-cap equity market performance of Australia. The index covers approximately 85% of the free float–adjusted market capitalization available to foreign investors.
MSCI Emerging Markets Index
The MSCI Emerging Markets Index is a free float–adjusted, market capitalization–weighted index designed to measure large and mid-cap equity market performance of emerging markets. The index covers approximately 85% of the free float–adjusted market capitalization available to foreign investors. As of January 2016, the index includes 23 emerging markets country indexes: Brazil, Chile, China, Colombia, Czech Republic, Egypt, Greece, Hungary, India, Indonesia, Korea, Malaysia, Mexico, Peru, the Philippines, Poland, Qatar, Russia, South Africa, Taiwan, Thailand, Turkey, and the United Arab Emirates.
MSCI Europe ex UK Index
The MSCI Europe ex UK Index captures large- and mid-cap equity market performance across 14 developed markets countries in Europe. The index covers approximately 85% of the free float–adjusted market capitalization available to foreign investors across European developed markets, excluding the United Kingdom. The country indexes included are: Austria, Belgium, Denmark, Finland, France, Germany, Ireland, Italy, the Netherlands, Norway, Portugal, Spain, Sweden, and Switzerland.
MSCI Japan Index
The MSCI Japan Index is a free float–adjusted, market capitalization–weighted index that is designed to measure the large- and mid-cap equity market performance of Japan. The index covers 85% of the free float–adjusted market capitalization in Japan available to foreign investors.
MSCI New Zealand IMI Index
The MSCI New Zealand Investable Market Index (IMI) is designed to measure the performance of the large-, mid-, and small-cap segments of the New Zealand market. The index covers approximately 99% of the free float–adjusted market capitalization in New Zealand.
MSCI UK Index
The MSCI UK Index is a free float–adjusted, market capitalization–weighted index that is designed to measure the large- and mid-cap equity market performance of the United Kingdom; the index covers 85% of the free float–adjusted market capitalization in the United Kingdom available to foreign investors.
MSCI US Index
The MSCI US Index is designed to measure the performance of the large- and mid-cap segments of the US market. The index covers approximately 85% of the free float–adjusted market capitalization in the United States available to foreign investors.
MSCI World ex Australia Index
The MSCI World ex Australia Index captures large- and mid-cap representation across developed markets countries. The index covers approximately 85% of the free float–adjusted market capitalization available to foreign investors across developed markets, excluded Australia. The country indexes included are: Austria, Belgium, Canada, Denmark, Finland, France, Germany, Hong Kong, Ireland, Israel, Italy, Japan, the Netherlands, New Zealand, Norway, Portugal, Singapore, Spain, Sweden, Switzerland, the United Kingdom, and the United States.
RBA Index of Commodity Prices
The RBA Index of Commodity Prices is a weighted arithmetic average based on the prices of major commodities exported by Australia, and is intended to provide a timely indicator of the prices received by Australian commodity exporters.
S&P/ASX 200 Index
The S&P ASX 200 Index is a free float–adjusted, market capitalization–weighted equity index that covers 80% of market capitalization in Australia available to domestic investors.
S&P/ASX 200 Non-Resources Index
The S&P/ASX 200 Non-Resources Index provides exposure to the Australian equity market excluding companies classified in the Energy sector (GICS® Tier 1), as well as companies classified in the Metals and Mining Industry (GICS® Tier 3).
S&P/ASX 200 Resources Index
A sector sub-index of the S&P/ASX 200 Index, this index exposure to the resources sector of the Australian equity market as classified as members of the GICS® resources sector. Resources are defined as companies classified in the energy sector (GICS® Tier 1), as well as companies classified in the metals & mining industry (GICS® Tier 3).
S&P/ASX All Ordinaries Index
The S&P/ASX All Ordinaries Index represents the 500 largest companies in the Australian equities market. Index constituents are drawn from eligible companies listed on the Australian Securities Exchange. Liquidity is not considered as criteria for inclusion, except for foreign-domiciled companies.
S&P/ASX Small Ordinaries Index
The S&P/ASX Small Ordinaries Index represents the small cap members of the S&P/ASX 300 Index, but excludes those in S&P/ASX 100 Index. The S&P/ASX Small Ordinaries index is used as an institutional benchmark for small cap Australian equity portfolios. The index covers approximately 7% of Australian equity market capitalization available to domestic investors.