For New Zealand and the global economy as a whole, 2017 may be as good as it gets, especially if fiscal stimulus and protectionism cause inflation to rise in 2018, forcing a more aggressive tightening in monetary policy
- Markets may be under-discounting the potential negative impact from protectionism and rising global rates, especially if the global economy starts to overheat.
- NZ equities have not taken part in the ‘reflation trade’ that has driven global equities since the US presidential election. While valuations have improved, we do not yet view NZ equities as attractive, given the reflation trade may have more to run.
- We favour tilting equity portfolios toward ‘value’ strategies and markets, which means away from NZ and US equities and toward non-US developed markets (including Australia) and emerging markets equities. Still, it is hard to have conviction in any portfolio tilts, suggesting a cautious approach to positioning is warranted.
- Remain underweight duration by holding both cash and NZ government bonds, and stay partially unhedged to benefit from NZD weakness.
Last January global markets were gripped by panic as the Chinese renminbi (RMB) weakened and commodity prices tumbled amid global recession fears triggered by the December 2015 US Federal Reserve rate hike and a rising US dollar. This January, the mood among investors is quite different despite rising US rates and a strong US dollar. A sense of optimism seems to have swept markets since the election of Donald Trump as president of the United States.
Even before the US election, global growth was accelerating. Add the prospect of fiscal stimulus in the United States and elsewhere, and you have a recipe for an economic boom, especially if monetary policy remains accommodative.
Or so the story goes. But rarely do things go so smoothly. Though the political winds seem to have shifted toward ‘reflationary’ fiscal stimulus, markets seem to be downplaying the protectionist rhetoric coming from the Trump administration and the potential for a trade war between the United States and China. With a swath of elections in Europe, and the United Kingdom preparing to exit the European Union, a lot of things could sour the markets’ mood.
Please see Aaron Costello and Jason Widjaja, ‘New Zealand Outlook 2016: Keep Steady’, Cambridge Associates Research Note, February 2016.
Last year, amid all the gloom, we advised investors to ‘keep steady’ and avoid de-risking portfolios as 2016 would be similar to 2015 — a year with market volatility, but one in which the global economy would avoid recession. This year, amid all the optimism, we caution investors not to get too excited. While the positive reflation story deserves the benefit of the doubt, 2017 may be as good as it gets if the global economy begins to overheat, resulting in more aggressive monetary tightening in 2018. Unlike last year, most risk assets are expensive, and thus more vulnerable to any growth shock. And if protectionism does become more than rhetoric, then seeds could be sown for a transition from reflation to stagflation in the years ahead.
Please see ‘Outlook 2017: A Break in the Clouds’, Cambridge Associates Research Report, 8 December 2016.
For now, investors should remain underweight duration, credit, and bond proxies (like NZ equities) and tilt toward value strategies, while retaining broad diversification.
Macro: Reflation for Now
The NZ economy surprised to the upside in 2016, with third quarter GDP coming in at 3.5% year-on-year, one of the fastest rates in the developed world. The economy is firing on all cylinders, aided by a rebound in dairy prices (Figure 1), increased construction activity, tourism, and ongoing net immigration.
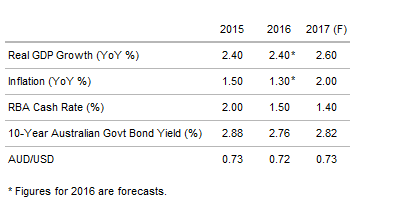
Figure 1. Global Dairy Prices
31 January 1999 – 31 December 2016 • Rebased to 100 at 31 January 1999
Sources: Global Dairy Trade and Thomson Reuters Datastream.
Note: Data are monthly and cumulative wealth is based on the GDT Price Index.
If anything, the decision by the Reserve Bank of New Zealand (RBNZ) to cut interest rates by 75 basis points (bps) over the course of the year to help offset a rising NZ dollar added fuel to the fire. Yet, despite the robust growth, consumer price inflation has remained stubbornly low at less than 1%. Instead, inflation has manifested in the property market, with prices continuing to rise (Figure 2).
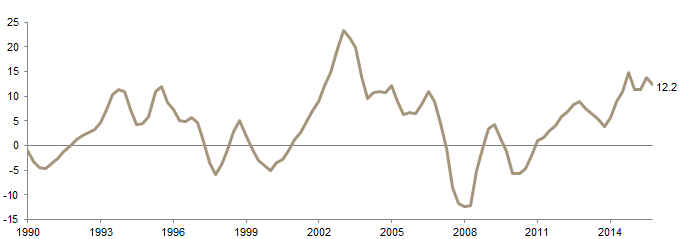
Figure 2. New Zealand Real House Prices
Fourth Quarter 1990 – Third Quarter 2016 • Year-on-Year Percent (%) Change
Source: Thomson Reuters Datastream.
Note: House prices are deflated using the NZ Consumers Price Index.
New Zealand is an economic sweet spot, and 2017 should be more of the same. Though growth is forecasted to moderate slightly to 2.8% (Figure 3), there is room for upside surprises from increased fiscal spending ahead of the general election slated for late 2017. Forecasts show inflation rising modestly to 1.7%, and interest rates remaining relatively stable; current RBNZ projections see policy rates on hold at 1.75% until the end of 2019!
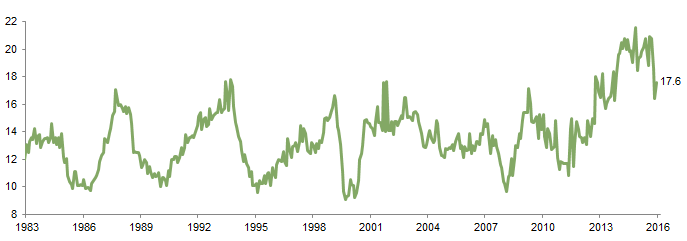
Figure 3. New Zealand Economic Indicators
As at 3 January 2017
Source: Bloomberg L.P.
The biggest domestic risk for New Zealand is that the economy begins to overheat, forcing the RBNZ into a more abrupt tightening of monetary policy that has knock-on effects for the housing market. There is a general perception that neither the government nor the RBNZ want to lean too heavily on the housing market in an election year, but at some point interest rates will need to rise if the economy continues to grow strongly.
Whether rising rates occur this year or are postponed until 2018 remains to be seen. So long as increases are gradual, they should not rattle the economy too badly. But the longer the delay, the more potential risk builds in the property market and the more painful the adjustment will be.
The more immediate risks for New Zealand are external. Investors have focused on the potential for large-scale US fiscal stimulus to drive growth higher, and seem to have downplayed the odds and impact of meaningful trade tensions. This assumption will be tested very soon, as the Trump administration unveils its policy objectives. While increased fiscal stimulus is certainly a priority for the new administration, Trump won the election largely on the premise that he would take a tough stance on trade and bring jobs back to the United States. This is a key promise to fulfil, and, contrary to popular belief, the president does not need congressional approval to impose tariffs or launch a host of other protectionist policies. Thus, markets may be in for an unpleasant surprise.
Indeed, analysis by Goldman Sachs suggests that the boost to US growth from tax cuts and infrastructure spending may be offset over the coming years by drags from lower immigration, trade barriers, and rising rates due to inflation pressures. The more draconian the protectionism, the more likely it will lead to lower growth and higher inflation in the years ahead.
At the same time, elections in France, Germany, and potentially Italy (among other countries) will take place this year, any of which has the potential to offer new political upsets to the status quo. The current consensus is that mainstream parties will win the French and German elections, but anti-EU parties appear set to gain seats in national legislatures. Meanwhile, the United Kingdom’s negotiations to leave the European Union will soon begin in earnest, adding to the angst in Europe.
In China, rising US rates put pressure on the central bank to follow suit to support the RMB, but rising rates will place downward pressure on growth, given high corporate debt levels. Thus, the People’s Bank of China is likely to keep rates relatively steady and let the RMB weaken. So far, investors have been blasé about a weakening RMB. The combination of rising US rates and tariffs by the Trump administration may set the stage for a more aggressive depreciation of the RMB, which could rattle markets.
Overall, for now we reluctantly agree with the consensus view that fiscal stimulus will outweigh any drag from rising US rates as monetary easing in Europe and Japan will continue; mainstream parties will remain in power in Europe; and China will slow but avoid a hard landing.
However, all bets are off if the Trump administration takes a hard line on trade and China. The key risks are protectionism and whether the rise in inflation and interest rates occurs more abruptly than expected.
New Zealand Dollar: Still Expensive
Currency markets saw large moves in 2016 as USD weakness for much of the year gave way to renewed strength in the fourth quarter. For 2017, we expect the US dollar to grind higher, especially against European and emerging markets currencies, driven by Fed rate hikes and uncertainty over European politics and rising trade tensions with China.
The NZ dollar’s 1.9% increase against the US dollar in 2016 masks the kiwi’s 4.1% fall versus the US dollar over fourth quarter. Current consensus forecasts expect the NZ dollar to be flat versus the US dollar in 2017 at 0.69 (albeit with a forecast range of 0.78 to 0.55) (Figure 4).
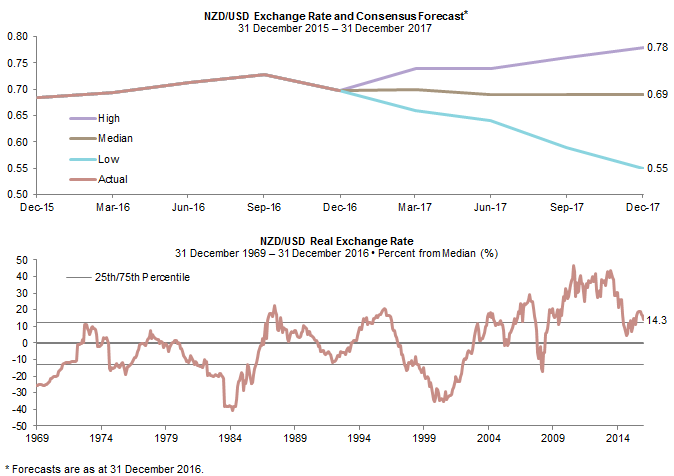
Figure 4. New Zealand Dollar Valuations
Sources: Bloomberg L.P., MSCI Inc., and Thomson Reuters Datastream. MSCI data provided “as is” without any express or implied warranties.
Note: Data for the top chart are quarterly and for the bottom chart are monthly.
From our perspective, the risks remain to the downside for the NZ dollar, especially if the RBNZ stays on hold for most of 2017 as the Fed hikes rates by 75 bps. This would narrow the interest rate spread between the two currencies to only 25 bps; the smallest spread since 2000. Although the relationship between relative interest rates and currency movements isn’t perfect, they typically move in the same direction. If anything, the NZ dollar has been defying gravity recently in the face of narrowing rate differentials. A similar conclusion is reached by our real exchange rate analysis, which shows the NZ dollar remains expensive (Figure 4). The RBNZ seems to share this view and has repeatedly stated its preference for a weaker currency. While this preference may change if inflation unexpectedly rises above the policy band (1%–3%), for now the central bank does not seem keen to defend the currency with rate hikes (Figure 5).
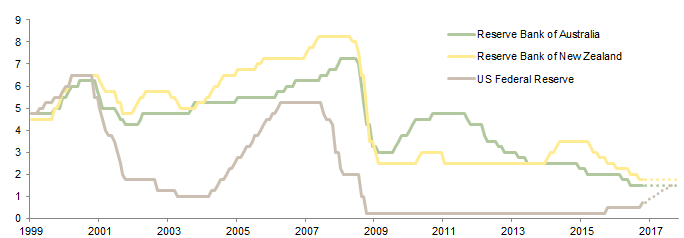
Figure 5. Policy Rates
31 March 1999 – 31 December 2017 • Percent (%)
Sources: Reserve Bank of Australia, Reserve Bank of New Zealand, and Thomson Reuters Datastream.
Note: Forecasts for 2017, represented by the dashed lines, are based on the respective central bank statements.
For more on developing such a policy, please see Himanshu Chaturvedi and Kate Miller, ‘Strategic Currency Hedging Policy: A New Framework’, Cambridge Associates Research Report, 2016.
As a result, we continue to advise NZD-based investors to remain partially unhedged, especially versus the US dollar. Given the volatility seen in currency markets in 2016, investors should focus on developing a strategic currency hedging policy and sticking with it, rather than trying to time the markets.
The same applies for the NZD/AUD rate. While we expect the NZD/AUD to stay within its three-year range of 0.99–0.88 for the foreseeable future (Figure 6), whether the NZ dollar rises to the top of that range or back to the bottom depends on which Reserve Bank is first to resume tightening. Our sense is that New Zealand is likely to overheat sooner than Australia, helping to support the NZ dollar. Given how elevated the NZD/AUD rate is relative to history, the upside for the NZ dollar is limited relative to the downside. Thus, partial hedging still seems the prudent choice.
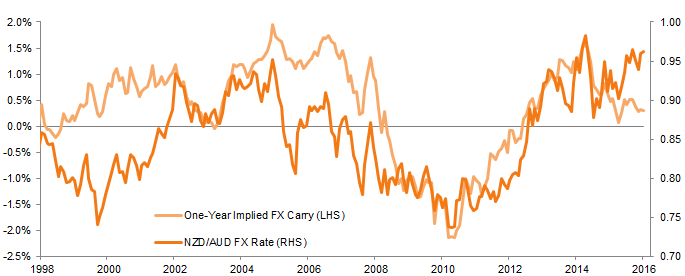
Figure 6. NZD/AUD Exchange Rate and Implied Carry
31 December 1998 – 31 December 2016
Source: Thomson Reuters Datastream.
Note: All data are monthly.
Equities: Now Fairly Valued, but Not Particularly Attractive
Global equities posted solid returns in 2016 despite the rocky start to the year and the short-lived ‘Brexit’ shock in June (Figure 7). The NZX 50 returned 8.8% for the year, but this masks the abrupt 13% sell-off over 7 September to 9 November, when rising global interest rates began to hit yield-sensitive asset classes (Figure 8). While the NZX 50 has since stabilised, NZ equites have not taken part in the ‘reflation trade’ that has driven global equities since the US presidential election. This is in contrast to Australian equities, which jumped 11% from the election to the end of 2016.

Figure 7. New Zealand and Global Equity Performance: Calendar Year 2016
Total Return (%) • Local Currency
Sources: MSCI Inc., Standard & Poor’s, and Thomson Reuters Datastream. MSCI data provided “as is” without any express or implied warranties.
Note: Total returns are gross of withholding taxes.
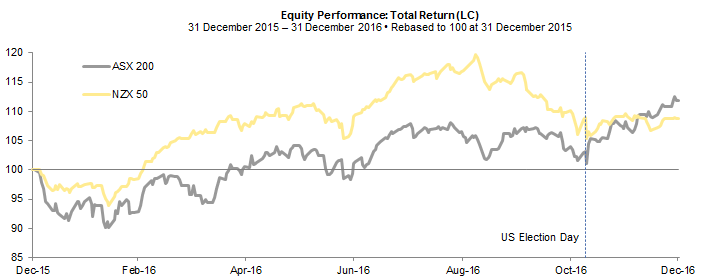
Figure 8. The Differing Post–US Election Fortunes of New Zealand and Australian Equities
Sources: MSCI Inc., Standard & Poor’s, and Thomson Reuters Datastream. MSCI data provided “as is” without any express or implied warranties.
The sell-off in NZ equities reflected elevated valuations, caused by the overshoot in global bond yields and related ‘defensive’ high-yield stocks that dominate the NZ market. For instance, by the end of August, NZ equities were 27% overvalued based on the return on equity–adjusted P/E ratio. The recent tumble has taken the froth out of the market, with valuations now 10% above historical median (Figure 9). Although this puts NZ equities back into the fair value range, we still do not find them particularly attractive, as the ‘reflation trade’ may have more to run in the near term.
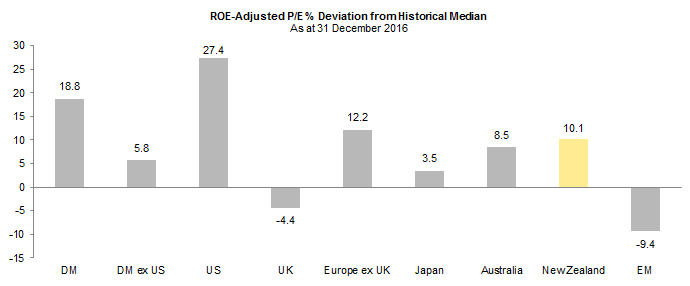
Figure 9. New Zealand and Global Equity Valuations
Sources: MSCI Inc., Standard & Poor’s, and Thomson Reuters Datastream. MSCI data provided “as is” without any express or implied warranties.
Notes: DM valuation is the weighted average of the United States, the United Kingdom, Europe ex UK, Japan, Australia, Singapore, Hong Kong, Canada, and New Zealand valuations. DM ex US valuation is the weighted average of the United Kingdom, Europe ex UK, Japan, Australia, Singapore, Hong Kong, Canada, and New Zealand valuations.
We still favour tilting portfolios toward ‘value’ strategies and markets, which means away from US equities and toward non-US developed markets and emerging markets equities. This also implies tilting away from New Zealand and toward Australia. However, the recent rally has lifted the valuations for several markets, leaving emerging markets equities the only clear ‘value’ opportunity globally. These low valuations reflect the real threat of rising trade tensions and a strong US dollar, which has historically been a headwind for emerging markets assets. European markets are no longer undervalued despite the political risks posed by upcoming elections and the United Kingdom’s Brexit negotiations. Japanese equities face their own challenges given trade and currency uncertainty.
Thus, it is hard to have conviction in any portfolio tilts, suggesting a cautious approach to positioning is warranted. A pullback in global markets seems likely as the euphoria over the prospect of large US fiscal stimulus fades, given that the economic impact of any legislation won’t be felt until well into 2018. In other words, the good news is likely already in the price and markets may be under-discounting the negative impact of protectionism and rising global interest rates.
Ultimately, global equities should grind higher over 2017, with the recent shift in market leadership from growth to value continuing. But expect investors’ newfound optimism to be tested.
Fixed Income: Remain Underweight Duration
NZ government bonds returned a decent 3.2% for 2016, despite suffering a 3.5% loss in the fourth quarter. Ten-year yields have jumped over 100 bps from their August lows to reach 3.37% at the end of December (Figure 10), reversing the entire yield rally since 2015. As a result, we now consider NZ government bonds fairly valued. This is not to say that yields won’t rise further, especially if inflation surprises to the upside or the RBNZ decides to tighten policy this year. But much of the overvaluation has been taken out of the market. We continue to advise that investors hold a mix of cash and government bonds to reduce overall duration risk while also benefiting from any rally in yields should current optimism on the reflation trade fade away. We would be more constructive on increasing duration risk if yields rose above 4.50%.

Figure 10. Ten-Year Government Bond Yields
31 December 2014 – 31 December 2016 • Percent (%)
Source: Thomson Reuters Datastream.
Note: All data are daily.
We are less constructive on global government bonds or investment-grade credit for NZ-based investors, as yields are not compelling relative to domestic fixed income. We are also not excited about global high-yield bonds given their current yields (sub-6%) and narrow spreads. We see better opportunities in private credit strategies. While these are not replacements for government bond exposure, for investors willing to lock up their capital this space is more compelling than traditional high-yield and other credit strategies at this juncture.
Conclusion
While the positive reflation story deserves the benefit of the doubt, investors should not get too excited because markets may have already priced in the positive impacts from potential fiscal stimulus, and under-discounted the negative impacts of protectionism and rising interest rates. For New Zealand and the global economy as a whole, 2017 may be as good as it gets, especially if fiscal stimulus and protectionism cause inflation to rise in 2018, forcing a more aggressive tightening in monetary policy. At the same time, a trade war between the United States and China would certainly have a negative impact on the global economy and New Zealand. For now, NZ-based investors should overweight ‘value’ by modestly tilting equity portfolios away from US and NZ equities and toward non-US, Australian, and emerging markets equities. Remain underweight duration by holding both cash and NZ government bonds, and also stay partially unhedged to benefit from any weakness in the NZ dollar.
Aaron Costello, Managing Director
Han Xu, Investment Associate
Index Disclosures
Cambridge Associates does not provide stock selection recommendations, and any reference to specific companies is not to be interpreted as a recommendation of that company as an investment option.
Global Dairy Trade Price Index
The Global Dairy Trade Price Index uses a weighted average of the percentage changes in prices. GDT price indexes are used to avoid the bias of a simple weighted average price, and to give a more accurate reflection of the price movements between trading events.
MSCI Australia Index
The MSCI Australia Index is a free float–adjusted, market capitalization–weighted index designed to measure large- and mid-cap equity market performance of Australia. The index covers approximately 85% of the free float–adjusted market capitalization available to foreign investors.
MSCI Emerging Markets Index
The MSCI Emerging Markets Index is a free float–adjusted, market capitalization–weighted index designed to measure large and mid-cap equity market performance of emerging markets. The index covers approximately 85% of the free float–adjusted market capitalization available to foreign investors. As of January 2016, the index includes 23 emerging markets country indexes: Brazil, Chile, China, Colombia, Czech Republic, Egypt, Greece, Hungary, India, Indonesia, Korea, Malaysia, Mexico, Peru, the Philippines, Poland, Qatar, Russia, South Africa, Taiwan, Thailand, Turkey, and the United Arab Emirates.
MSCI Europe ex UK Index
The MSCI Europe ex UK Index captures large- and mid-cap equity market performance across 14 developed markets countries in Europe. The index covers approximately 85% of the free float–adjusted market capitalization available to foreign investors across European developed markets, excluding the United Kingdom. The country indexes included are: Austria, Belgium, Denmark, Finland, France, Germany, Ireland, Italy, the Netherlands, Norway, Portugal, Spain, Sweden, and Switzerland.
MSCI Japan Index
The MSCI Japan Index is a free float–adjusted, market capitalization–weighted index that is designed to measure the large- and mid-cap equity market performance of Japan. The index covers 85% of the free float–adjusted market capitalization in Japan available to foreign investors.
MSCI New Zealand IMI Index
The MSCI New Zealand Investable Market Index (IMI) is designed to measure the performance of the large-, mid-, and small-cap segments of the New Zealand market. The index covers approximately 99% of the free float–adjusted market capitalization in New Zealand.
MSCI UK Index
The MSCI UK Index is a free float–adjusted, market capitalization–weighted index that is designed to measure the large- and mid-cap equity market performance of the United Kingdom; the index covers 85% of the free float–adjusted market capitalization in the United Kingdom available to foreign investors.
MSCI US Index
The MSCI US Index is designed to measure the performance of the large- and mid-cap segments of the US market. The index covers approximately 85% of the free float–adjusted market capitalization in the United States available to foreign investors.
MSCI World Index
The MSCI World Index is a free float–adjusted, market capitalization–weighted index designed to measure the large and mid-cap equity market performance of developed markets. The index covers approximately 85% of the free float–adjusted market capitalization available to foreign investors and consists of 23 countries: Australia, Austria, Belgium, Canada, Denmark, Finland, France, Germany, Hong Kong, Ireland, Israel, Italy, Japan, the Netherlands, New Zealand, Norway, Portugal, Singapore, Spain, Sweden, Switzerland, the United Kingdom, and the United States.
RBNZ QV Quarterly House Price Index
The RBNZ QV Quarterly House Price Index measures the movement in house prices for local council areas throughout New Zealand, providing an indicator of capital growth and how prices are trending in an area.
S&P/ASX 200 Index
The S&P ASX 200 Index is a free float–adjusted, market capitalization–weighted equity index that covers 80% of market capitalization in Australia available to domestic investors.
S&P/NZX 50 Index
The S&P/NZX 50 is a free float–adjusted, market capitalization–weighted equity index that covers 90% of market capitalization in Australia available to domestic investors.