The trajectory of US debt-to-GDP has sharply increased in recent decades, driven by significant fiscal stimulus in response to the Global Financial Crisis (GFC) and COVID-19 pandemic. Deficit spending remains elevated compared to typical levels outside of economic crises or wars, with official estimates predicting continued escalation, particularly if Trump’s presidential campaign promises are fulfilled. In this edition of VantagePoint, we explore the primary drivers of this debt increase, including demographics and rising net interest costs, and discuss how changes in economic conditions or policy could alter these projections. We also examine the complex relationship between debt dynamics and economic growth, highlighting the importance of productivity improvements and the potential role of inflation. We conclude with a discussion on the implications for investors. We believe a US debt crisis is not imminent and US Treasury securities should remain a useful diversifier. However, given the debt trajectory and expectations for increased fiscal spending under the Trump administration, close monitoring of the debt situation is prudent.
The Current State of US Public Finances
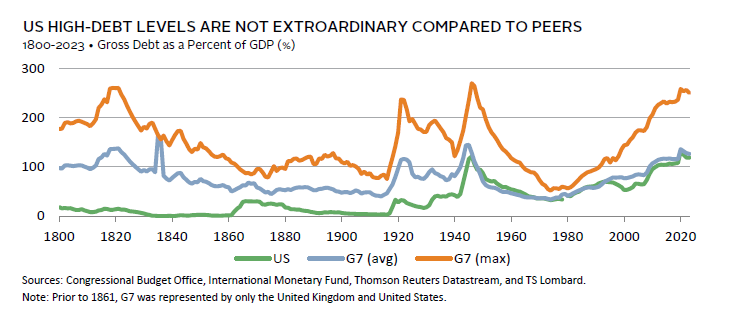
US government debt levels are elevated. Gross government debt[1]We generally rely on gross public debt for cross-country comparisons as it tends to have more data history and removes discrepancies in how net public debt is calculated across countries. Gross … Continue reading reached 119% of GDP as of fiscal year-end 2023, up from 108% of GDP in 2019 and 53% of GDP in 2000. Historically, the United States has experienced similar debt levels only once, following World War II (WWII).
While the current fiscal position is elevated, it is not unprecedented globally. At least one major developed country saw gross debt exceed 100% of GDP during 169 of the 224 years since 1800. Presently, the United States does not stand out among its peers in terms of debt levels and it is nowhere near the worst offender. However, the rapid growth of debt in the United States does stand out. The US fiscal deficit has exceeded 6% of GDP in three of the last four years, well above the average rate of 3.7% over the previous 50 years.
The Projected Trajectory of US Public Finances
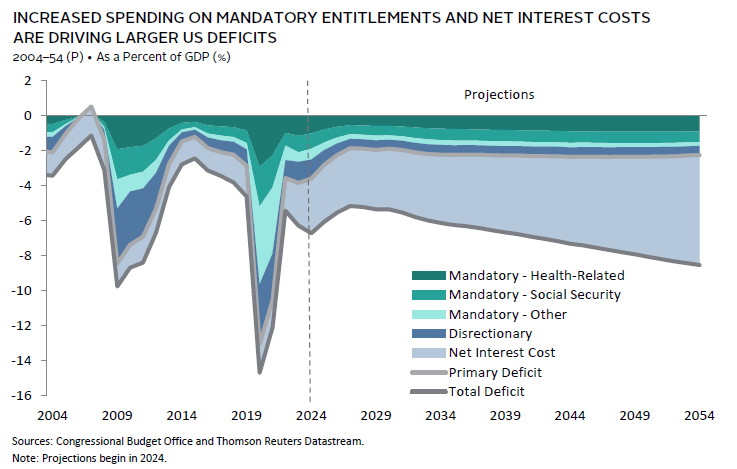
The future trajectory of US government debt is concerning, given large deficits are expected to persist. According to the Congressional Budget Office (CBO), the annual fiscal deficit will remain above 6% on average over the next three decades. If these projections hold, US gross debt-to-GDP could exceed 175% by 2054.
Over the previous two decades, the surge in debt was primarily driven by large primary deficits (i.e., total deficits ex net interest costs) tied to the fiscal response to both the GFC and COVID-19 pandemic. Going forward, primary deficits will remain larger than usual due to an increase in mandatory spending on health-related entitlements and social security as society ages. However, the primary source of the expected increase in debt is the rising cost of funding the debt itself. Net interest costs as a percent of GDP are expected to grow from 2.4% in 2023 to more than 6.0% by 2054 due to higher average interest rates on a much larger pile of outstanding government debt. As such, the United States will face larger deficits than typical even before accounting for the potential impact of another economic crisis or spending on discretionary items such as defense or the energy transition, two areas where costs could potentially be higher than expected in the future.
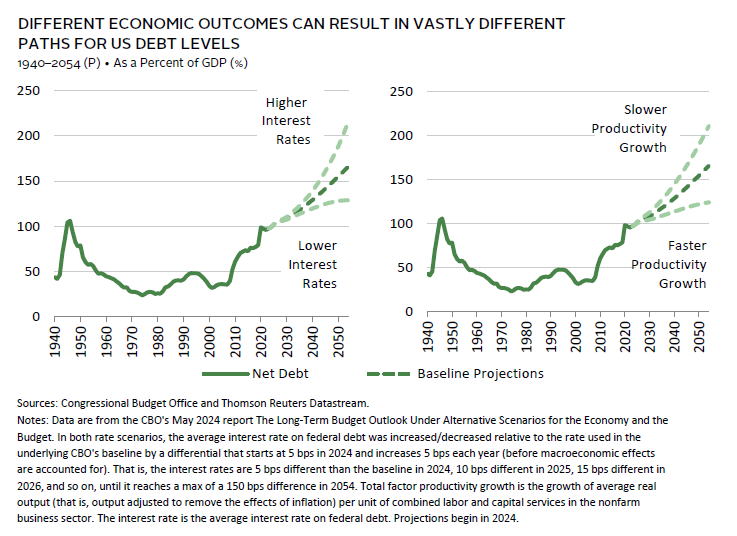
This outlook appears daunting, but it is important to remember that these are baseline projections. Outcomes could diverge significantly due to changes in legislation or economic conditions. Currently, neither major political party is focused on reducing the deficit, and President Trump’s proposed policies will likely widen the deficit. However, one or both parties could turn their focus to reducing the deficit in the future. If that happens, the United States arguably has more room to raise taxes and increase revenues to offset spending, as it has the lowest tax burden among G7 countries. The CBO’s forecasts of economic factors could also differ from actual outcomes. For instance, the chart below highlights how scenarios for various economic factors can lead to vastly different debt trajectories. If interest rates are lower than expected or government spending flows to more productive sources, then the debt burden could be reduced relative to what is expected.
In sum, plenty of uncertainty surrounds our understanding of the trajectory of public debt, even before considering the long list of known unknowns (e.g., advances in healthcare, artificial intelligence [AI], climate change, etc.) and their potential consequences. While we should exercise caution in interpreting these projections, we should not ignore them. How economies manage debt significantly impacts their prospects in the long term.
On the Brink of a Fiscal Crisis?
Whether US sovereign debt levels are problematic is a complex question, with various factors influencing the potential risks and implications. Academic research and empirical data suggest that there is no definitive debt-to-GDP ratio that inevitably leads to economic disaster. Debt sustainability largely depends on the interplay between deficit spending, interest rates, and economic growth, as well as the willingness of investors to continue to lend at reasonable interest rates. While the trajectory of US sovereign debt-to-GDP is concerning, it need not lead to crisis, particularly if economic growth remains above the public cost of debt and demand for US Treasury securities remains robust.
Must the Debt Keep Rising?
Governments have four main strategies to reduce debt-to-GDP ratios: practice austerity, increase real GDP growth, inflate the debt away, or outright default. Reducing debt through austerity is challenging, especially with rising costs from an aging population, climate change, and populist political pressures. Most policy makers abandoned austerity following the 2010s, when expansive monetary policy failed to offset tight fiscal policy, resulting in weak economic growth and little improvement in government debt ratios. Outright default is inconceivable in today’s global economy. This leaves growth and inflation, with growth as the most desirable path.
The post-WWII era saw debt-to-GDP decrease, supported by technological innovations and government investment in infrastructure and subsidies to veterans. While a repeat of this period is unlikely, initiatives like the CHIPS and Science Act and the Inflation Reduction Act aim to stimulate growth through investment in high-tech capacity and clean energy that could increase productivity. Although these initiatives may be curtailed under the next administration, other measures—such as reduced regulations—could also spur productivity.
Growth was only part of the post-WWII debt reduction equation. From 1946–74, government debt-to-GDP ratios fell from 119% to 23%. The government engaged in financial repression to cap interest rates below growth and ran a primary surplus averaging 1.3% of GDP annually. During each secular period of US government debt consolidation (1872–1916, 1946–74, and 1993–2001), the United States ran primary surpluses most years. The Trump administration, as noted above, is poised to continue to run primary deficits.
The relationship between interest rates and economic growth determines the pace of debt ratio improvement. Similar dynamics occur when debt-to-GDP rises. During the three secular periods of debt increases, the government ran mostly primary deficits. When interest paid on the debt was lower than GDP growth, the pace of debt increase slowed. Historically, US economic growth has often exceeded interest paid on the debt, a trend continuing since 2010.
Inflation is another tool for reducing debt; however, we don’t anticipate that the US Federal Reserve will pursue this unless necessary for financial stability. Higher policy rates increase interest expenses, as debt must be rolled over and more debt issued to meet expanded costs. Thus, the Fed might tolerate modestly higher inflation to avoid exacerbating the debt situation. Inflation could also rise through policy error, particularly if the Fed’s policy is too easy, potentially by underestimating higher productivity in neutral rates assessments. We expect inflation to continue its uneven and slow decline, at least for this economic cycle, but challenges remain. The economy operates at high-capacity utilization with full employment. Policy decisions—such as increased tariffs and reduced immigration—could pressure inflation, even if tariff effects are a one-off price increase.
With the United States running larger-than-typical peace time primary deficits, debt ratios are poised to increase. To the degree economic growth can continue to outpace interest on the debt, the trajectory can be slowed. At present, aggressively pursuing inflation or financial repression seems unlikely. Maintaining high demand for Treasury securities in the face of rising debt ratios will be paramount.
A BRIEF PRIMER ON DEBT SUSTAINABILITY
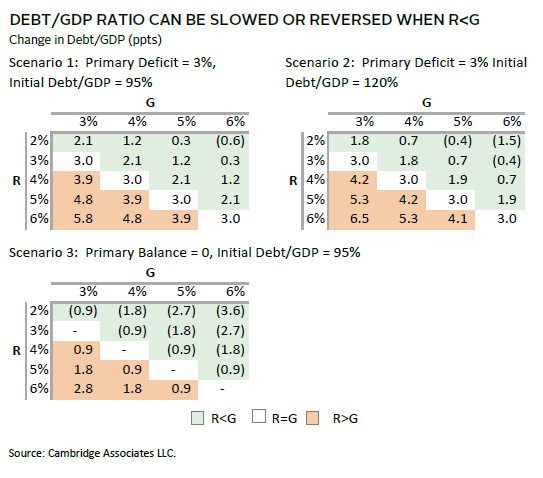
The following equation approximates the relationship between the change in debt-to-GDP (Debt/GDP) levels over time, the cost of debt (R), GDP growth (G), and the primary balance (tax revenue less non-interest spending as a percentage of GDP):
Debt/GDP(t) – Debt/GDP(t-1) = [(R – G)/(1 + G)] * Debt/GDP(t-1) – primary balance
For the Debt/GDP ratio to be constant over time, the primary balance must equal:
[(R – G)/(1 + G)] * Debt/GDP(t-1)
As shown in the scenarios below, if the cost of debt equals GDP growth (R=G), the change in Debt/GDP will equal the primary balance. If the cost of debt is greater than GDP growth, debt dynamics are more challenging, with Debt/GDP increasing by more than the primary deficit. However, if GDP growth is above the cost of debt, then Debt/GDP increases by less than the primary deficit. If the spread between GDP growth and interest expense is wide enough, the US government can continue to spend (net of interest expense) more than it earns without increasing Debt/GDP. Further, and perhaps unintuitively, the larger the Debt/GDP, the larger the sustainable primary deficit.
The Pivotal Term Premium
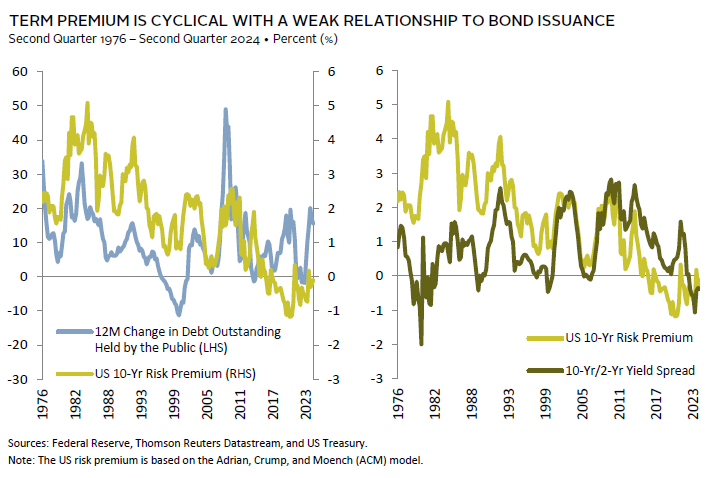
Concerns about deficit deterioration have risen as the term premium on bonds has turned positive. Some prominent investors predict that US Treasury securities are headed for trouble as investors demand higher yields due to rising debt issuance. They argue the increase in issuance will push up the term premium, raising the government’s cost of debt and necessitating further debt issuance to finance the deficit. If this were to come to pass, the secular decline in the term premium—which began in 1984—would be giving way to a new regime of secular increases. We believe that this risk is overstated.
To assess these predictions, we examine the complex relationship between the term premium and Treasury bond issuance (adjusted for Fed balance sheet operations). Bond yields are influenced by two main components: expectations about the path of short-term rates over a bond’s maturity and the term premium. The path of short-term rates is influenced by the real yield and inflation expectations. The term premium is the difference between a bond’s actual yield and the expected path of short-term rates over its maturity. As such, it reflects the uncertainty in macroeconomic conditions, Fed policy, and the demand for bonds as safe assets.
The relationship between Treasury issuance and the term premium is generally weak and varies over time. The term premium is highly cyclical and tends to rise amid economic uncertainty as the Fed lowers short-term rates and the yield curve steepens, which is the situation we are seeing today. Current economic conditions feature a bumpy decline in inflation and concerns of slowing growth. In short, the rise in the term premium should be expected under such conditions and would persist regardless of debt issuance.
Longer term, several structural factors could bias the term premium to increase. Should stock/bond correlations become elevated, the demand for Treasury bonds would diminish as bonds would provide less ballast to portfolios.[2]For a comprehensive study on the relationship between the term premium and Treasury supply, see Steve Hou, “When is the Supply Effect Large in the Government Bond Market?” Department of Economics … Continue reading Under such conditions, investors will demand higher yields to invest in bonds rather than hold cash as the safe asset. Positive stock/bond correlations are more likely during periods of inflation driven by supply shocks that allow inflation to persist despite sagging demand. Outside of the pandemic, inflation has been demand driven since the 1980s. Such procyclical inflation has supported negative stock/bond correlations, boosting demand for Treasury securities as diversifiers and putting downward pressure on the term premium.
We see elevated risk of supply shortages in the future due to potential disruptions from global supply chain reconfiguration, climate change, shifting energy infrastructure, and geopolitical stresses, including war. Counteracting these risks are supply-enhancing disruptions, such as advances in AI and quantum computing and increased infrastructure investments. At the same time, US Treasury securities remain the dominant safe asset globally, and demand for safe assets continues to rise, scaling with global GDP growth. On balance, these structural forces suggest the term premium will be higher than in the previous decade, but not as high as it was in the 1970s–80s when macro and policy uncertainty peaked. While the jury is still out on these long-term trends, the near-term movements of the term premium are consistent with economic conditions and not alarming.
In Search of Fiscal Space
While the term premium component of the cost of debt has historically been more influenced by cyclical factors than by debt issuance, this may not always hold true. Eventually, the supply of treasuries could exceed demand, increasing term premiums and straining debt sustainability. Although we do not see this as an immediate concern, it is worth monitoring over time.
There is no specific debt-to-GDP ratio at which debt becomes problematic. Instead, various factors determine the appeal of a sovereign’s debt. These include low tax rates relative to other countries allowing room for potential increases without harming competitive positioning; sustainable strong economic growth that can generate tax revenues at reasonable rates; and the ability to issue debt in domestic currency or hold plentiful assets (e.g., foreign exchange reserves, foreign stocks, and bonds). The United States scores well relative to other nations on these factors along with providing a stable currency and political environment, strong military, deep and liquid capital markets, and a large domestic economy. These characteristics significantly enhance investor confidence in the nation’s debt. However, the United States’ low domestic savings, particularly in the public sector, require it to attract financing both from overseas and domestically from the private sector.
The United States is Special
No country is immune to a decline in investor appetite for their sovereign debt, especially if reliant on foreign investment and price-sensitive buyers. The United States relies heavily on foreign purchases of debt to support its low net savings rate, which has hovered around 3% of GDP since 1992. However, the United States, as the home of the reserve currency and the deepest, most liquid sovereign bond market, has seen a persistent demand for Treasury securities. A sustained reversal in fortune would require investors to lose confidence in the United States as a safe haven.
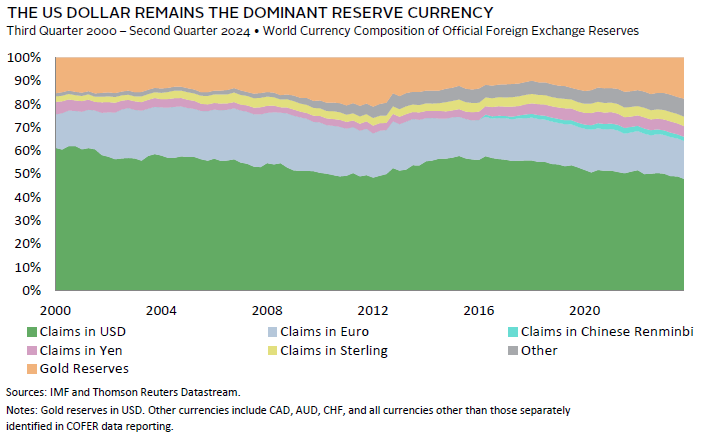
Strong geopolitical alliances and attractive US capital markets support the United States’ central role in the global economic order. The rest of the world owns about 23% of US sovereign gross debt and as high as 40% of US public and private equities. In other words, the rest of the world has a strong vested interest in supporting US assets, or at least in ensuring a slow transition. While the United States benefits from a high demand for safe assets, particularly in US dollars, the rest of the world benefits from US capital markets and the stability of the US dollar, with no viable alternative to the greenback as the dominant reserve currency. The United States continues to dominate foreign exchange reserves, holding 46%, despite a decline in its share of global GDP. The dollar also remains the leading currency for global credit issuance outside the United States and for trade invoicing outside of Europe, where the euro is predominantly used for regional trade. Any moves away from the US dollar will be gradual. For example, the development of alternatives to the Society for Worldwide Interbank Financial Telecommunications (SWIFT) system has been limited but is slowly expanding. Another response to the United States’ use of the dollar as a tool for geopolitical influence has been the rise of gold in reserve currency holdings.
Because of the global integration of the US dollar and US Treasury securities in the financial and economic system, it is likely that any crisis in the US sovereign debt market would trigger intervention by officials in other economies. Further, as investors continue to demand safe assets, US Treasury securities are supported by their relative appeal.
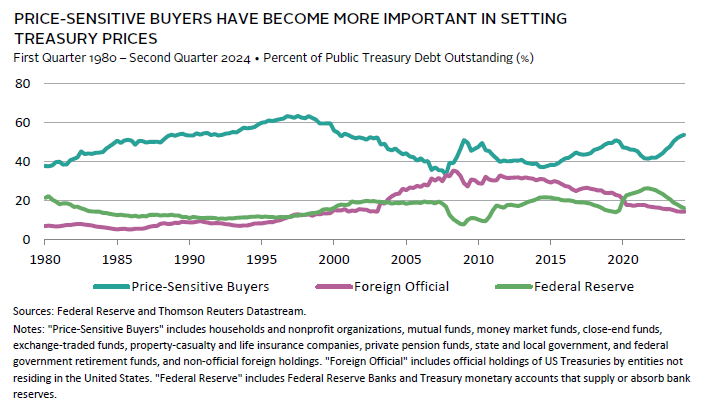
However, we are watching the composition of ownership of US Treasuries. In recent years, as the Fed stopped quantitative easing and turned to shrinking its balance sheet, price-sensitive buyers have had more influence on setting prices. Such buyers include asset managers, hedge funds, pension plans, and insurance companies. Yet, price sensitivity cuts both ways. A small increase in rates can attract a significant amount of capital as we have seen in the period since quantitative easing gave way to quantitative tightening. At the same time, price-sensitive buyers can introduce more volatility. Indeed, hedge funds have become a significant marginal buyer, with much of their demand coming in response to bond managers that prefer owning futures over cash bonds. Hedge funds take the short futures positions and pair them with leveraged long cash bonds in relative value trades. This creates some vulnerabilities that can be accentuated during unexpected macro events. The Fed has stepped in to address such volatility in the past, and we anticipate their continued involvement in stabilizing conditions as necessary.
Investment Advice
Concerns about a US fiscal crisis are overstated. Despite alarming headlines about rising US debt, investors should resist making drastic portfolio changes. While an immediate crisis appears unlikely, the risk could increase if the United States fails to manage its debt effectively. Therefore, reviewing potential portfolio adjustments at the margin that might enhance future returns is prudent. The challenge is finding a “safe” alternative to US Treasury securities today. Most of the alternatives we assessed are not attractive substitutes, but this could change as the US debt situation evolves.
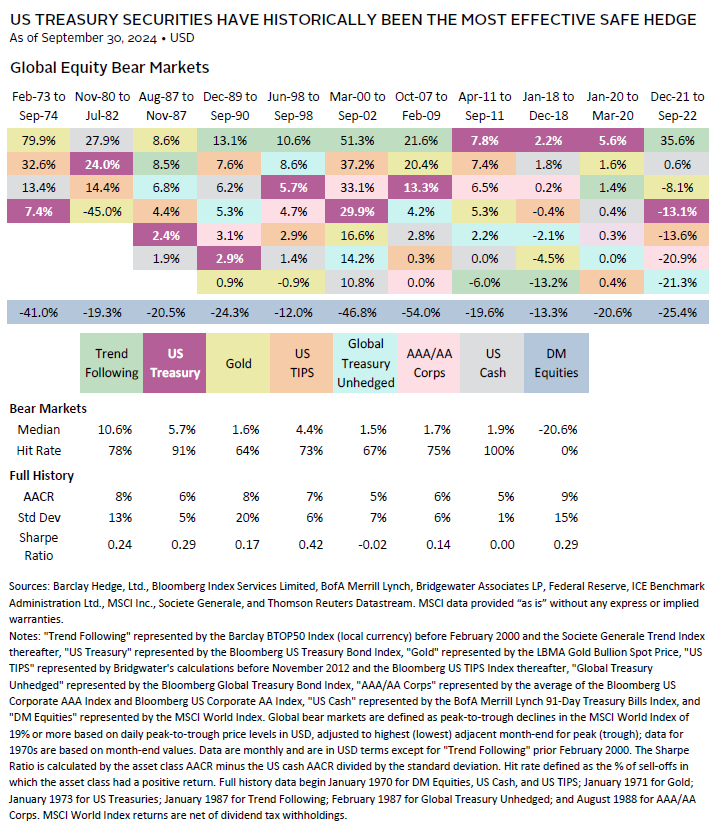
Historically, US Treasury securities have served as the most effective hedge, offering liquidity, stability during equity sell-offs, and reasonable returns with low volatility. However, this track record occurred during a period of declining interest rates and prevalent deflationary shocks. In a more volatile rate environment, where supply-induced shocks occur frequently or fiscal risk rises, the effectiveness of US Treasury securities may diminish. When exploring alternatives, a few assets stand out, though none are a perfect substitute. In a US fiscal crisis, investors might diversify their high-quality government bond and currency exposure away from the United States using unhedged global Treasury securities to mitigate country-specific risks. However, unhedged global Treasury securities have underperformed in previous global equity sell-offs and across cycles. Additionally, several other developed economies face similar fiscal concerns. Some, like Australia and Switzerland, maintain better fiscal positions and offer relatively stable bond markets, but each presents its own country-specific risks. Other fixed income alternatives—such as inflation-linked bonds, AAA/AA investment-grade corporate bonds, and emerging markets local currency debt—also present drawbacks. While some provide better insulation from a US fiscal crisis, many remain vulnerable to other supply-induced shocks. Inflation-linked bonds may be an exception, given their attractive real yields today, but they still carry risk under this scenario as they are issued and backed by the US government.
Outside fixed income, most assets also fall short of US Treasury securities. Cash is reliable but has limited return potential in a sell-off, while gold proves less reliable and more volatile. We remain cautious about chasing the recent outperformance of both cash and gold compared to US Treasury securities. Trend-following hedge fund strategies are appealing due to their liquidity and strong performance in sell-offs and across cycles, though they are more volatile and not a direct substitute for Treasury securities. These strategies can also capitalize on future shifts in market trends, such as fiscal risk. Those with significant hedge fund allocations might consider a modest allocation to trend-following to complement traditional bond holdings.
Prudent investors should stay vigilant and regularly discuss how to diversify their portfolios to mitigate potential risks. In our view, US Treasury securities remain the most effective hedge today. However, while the risk of a fiscal crisis is not immediate, potential scenarios exist where US Treasury securities may serve as a less effective hedge in the future. By exploring a range of asset classes and strategies, investors can better prepare themselves to navigate future uncertainties.
Celia Dallas, Chief Investment Strategist
TJ Scavone, Senior Investment Director, Capital Markets Research
David Kautter and Grayson Kirk also contributed to this publication.
Index Disclosures
Barclay BTOP5O Index
The BTOP50 Index seeks to replicate the overall composition of the managed futures industry with regard to trading style and overall market exposure. The BTOP50 employs a top-down approach in selecting its constituents. The largest investable trading advisor programs, as measured by assets under management, are selected for inclusion in the BTOP50. In each calendar year the selected trading advisors represent, in aggregate, no less than 50% of the investable assets of the Barclay CTA Universe.
Bloomberg Global Treasury Index
The Bloomberg Global Treasury Index tracks fixed-rate, local currency government debt of investment-grade countries, including both developed and emerging markets. The index represents the treasury sector of the Global Aggregate Index. The index was created in 1992, with history available from January 1, 1987.
Bloomberg US TIPS Index
The Bloomberg US TIPS Index is a rules-based, market-value weighted index that tracks inflation protected securities issued by the US Treasury.
Bloomberg US Treasury Index
The Bloomberg US Treasury Index measures US dollar-denominated, fixed-rate, nominal debt issued by the US Treasury. Treasury bills are excluded by the maturity constraint but are part of a separate Short Treasury Index. STRIPS are excluded from the index because their inclusion would result in double-counting. The US Treasury Index is a component of the US Aggregate, US Universal, Global Aggregate, and Global Treasury Indexes. The index includes securities with remaining maturity of at least one year. The US Treasury Index was created in March 1994, and has history back to January 1, 1973.
BofA Merrill Lynch 91-Day Treasury Bill Index
The BofA Merrill Lynch 91-Day Treasury Bill Index is an unmanaged index that tracks the performance of Treasury bills.
LBMA Gold Bullion Spot Price
The LBMA Gold Price is a global benchmark for the price of unallocated gold delivered in London. The price is set twice a day in US dollars per fine troy ounce of 995 gold, at 10:30 AM and 3 PM London time
MSCI World Index
The MSCI World Index represents a free float–adjusted, market capitalization–weighted index that is designed to measure the equity market performance of developed markets. It includes 23 developed markets (DM) country indexes. DM countries include: Australia, Austria, Belgium, Canada, Denmark, Finland, France, Germany, Hong Kong, Ireland, Israel, Italy, Japan, the Netherlands, New Zealand, Norway, Portugal, Singapore, Spain, Sweden, Switzerland, the United Kingdom, and the United States.
Société Générale Trend Index
The Société Générale Trend Index is equal-weighted and reconstituted annually. The index calculates the net daily rate of return for a pool of trend following based hedge fund managers.
Footnotes
