Every year, we take a fresh look at the themes and drivers likely to influence capital markets and, along with our valuation analysis, inform our asset allocation recommendations. Heading into 2015, we identified five trends that influenced our advice: US dollar strength, weakening commodity prices, elevated US equity valuations, extremely low sovereign bond yields, and crosswinds for credit.[1]These themes were outlined in our January 21, 2015, client web event “Shifting Sands—2015 Outlook.” Many were elaborated on in our December 5, 2014, publication “Five Key Questions for … Continue reading These trends continue to influence our views.
In this report, we focus on three key areas for investors’ portfolios: (1) developed markets equities, where the stage appears set for more US underperformance; (2) emerging markets equities, where risks are foremost in investors’ minds and where we continue to see opportunities for investors that can focus on the horizon rather than the waves; and (3) commodity-related assets, which suffered mightily in 2015 and may not be quick to recover.
Bouts of volatility, as experienced this year, should serve as a reminder of the evergreen principle that portfolios should be aligned with risk tolerance and return objectives. Such alignment is critical to allow asset owners to withstand volatility and to take advantage of opportunities that may arise.
How the themes discussed in the pages ahead develop over the course of 2016 will affect our recommended positioning to risk assets overall, where we remain neutral today, as well as recommendations for value-related tilts. Watch for the first quarter 2016 edition of VantagePoint, publishing in mid-January, for our total portfolio advice.
Developed Markets Equities: Setting the Stage for More US Underperformance
Wade O’Brien, Managing Director
Investors in developed markets equities may find that 2016 plays out similarly to the last 12 months, as valuations have not shifted materially and relative earnings trends are expected to stay intact across markets. The significant uptick in volatility witnessed in recent months also seems likely to persist into next year. Uncertainty over emerging markets growth models, developed markets monetary policy, and commodity prices will not easily be resolved, in part because there are few historical precedents for current conditions. Macro themes will remain relevant for developed markets investors next year; to what degree depends on the country and market in question.
Heading into 2016, we maintain our constructive view on equity markets like the Eurozone and Japan, where fundamentals remain attractive and the chance of policy support continues to create a more supportive macro backdrop. However, with tailwinds such as currency depreciation fading, these markets’ potential for outperformance versus US equities may be narrowing. Given the potential for global equity returns to be lower in 2016 in light of slightly softer earnings growth, we encourage investors to leave no stone unturned in looking for opportunities.
Growth Likely to Support Earnings in 2016, but Dollar Strength May Wane
The growth scare that caused the widespread market sell-off at the end of the third quarter was sparked mainly by weaker economic data from developing economies like China, but also signs of softness in developed countries like the United States and Japan. Supported by soothing comments from central bankers and slightly better economic data, markets have since rebounded (Figure 1), allowing fundamentals like valuations and earnings growth to reassert themselves.
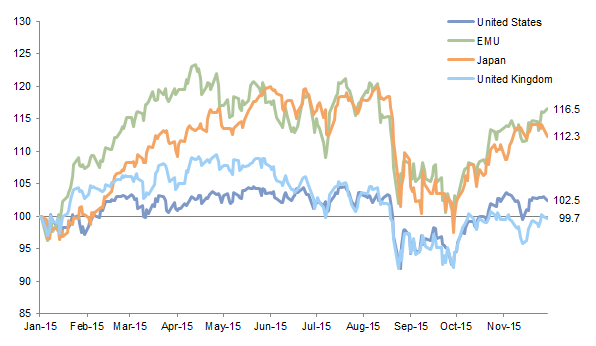
Figure 1. Cumulative Wealth of Global Equity Markets
January 1, 2015 – November 30, 2015 • Local Currency • Index Level = 100 on January 1, 2015
Sources: MSCI Inc. and Thomson Reuters Datastream. MSCI data provided “as is” without any express or implied warranties.
Note: Total returns for developed markets are net of dividend taxes.
Economic growth is expected to modestly accelerate in 2016, providing a supportive backdrop for earnings growth. While the International Monetary Fund (IMF) and others have slightly lowered their estimates for 2015 and 2016 growth, the expected 2.2% developed world growth rate in 2016 should still exceed the average of the last decade and is double the rate seen as recently as 2013 (Figure 2). Countries that were in recession as recently as 2014, like Japan, are expected to grow around 1% in 2015, with slightly faster growth expected in the Eurozone and the United States. Emerging markets growth, which faded in 2015 and appears set to end the year at the lowest level in the past six years, is expected to rebound to 4.5% in 2016, which should provide a more fertile environment for developed markets exporters.

Figure 2. Developed and Emerging Markets GDP Growth
2005–16 • Percent (%)
Source: International Monetary Fund – World Economic Outlook Database.
Note: Mean represents average GDP growth between 2005 and 2014; (f) indicates forecast.
* Developed markets GDP contracted by 3.4% in 2009.
The monetary policy divergences that started to form in 2015 should gradually gather pace in 2016. Dovish central banks such as the European Central Bank (ECB) have taken action over the course of 2015 to weaken currencies and try to spur economic growth, while more hawkish peers such as the US Federal Reserve have signaled their desire to begin exiting the low interest rate environment. Looking ahead to 2016, the ECB and Bank of Japan (BOJ) are likely to do more, and the former confirmed in early December it will expand its asset purchases given its discomfort with current currency strength and inflation levels.
The degree of US$ appreciation against the euro and yen may be less than that seen over the last 12 months for several reasons. Both the Eurozone and Japan are generating healthy current account surpluses, meaning that foreign demand for their goods and services translates into support for their currencies. Growth in the former has surprised to the upside and may strengthen further if households continue to benefit from low commodity prices. The timeline for expected US interest rate hikes also has been pushed back, both because inflation has remained muted and because of volatility in offshore markets. The Fed is now expected to hike before the end of 2015, but long-end US interest rates seem unlikely to rise substantially in 2016 as inflation pressures remain subdued, curbing interest rate differentials between the United States and other regions and in turn demand for US fixed income assets. The US dollar looks increasingly overvalued versus peers, though currencies can deviate from fair value for extended periods of time.
Currency markets will be impacted by commodity prices, which over the course of 2015 helped keep inflation in check and thus facilitated dovish monetary policy. While the direction of oil prices is hard to predict, if oil remains within its current range, this will continue to offer leeway (by keeping inflation at bay) to central banks like the ECB and BOJ to retain an easing bias. Oil remaining lower for longer may also encourage consumers globally to boost consumption, which in countries like the United States accounts for around 70% of GDP. Spending on crude oil has fallen more than 50% since 2011 to just 2% of global GDP, freeing up as much as $2 trillion in annual spending power by oil consumers, according to Barclays data. How long this trend continues and how this windfall is used have important implications for corporate earnings and relative equity market performance.
Relative 2015 Performance Largely Driven by Earnings
Relative equity performance year-to-date has been driven primarily by earnings results across regions (Figure 3), with equity valuations playing a secondary role. US large caps, which have returned 2.5% year-to-date through November 30, have been weighed down by flat earnings growth. In contrast, the 15.4% return for Eurozone large caps is slightly above expected earnings growth (11%), while Japanese large caps actually derated as their 12% return so far in 2015 has trailed their 19% expected earnings growth.
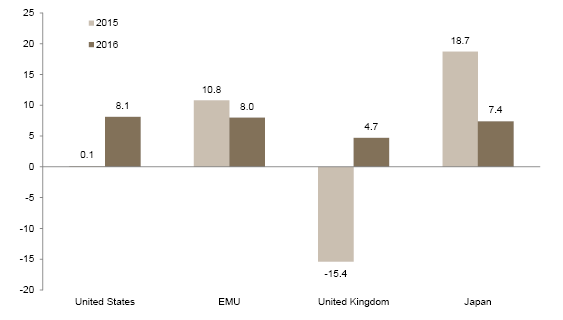
Figure 3. EPS Growth Expectations
Percent (%)
Source: J.P. Morgan Securities, Inc.
Notes: Forecasts are as of November 30, 2015. Japan refers to fiscal years 2016 and 2017.
Developed large-cap stocks overall slightly trail small-cap peers thus far in 2015, though performance varies across markets. US small caps are trailing large-cap peers by more than 200 bps given stronger earnings growth but exaggerated valuations. The FTSE® 250 has outperformed the FTSE® 100 by over 1,000 bps through the end of November, as the decline in UK small-cap profits (around 8% expected for the calendar year) was muted relative to that of large caps. In the Eurozone, healthy earnings also allowed small caps to outperform and justified high valuations; the consensus expects EMU small caps to see a staggering 19% increase in 2015 profits.
Eurozone and Japanese large-cap earnings have benefitted from recovering domestic growth but also from currency depreciation (Figure 4), which boosts the value of offshore revenues earned by companies from these regions. Conversely, strong currency countries like Switzerland, the United Kingdom, and the United States have seen the value of foreign sales drop, weighing on overall index earnings. This headwind has been significant; Barclays estimates that the strong US dollar has shaved 5%–6% off of S&P 500 revenue growth in recent quarters. Lower interest rates in a number of developed markets have also boosted company bottom lines by lowering debt servicing costs, though in the United States at least some of the benefit has been offset by rising debt levels.

Figure 4. FX Depreciation Against the Dollar
August 31, 2014 – November 30, 2015
Source: Thomson Reuters Datastream.
Earnings for 2015 should be viewed in the context of longer-term trends; notwithstanding their 2015 recovery, Eurozone profits are still around 40% below 2007 highs, while US and (to a lesser extent) Japanese earnings have moved comfortably above previous peaks. Earnings data in 2015 also reflect idiosyncratic company-specific dynamics and weights for the energy and materials sectors, which have suffered from lower commodity prices. For example, the contribution from energy stocks to S&P 500 earnings fell roughly 60% in 2015 according to data from Deutsche Bank, while the Japanese index suffered a much smaller drag given the sector’s low weighting.
US Valuations Offer Less Protection Than Those in Europe and Japan
US equities were overvalued going into the start of 2015 and valuations have changed little since then; on November 30, the normalized price-earnings ratio (P/E) for the MSCI US Index was in the top 20% of observed valuations (Figure 5). Stretched valuations are likely to again impact return potential in 2016, putting pressure on earnings to justify performance. In contrast, Eurozone valuations have slightly richened over the course of the year but remain only slightly above their historical median, offering upside potential if earnings do not disappoint. UK equities, inexpensive going into 2015, have actually rerated lower over the course of the year, a reminder that valuations by themselves are typically not enough to drive outperformance in the near term. Japan continues to offer valuations that are in line with or below historical averages depending on what metric is used; normalized metrics look fair value, and the trailing P/E of 16.5 is below its recent average.
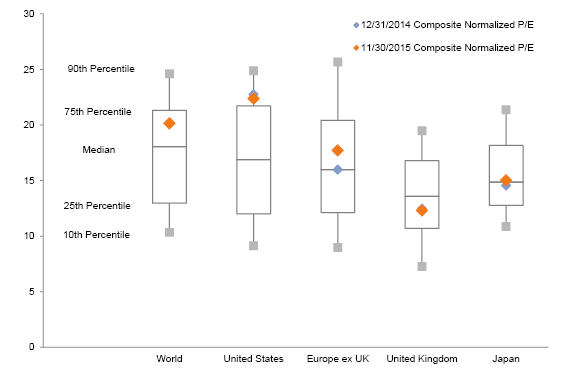
Figure 5. Composite Normalized P/E Ratios by Region
Sources: MSCI Inc. and Thomson Reuters Datastream. MSCI data provided “as is” without any express or implied warranties.
Notes: The composite normalized price-earnings (P/E) ratio is calculated by dividing the inflation-adjusted index price by the simple average of three normalized earnings metrics: ten-year average real earnings (i.e., Shiller earnings), trend-line earnings, and return on equity (ROE)–adjusted earnings. We used the post-2001 ROE-adjusted P/E for Japan. All data are monthly.
Multiples for developed small-cap equities have dipped slightly in most regions over the course of the year, though they remain overvalued in most markets. US small caps are the most extreme example. At 32 times normalized earnings, the composite P/E was over the 90th percentile of historical figures as of November 30, which helps explain why small caps might underperform for the second straight year. Developed small caps outside the United States also look expensive relative to their more limited history, but with significant variation across regions. Japanese small caps appear to offer the best combination of valuations and earnings potential; their 1.2 times price-to-book (P/B) ratio is only slightly above its historical median and reflects a 10% discount to large caps. Meanwhile, EMU small caps are only marginally cheaper than expensive US equivalents on both a trailing and normalized basis, trading at 30 times trailing earnings and 1.8 times book value. Finally, UK small-cap valuations offer mixed messages depending on the multiple used, but both the trailing P/E and P/B multiple are above their historical medians.
Mid-Single-Digit Earnings Expected for Large Caps; Small Caps Expected to Do Better
Next year the consensus expects S&P 500 profits to rise around 8%, in part because the dollar will generate a smaller headwind for multinationals. The IT sector (which is both the largest contributor to overall index earnings and the sector most reliant on foreign earnings) is expected to set the pace, with smaller IT firms seeing profits rise faster than mega-cap peers. If large-cap IT earnings disappoint, this may weigh on overall market returns; in 2015 four large IT firms alone generated around 80% of the S&P 500’s (modest) total return (Figure 6). Consensus expectations are for the consumer discretionary sector to generate the fastest earnings growth (15%), though excluding the impact of online retailing behemoth Amazon, the result is expected to be far more modest. The energy sector is no longer expected to post any earnings growth, but this will still mark a dramatic shift from its significant drag in 2015.

Figure 6. Year-to-Date Contribution of Top Ten Stocks to S&P Total Return
As of November 30, 2015 • Percent (%)
Sources: FactSet Research Systems and Standard & Poor’s.
Risks to this rosy US earnings outlook appear tilted to the downside. Margins look stretched on a historical basis and are now being squeezed by low top-line growth and rising wages as labor markets tighten. Higher interest rates and thus debt-servicing costs could also come into play. Energy sector estimates have been declining for months as oil prices seems likely to stay lower for longer. Additionally, financials (which generate around 20% of index profits) may struggle to generate high single-digit growth as the tailwind of reserve releases is fading, while low interest rates may crimp interest income.
Eurozone profits are expected to rise 8% in 2016 based on the consensus, with support from several directions. Healthier economic growth has allowed operating leverage to kick in across a variety of sectors. Rising profits for the consumer discretionary sector reflect higher auto sales, and currency weakness benefits this and other export-oriented sectors by increasing the value of foreign sales. The latest consensus figures suggest profit growth for financials is expected to slow to 7% in 2016 as recent announcements from investment banks have been grim, but underlying trends in credit demand are improving and extraordinary charges are fading. Domestic sectors could help insulate overall index earnings if currency weakness fades as a driver; fading deflation fears mean firms in sectors like telecoms and utilities finally have been able to lift prices and boost margins. Low interest rates have reduced corporate borrowing costs and flattered bottom lines, encouraging consumers and companies to expand activities. Similar to the United States, consensus only expects the energy sector to see a modest 1% recovery in earnings next year, reducing the risk of disappointment should energy prices take another leg down.
After a woeful 2015, UK earnings are expected to rebound around 5% next year, but the margin of error seems high given the uncertain path of commodity prices and high index weights for energy and materials stocks. Further, UK profits seem less likely to be supported by currency weakness than Eurozone equivalents, and the operating leverage argument is harder to make for UK companies, as domestic growth has been reasonably robust in recent years.
An important wildcard for European profits is the health of emerging markets in 2016. Estimates vary, but European companies may derive at least 21% of their revenue from emerging markets (the number may be higher in the United Kingdom), according to Deutsche Bank and Goldman Sachs data, and have suffered from the region’s slowdown and currency devaluations that lower the value of sales from the region. European (Eurozone and United Kingdom) financials with large lending exposure could also be threatened by a slowdown in emerging markets that weakens company credit fundamentals. European banks have around $3.0 trillion of exposure to emerging markets according to data from Bridgewater, more than three times the US equivalent, though much of this is concentrated in a handful of banks. The risk of losses is mitigated by several factors, including relatively low exposure to China, where debt levels have grown the most dramatically. Still, a sharp downturn in emerging markets (perhaps precipitated by a Chinese hard landing) would likely hamper many emerging markets companies and spill over into losses for European lenders.
Slightly lower earnings expectations for Japanese profit growth in 2016 should be seen in the context of robust gains over the past several years. Corporate governance reforms have encouraged a renewed focus on return on equity, with eligibility for listing on the new JPX-Nikkei 400 stock index based in part on this metric. Japanese corporate earnings growth has outpaced lackluster domestic economic growth, boosted in part by the weaker yen. A stronger currency could challenge earnings growth for some sectors, though better domestic conditions in part due to rising wages could help offset this headwind. The threat of a stronger currency may be somewhat overblown, as consensus estimates for Japanese companies next year appear to show little relationship between foreign revenue exposure and earnings growth.
Across the larger developed markets, small-cap earnings growth in 2016 is expected to exceed that of large caps, though in some markets these estimates may again prove too optimistic. The consensus 20% expected growth for US small caps (Russell 2000®) seems especially vulnerable and comes on the back of a large earnings miss in 2015. In contrast, the median earnings growth expectation for small- and mid-cap Japanese (Topix) companies is around 12%, which leaves some upside in light of their domestic orientation if higher wages and better employment conditions help consumption pick up. The expected 14% growth in UK small-cap earnings will be assisted by the 2015 drop, which creates a lower base for comparison. In most markets small-cap earnings will be more insulated from currency fluctuations than large-cap equivalents given higher domestic revenue; lower commodity exposure in these indexes may also prove advantageous.
Despite Concerns, Buybacks and Dividends Likely to Continue to Support Stocks in 2016
Financial engineering has been a hot topic in 2015, with many analysts voicing concern that growing debt burdens may present challenges in 2016 if interest rates rise or capital markets become less accommodating. While some statistics suggest that balance sheets are weakening, others paint a more positive picture, as even in markets like the United States fundamentals are better than might first be suspected.
US corporate health has been under particular scrutiny as of late, as the Fed is soon expected to begin a series of rate hikes, and data suggest that cash flow no longer covers buybacks. Leverage can be measured various ways; net debt as a percentage of equity has risen but remains close to historical averages, as does net debt/EBITDA (Figure 7). Leverage metrics incorporating cash flow have worsened for energy and materials, though these metrics may improve in 2016 if commodity prices can rebound. Cash positions also look reassuring. S&P 500 companies are currently sitting on around $1.5 trillion of cash, according to data from FactSet, MSCI, and Thomson Reuters Datastream though much of this is concentrated in a relatively small number of firms.

Figure 7. Net Debt
2000–14
Source: Thomson Reuters Datastream.
Note: Data are annual.
Eurozone leverage ratios are higher than those in the United States. However, analysts are sounding fewer alarms due to the likelihood of Eurozone interest rates remaining subdued for some time. Despite high cash balances, a significant increase in European buybacks may not be in the cards. European executive compensation is not as closely tied to share performance as it is for US peers, so dividends (which are higher in Europe) remain a preferred way of maintaining investor support. Less visibly, relative to US firms, many European firms are more insulated from activist investors via large family or government stakes, reducing the onus to boost payouts.
Expectations for higher payouts have also boosted Japanese equities. Japanese companies have deleveraged in recent years and boast the highest cash positions among peers. Japanese companies have historically preferred to save this cash or reinvest in cap ex rather than increasing payouts to shareholders, but rising pressure on companies to increase payouts is succeeding. For the current fiscal year (ending March 2016), Topix first section companies are expected to return around ¥14 trillion to investors according to Nippon Value Investors, which still would only equate to around 4% of market cap. Trends are moving in the right direction—for fiscal year 2017 buybacks alone could reach ¥7 trillion, based on data from Goldman Sachs. Distributions to investors still have some way to go in Japan before they reach US and European levels, but these positive signals should continue to support Japanese stocks heading into 2016.
As with valuations and earnings potential, balance sheet health across the small-cap universe is not consistent. US small caps feature debt/EBITDA levels roughly double those for large caps. Even more worrisome, US small-cap companies on average have lower credit ratings and thus would be more vulnerable to credit markets freezing up than their large-cap brethren. In contrast, Japanese and Eurozone small caps are actually less levered than large-cap peers, though for the latter this seems small compensation for elevated valuations.
Concluding Thoughts
For more on this please see Wade O’Brien et al., “UK Equities: Curbed Enthusiasm,” Cambridge Associates Research Note, August 2015.
Comparing prospects for 2016 returns with the picture 12 months ago, the building blocks for further US underperformance versus developed markets equities remain in place, though the degree of underperformance may not be as pronounced. US equities remain overvalued and in a valuation range that has historically been associated with below-average long-term subsequent returns. Earnings growth may indeed rebound as headwinds are fading and domestic growth should accelerate, but earnings seem likely to disappoint expectations again in 2016 given rising pressure on margins. The currency is a wildcard but seems more likely to be a minor drag than a boon, especially if inflation and/or Fed tightening surprise to the upside. Conversely, Eurozone and UK equities look more reasonably priced, which should support performance, though the latter may be weighed down again by a weak earnings outlook. Important wildcards for the United Kingdom are what happens to commodity prices and emerging markets, in light of high index exposure to both. As neither is easily predictable, investors maintaining large UK equity exposures should consider tilts toward more domestically oriented small- and mid-cap stocks.
Despite their strong performance in 2015, Japanese stocks also remain attractively valued, though earnings growth may decelerate from high recent levels. Still, accommodative monetary policy and ongoing governance reforms could help offset this headwind, with higher payouts to investors providing an additional boost. As investors search ever further afield for return potential given the possibility for lower returns, they should not overlook Japanese small caps, which, as discussed, feature slightly higher earnings potential and trade at a 10% discount to large caps. The limited number of sell-side analysts covering some stocks suggests this could be a fertile ground for active managers, and these small caps could provide attractive diversification if domestic growth can accelerate (a big if) or if the undervalued yen appreciates against peers, causing large-cap exporters to fall out of favor.
Emerging Markets Equities & Commodity-Related Assets: Look Past the Turbulence
Sean McLaughlin, Managing Director
Investors in emerging markets equities have had another tough year as emerging markets continue to underperform developed markets, and the sell-off in commodity-related risk assets hurt many portfolios as well. Investors today are exceptionally attuned to the risks in these areas, and not without reason. We continue to see opportunities for patient investors.
Heading into 2016, we reiterate our advice to modestly overweight emerging markets equities versus overvalued US equities, to continue to favor natural resources equities or private energy strategies over commodities, and to examine opportunities in energy master limited partnerships (MLPs), which have attractive yields and decent fundamentals. The ripple effects from the continued wind-down of the commodity supercycle brought down many risk assets in 2015. We have no crystal ball to tell us whether 2016 will be the year where emerging markets equities finally begin a long-overdue upward march, though the very fact that so many investors are capitulating and that sentiment has gotten so negative sends a positive signal to us as value investors. The question is: can you keep your focus on the horizon, rather than on the churning waves in front of you?
Slow, Painful Grind Continues for Emerging Markets Equities
Emerging markets equities have gotten very cheap, but they have done so in a sneaky way. Valuations have dipped to 11 times normalized earnings for just the fifth time over the two decades of comprehensive history we have for the asset class (Figure 8).[2]While most investors (even those that don’t support overweighting the asset class) agree with us that emerging markets are cheap today, other firms have called that into question. We would caution … Continue reading The prior four times, markets were in the midst of a crisis (the Asian financial crisis and Russian debt default in 1998, the September 11th terror attacks, the SARS epidemic, and the global financial crisis). Not so today. Emerging markets have many challenges, but few would argue they are truly in crisis.

Figure 8. MSCI Emerging Markets Composite Normalized P/E
September 30, 1995 – November 30, 2015
Sources: MSCI Inc. and Thomson Reuters Datastream. MSCI data provided “as is” without any express or implied warranties.
Notes: The composite normalized price-earnings (P/E) ratio is calculated by dividing the inflation-adjusted index price by the simple average of three normalized earnings metrics: ten-year average real earnings (i.e., Shiller earnings), trend-line earnings, and return on equity–adjusted earnings. All data are monthly.
Rather, emerging markets have experienced an extended grind of underperformance, diminishing expectations, and declining multiples. Over the past five years, real earnings in developed markets increased by a cumulative 13% based on MSCI data, and real share prices outpaced those earnings gains, rising 43%. Contrast that with emerging markets, where real earnings have slid 8% and where real share prices have declined 16% using MSCI data. Normalized valuation multiples for developed markets stocks jumped from 16 to 20 during those five years; emerging markets multiples started out above those for developed peers (17) and have ground down to just 11.
Five years ago, many investors widely discounted the prospect that commodity prices and demand growth might have been nearing a peak. They assigned emerging markets stocks a moderate multiple of trailing earnings, which had in turn been boosted by voracious Chinese demand for iron ore, coal, oil, and other commodities. In developed markets, they saw stagnation, sclerosis, and debt crises. In emerging markets they saw promise: the potential for transformation into tomorrow’s developed markets. As we are all aware, this is not how the past five years have played out. Fast forward to today, and the situation appears almost reversed. Very few risks to the emerging markets story are overlooked. Investors appear to be quite aware of the commodity bust, of the potential that Chinese growth could continue to stumble (potentially tearing the country’s web of leverage), and of the threat that Fed tightening may pose to emerging markets growth and particularly to a heavily indebted emerging markets corporate sector.
Are investors today more correct than they were five years ago? We do not deny the risks facing emerging markets, but we do believe investors as a group are making the fundamental but not uncommon mistake of mispricing the stocks. Over the long term, valuations are likely to expand from this very low level, even though there is (as always) a meaningful risk that they could shrink even further before that happens. And we only have two decades of valuation data for emerging markets equities; it is possible that the equilibrium valuation multiple is lower than the 14.8 median multiple indicated by our 20 years of history.[3]While much of that 20-year valuation history was being written, many investors expected emerging markets to, well, emerge. The growth in domestic demand and the transformation away from export … Continue reading However, few would argue that the equilibrium multiple of normalized earnings is below today’s depressed levels.
The eventual multiple expansion could occur without a commodity rebound, or an upside Chinese growth surprise, or a dithering Fed. We do not know what the catalyst will be, but the lack of an obvious catalyst for improvement is perhaps a defining feature of value opportunities.
Many investors can’t wait for revaluation to occur. Their time horizons are simply too short to bear the risk of waiting for valuations to rerate. They may be good investors or poor investors, but regardless, they or their stakeholders simply cannot tolerate the painful underperformance that periodically comes from buying the unloved. And the pervasiveness of short time horizons is often what causes value opportunities to form.
Earnings and Share Prices Still Sliding in Emerging Markets
Please see Figure 4 and the accompanying textual analysis in Sean McLaughlin et al., “Emerging Markets: Putting a Premium on Patience,” Cambridge Associates Research Note, September 2015.
Emerging markets share prices have fallen 36% from their inflation-adjusted peak levels eight years ago, while real per share earnings have fallen 20% since the commodity boom trailed off in 2011 (Figure 9). Both could certainly fall further before bottoming, if past is prologue.[4]Analysts such as JP Morgan have penciled in earnings growth of 10% for 2016; emerging markets earnings growth during the coming year is likely to be particularly difficult to forecast, given the … Continue reading Given the cyclicality of emerging markets earnings, estimating through-the-cycle, sustainable earnings, and comparing prices to those is preferable to looking at trailing earnings.[5]As noted in an earlier footnote, some investors and strategists do look at trailing and/or forward earnings, and by those metrics, emerging markets are not overly cheap. As Figure 9 makes clear, earnings were near cyclical peak levels in 2007, so comparing prices to those levels would have made shares appear less expensive than they were. Currently, trailing earnings modestly understate through-the-cycle earnings. While unadjusted P/E ratios are fairly low today, evaluating share prices in the context of cyclically adjusted earnings reveals that emerging markets index valuations are very depressed. Over the 20 years for which we have comprehensive data (and prior to that as well, for markets that we use as proxies for emerging markets), trips below the 10th percentile of normalized valuations have been few and generally short lived, with investors typically rewarded with strong absolute and relative returns.

Figure 9. Emerging Markets Real Earnings Per Share
September 30, 1995 – November 30, 2015
Sources: MSCI Inc. and Thomson Reuters Datastream. MSCI data provided “as is” without any express or implied warranties.
Risks for Emerging Markets Are Both Plentiful and Well Known
While emerging markets equities are cheap, they could prove vulnerable to a variety of potential externalities. Commodity prices and demand remain under pressure, with little likelihood of a return to the conditions of the 2000s. Related to that, Chinese growth continues to slow meaningfully, a risky condition given the country’s debt buildup in recent years. And finally, emerging markets debt growth has been substantial in recent years, raising the specter of a repeat of prior emerging markets debt and currency crises. Let’s examine each of these.
Continued Headwinds for Commodity Exporters. While commodity spot prices (measured by the Bloomberg Commodity Index) have fallen 46% from their peak levels and are likely less susceptible to further sharp declines, a return to the glory days of the past decade looks unlikely. Global investments in production capacity (mines, wells, pastureland conversion, etc.) and production technology (fracking, precision farming, etc.) during the past decade were quite significant, and demand growth does not seem poised to quickly soak up available capacity. Prices could rebound from today’s levels (or not), but either way, we don’t see a quick repeat of the recent boom. We offer some additional examination of commodities later in this report.
For more information on the rationale for tilting toward Asia, please see Sean McLaughlin et al., “The Investment Compass Points Due East: Asia’s Appeal to Emerging Markets Equity Investors,” Cambridge Associates Research Note, June 2015, and the first quarter 2015 edition of VantagePoint (a quarterly publication from Cambridge Associates’ Chief Investment Strategist), published January 20, 2015.
Given these risks, we have advised investors to concentrate their overweights in emerging markets to Asia ex Japan or emerging Asia rather than broad emerging markets, because many Asian markets are net commodity importers and thus their economies and listed companies may benefit from low commodity prices. Emerging markets broadly do have moderate correlations and beta to commodities (both about 0.45 over the three years ended June 30, although interestingly, correlations and beta to the S&P 500 Index were higher over that period). The correlations and beta of MSCI Emerging Markets Asia to commodities are lower than those of the broad index, because of the high commodity-price sensitivity of Russia, Brazil, and some other net exporters.[6]The analysis was done in US$ terms. Beta is a measurement of an investment’s sensitivity to another investment’s movement. If asset A has a beta of 1.4 to asset B, then a 10% increase in the … Continue reading Additionally, Asian emerging markets’ level of currency volatility has been lower than that of non-Asian emerging markets.[7]One of the reasons that Asian currency volatility is low compared to the rest of the emerging markets is because of the region’s managed or pegged currencies, like the Hong Kong dollar, the … Continue reading Asian emerging markets, like emerging markets broadly, are quite cheap, so investors don’t have to pay up because of the lower commodity exposure. However, Asian emerging markets would be, unsurprisingly, more exposed than other emerging markets to further erosion of Chinese growth.
Chinese Growth and Debt Concerns Remain in the Spotlight. Chinese GDP growth is substantially higher than developed markets growth, and in fact is higher than that of most other emerging markets. But the growth rate has clearly downshifted, and annual growth below 7% (substantially below, according to independent forecasters skeptical of the official numbers) could present a problem for the Chinese corporations and local governments that have vastly ramped up their borrowing. Chinese corporate bonds and bank loans totaled approximately 200% of GDP in the first quarter of this year, up from about 155% in 2010 and about 120% in 2006 based on data from Bank for International Settlements. The nominal level of outstanding bonds and loans over that period grew six-fold.
While Chinese central government debt is modest as a percentage of GDP, around half of all corporate debt in China is attributable to state-owned enterprises; thus, in a crisis, some of the country’s “corporate” debt load may become government debt.[8]Please see Sean Miner, “Corporate Debt in China: Above Cruising Altitude,” Peterson Institute for International Economics, China Economic Watch blog post, November 3, 2015. Lombard Street Research, an economic research firm, analyzed an extraordinarily bearish scenario along these lines, and determined that the country would bend but not necessarily break. The exercise assumed that all recent credit creation, together with half of existing shadow economy loans, corporate bonds, and household credit, defaults with no recovery. In this scenario, which strikes us as quite extreme, non-performing loans could hit 50% of GDP, and a government bailout could push government debt to 105% of GDP. This would be a huge increase and would heavily weigh on growth, but would not necessarily be unmanageable.[9]Please see Diana Choyleva, “Defusing China’s Debt Bomb,” Lombard Street Research, June 19, 2015. Of course, every time the Chinese government bails out a failing company, this encourages … Continue reading Although China’s debt growth is worrisome, the heft of the country’s central government balance sheet provides some degree of reassurance.
Please see Aaron Costello and Jason Widjaja, “Assessing the Likelihood of Another EM Currency Crisis,” Cambridge Associates Research Note, September 2015, and Sean McLaughlin et al., “Emerging Markets: Putting a Premium on Patience,” Cambridge Associates Research Note, September 2015.
Debt Growth Has Been Substantial, but a Repeat of 1998 Is Unlikely. As we have discussed in reports earlier this year, a repeat of the crisis of 1997–98 does not appear to be in the cards. Emerging markets government debt has been roughly flat as a percentage of GDP since 2005 (Figure 10) and has tilted heavily toward local currency issuance, under which the lender takes the currency risk rather than the issuer. Household debt to GDP has grown at a 6% annualized clip (much faster than the 2.4% growth rate of the prior ten years), but it started out at a relatively low level and remains at the fairly modest level of 32% of GDP. The sector that is perhaps most worrisome is corporate debt, which has grown at a 4.3% pace since 2005, from less than 60% of GDP ten years ago to nearly 90% today. When we compare debt-to-EBITDA across non-financial emerging markets sectors and countries, all but one sector (industrials) and the overwhelming majority of countries have experienced increases (Figure 11). And some issuers—particularly those that have US$-denominated debt and revenue that is not dollar-linked—are likely to run into problems. We continue to monitor this, because even modest-sized corporate defaults can cascade into broader problems if the lenders to the defaulting corporations are themselves leveraged (which, as a bank or a shadow-bank vehicle, they typically are).
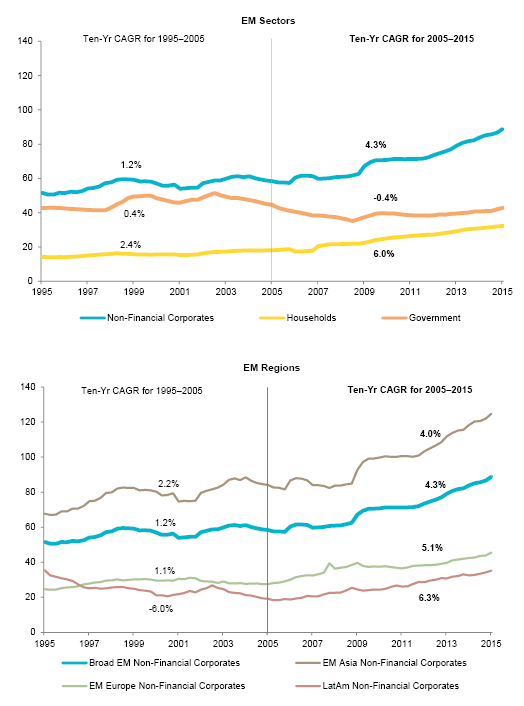
Figure 10. Debt as a Percent of GDP for Emerging Markets Sectors and Regions
First Quarter 1995 – First Quarter 2015
Sources: Bank for International Settlements and Institute of International Finance.
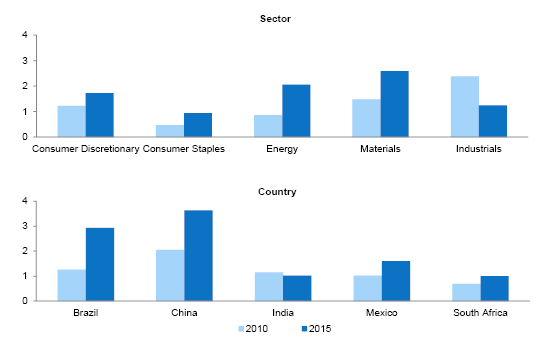
Figure 11. Debt/EBITDA for Selected Emerging Markets Countries and Sectors
As of September 15, 2015
Source: Institute of International Finance.
Note: Data for 2015 are as of September 15.
However, the lion’s share of the debt increase for emerging markets as a whole is attributable to Asia (note how closely the turquoise and brown lines on the lower chart in Figure 10 track each other), and particularly to China, where debt for non-financial firms grew from 2.1 times in 2010 to 3.6 times in 2015, according to the Institute of International Finance. As we discussed previously, China should have the resources to handle a substantial deterioration in its credit markets.
What about currencies? Many have fallen sharply versus the US dollar already, and the Fed has not even begun to hike interest rates. We believe that emerging currency markets today have very few genuine tinderboxes. Some, including index powerhouses the South Korean won and Taiwanese dollar, have decent fundamentals (current account balances and FX reserves) and are undervalued. Some, including the Indian rupee, have decent fundamentals but are richly valued. Others, like the Brazilian real and Mexican peso, have poor fundamentals but are cheap. But none have the unhealthy combination of poor fundamentals and rich valuations, a paring that might be more susceptible to an abrupt fall.
Some investors might object by noting that fundamentals for many currencies are deteriorating fast. And this is true. FX reserves for emerging markets peaked in the second quarter of last year at $7.2 trillion and have subsequently fallen by $549 billion as some countries defended their currencies against the surging US dollar (Figure 12). Reserves for the Europe, Middle East & Africa region fell by 18% from their peak, primarily due to Russia’s more than $200 billion reserve drawdown to prop up the ruble. Looking overall at the emerging markets reserve drawdown, China’s pullback accounted for 71% of the global total decline. Yet after deploying hundreds of billions of reserves, China still has vast firepower available.[10]Skeptics will rightly point out that not all of China’s reserves are necessarily available in a crisis, as some may be spoken for or have limited liquidity. However, the IMF’s incorporation of … Continue reading

Figure 12. Emerging Markets FX Reserves
Fourth Quarter 1995 – Third Quarter 2015
Sources: Bank for International Settlements and Thomson Reuters Datastream.
Notes: Quarterly data for Colombia, Egypt, Peru, Qatar, and UAE are interpolated from annual data. Egypt data are as of 2014. EMEA FX reserves peaked in December 2013, overall emerging markets and China reserves peaked in June 2014, Latin America peaked in September 2014, and Asia ex Japan peaked in June 2015. Asia ex Japan FX reserves are higher today than in June 2014 and are not included in the percent contribution to overall decline in EM FX reserves.
Focus on the Emerging Markets Horizon Rather Than the Waves
Long-term returns for emerging markets should be strong given today’s low valuations. But as with most instances of asset class undervaluation, near- and medium-term risk is elevated. Investors overweighting the asset class because of the attractive valuations must be clear that valuations do not offer much if any protection against protracted underperformance and volatility. Historically, when emerging markets equities have moved below the 10th percentile of our normalized composite valuation metric, they have tended to bounce back, but the history is limited to a few crisis periods in just two decades (and today is not a crisis—just a period of very low valuations).
Risks today for the asset class are evident and real. While Chinese growth remains vastly higher than developed markets, its slowdown seems likely to continue. The debt expansion of recent years raises vulnerabilities, although much of this is concentrated in Chinese corporates (and is perhaps offset to a degree by the resources of the central government). Most countries are in notably better shape than they were 1997, and a repeat of that period’s currency crisis appears unlikely. That leaves commodity risk. As we noted before, emerging markets’ beta and correlation to the Bloomberg Commodity Index is moderate, but investors with concerns about currency volatility and exposure to commodities can consider tilting their emerging markets exposure to Asia.
Turning to commodity-related investments, we see opportunities here as well for investors with the ability to stomach volatility.
Commodity Prices Still Vulnerable, but Risk-Tolerant Investors Should Examine Cheap Equity and MLP Markets
Commodity prices have collapsed, taking earnings and share prices of natural resources equities down with them. The broadly diversified Bloomberg Commodity Index is down 46% on a spot price basis since its 2011 peak, and total returns for sub-indexes are broadly negative for that period, ranging from -21% cumulatively for livestock to -71% for energy. A quick return to the 2003–11 boom times seems unlikely. Commodity producers got used to Chinese demand continually surprising on the upside and invested heavily in technology and production capacity. While fracking and the shale revolution are the most visible component of this supply growth for most investors, the production growth has not been limited to the oil patch. For example, Brazil’s soybean exports have recently overtaken that of the United States, with 2015–16 exports expected to be about 55% greater than the total from just four years earlier, according to the US Department of Agriculture.
It will take time for the supply glut to ease for some commodities. That said, for oil, demand growth amid falling gasoline prices proved to be stronger than many investors expected. And even though the cost of marginal production has decreased sharply over the past 18 months, production within the US shale regions that drove much of the global supply expansion finally appears to have peaked (Figure 13). Production is still growing for now in the Permian Basin in West Texas, contracting moderately in North Dakota’s Bakken shale, and plummeting in the Eagle Ford shale in South/Central Texas. However, even when demand fully catches up to supply, shale producers won’t need to see big price increases to increase production. This appears to be true for commodities broadly. While price spikes and dips are inevitable, sustained $4/pound copper, $12/bushel soybeans, or $100/barrel crude oil won’t be needed to incent increased production as markets move into balance.
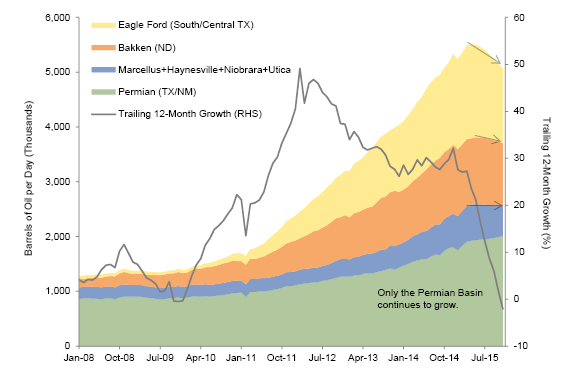
Figure 13. Oil Production from Key US Regions
January 31, 2008 – November 30, 2015
Please see Sean McLaughlin et al., “Value in the Oil Patch, for Investors with a Strong Stomach,” Cambridge Associates Research Note, August 2015.
Source: US Department of Energy – Energy Information Administration (EIA).
Notes: Primary US state locations for selected shale formations are included in parentheses; shale formations do not follow state borders, and portions of the resource may extend outside the named states. The primary locations for the four grouped shale formations are as follows: Marcellus: NY/PA; Haynesville: AR/LA/TX; Niobrara: CO/WY; and Utica: OH. Most recent data points represent EIA estimates.
For many years now, we have recommended that investors underweight or avoid commodity futures. We signaled in early 2011 that commodities were overvalued,[11]See the March 2011 edition of Cambridge Associates’ “Notes on Current Valuations” report, which stated: “We believe commodities are now overvalued… [and] spot prices of a diversified … Continue reading and while valuations are now quite reasonable today, implementation conditions remain challenging, with futures curves in contango and cash collateral earning only a very limited yield. We would continue to underweight commodity futures. For investors seeking commodity-related exposure, private energy funds may see substantial deal flow at low entry multiples if the downturn persists, while publicly listed natural resources equities (NREs) and master limited partnerships (MLPs) may outperform if commodity prices stabilize and risk appetites return in the near term. Investors have divergent opinions on NRE valuations; we adjust for the cyclicality of their earnings, and thus believe they are quite cheap today. Investors that base their assessment on trailing earnings will actually call them richly valued (even though share prices are far below mid-2014 levels, when they were reasonably valued). We believe they have been cheaper only 11% of the time dating back over the past four decades (Figure 14). To be clear, our assumption is that earnings will recover over time, just as they did during the late 1980s and the turn of the millennium, after those commodity busts.
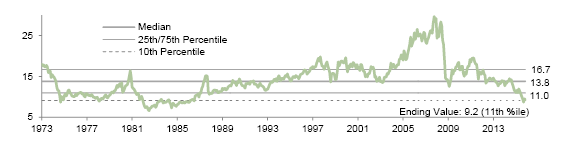
Figure 14. Composite Normalized P/E for Natural Resources Equities
January 31, 1973 – November 30, 2015
Please see Kevin Rosenbaum et al., “Energy MLPs: Attractive Yields in a Time of Uncertainty,” Cambridge Associates Research Note, October 2015.
Sources: Cambridge Associates LLC and Thomson Reuters Datastream.
Notes: Natural resources equities are composed of 80% Datastream World Oil & Gas Index and 20% Datastream World Mining. Prices are adjusted to October 2015 dollars.
Energy-oriented MLPs, which operate hydrocarbon infrastructure assets in the United States such as pipelines, are also quite attractively valued. These yield-oriented assets typically have muted fundamental sensitivity to oil prices, but during this oil-price crash, investors have shown MLPs little mercy. Yields of 10% as of early December on an index basis and still-reasonable growth prospects are tough to beat in today’s equity environment.
Concluding Thoughts
Comparing prospects for 2016 with the picture 12 months ago, macroeconomic pressures on emerging markets have increased somewhat (and investor attention to these same issues has increased greatly). However, sentiment is quite negative, and if commodity prices and economic growth stabilize (much less rebound) during the year, emerging markets shares and energy-related equities could jump sharply. Continuing weakness in China, and particularly a debt-market scare, could press even more investors to join the fund-flows exodus. Over the medium and longer term, we see little prospect for volatility to abate, but returns are likely to reward investors able to look past the turbulence.
Commodity cycles are often long, and prices during this cycle have only been declining since early 2011, but significant pressure on commodity-producing companies will help bring supply back into balance with demand. US shale oil production, for example, appears to have peaked. The process of supply synching with demand could certainly extend beyond 2016, of course. In the meantime, commodity futures continue to be difficult to recommend, given their negligible collateral yield and negative yield from rolling futures contracts. Natural resources equities are the better long-term bet despite lousy fundamentals. Earnings for natural resources equities have already declined by almost 70% from peak, and few analysts see an earnings turnaround in 2016. While valuations for natural resources equities may not be clear cut, MLPs are clearly much cheaper than they have been in recent years. Growth prospects have dimmed but not flickered out in this withered oil-production environment, and today’s chunky yields are very competitive in an environment where cash yields nothing and bonds yield precious little. Investors, particularly those that believe hydrocarbon prices will remain pressured for an extended period, should also consider private energy strategies, which could see increased deal flow at cheap entry valuations in a lower-for-longer oil price environment.
Index Disclosures
Cambridge Associates does not provide stock selection recommendations, and any reference to specific companies is not to be interpreted as a recommendation of that company as an investment option.
Bloomberg Commodity Index
The Dow Jones-UBS Commodity Index (DJ-UBSCI) is a broadly diversified index that allows investors to track commodity futures through a single, simple measure. The DJ-UBSCI is composed of futures contracts on physical commodities. It is published on Bloomberg and Reuters. The index is designed to minimize concentration in any one commodity or sector. It currently includes 19 commodity futures in five groups. No one commodity can make up less than 2% or more than 15% of the index, and no group can represent more than 33% of the index (as of the annual re-weightings of the components).
FTSE 100® Index
The FTSE 100® Index is a capitalization-weighted index of the 100 most highly capitalized companies traded on the London Stock Exchange. The equities use an investability weighting in the index calculation. The index was developed with a base level of 1,000 as of December 30, 1983.
FTSE 250® Index
The FTSE 250® is a market capitalization–weighted index consisting of the 101st to the 350th largest companies listed on the London Stock Exchange.
JPX-Nikkei Index 400
The JPX-Nikkei Index 400 is composed of companies with high appeal for investors, which meet requirements of global investment standards, such as efficient use of capital and investor-focused management perspectives. The index was jointly developed by Nikkei, the Japan Exchange Group, and the Tokyo Stock Exchange
MSCI All Country World Index
The MSCI ACWI captures large- and mid-cap representation across 23 developed markets and 23 emerging markets countries. With 2,476 constituents, the index covers approximately 85% of the global investable equity opportunity set.
MSCI EM Asia Index
The MSCI EM Asia Index captures large- and mid-cap representation across eight emerging markets countries. With 535 constituents, the index covers approximately 85% of the free float–adjusted market capitalization in each country.
MSCI Emerging Markets Index
The MSCI Emerging Markets Index represents a free float–adjusted market capitalization index that is designed to measure equity market performance of emerging markets. As of February 2013, the MSCI Emerging Markets Index includes 23 emerging markets country indexes: Argentina, Brazil, Chile, China, Colombia, Czech Republic, Egypt, Hungary, India, Indonesia, Israel, Korea, Malaysia, Mexico, Morocco, Peru, Philippines, Poland, Russia, South Africa, Taiwan, Thailand, and Turkey.
MSCI Europe ex UK Index
The MSCI Europe ex UK Index captures large- and mid-cap representation across 14 developed markets countries in Europe. With 330 constituents, the index covers approximately 85% of the free float–adjusted market capitalization across European Developed Markets excluding the United Kingdom.
MSCI Japan Index
The MSCI Japan Index is a free float–adjusted market capitalization weighted index that is designed to measure the equity market performance of Japan.
MSCI United Kingdom Index
The MSCI United Kingdom Index is designed to measure the performance of the large- and mid-cap segments of the UK market.
MSCI US Index
The MSCI US Index is designed to measure the performance of the large- and mid-cap segments of the US market. With 617 constituents, the index covers approximately 85% of the free float–adjusted market capitalization in the United States.
Russell 2000® Index
The Russell 2000® Index is a capitalization-weighted index designed to measure the performance of the 2,000 smallest publicly traded US companies based on in market capitalization. The Index is a subset of the larger Russell 3000® Index.
S&P 500 Composite Stock Price Index
The Standard & Poor’s 500 Composite Stock Price Index is a capitalization-weighted index of 500 stocks intended to be a representative sample of leading companies in leading industries within the US economy. Stocks in the index are chosen for market size, liquidity, and industry group representation.
Thomson Reuters Datastream WORLD-DS Oil & Gas Index
The Datastream World DS OIL & Gas Index (OILGSWD) is part of Thomson Reuters Datastream Global Equity Indexes dataset. It is composed of any equities within the Datastream World Index that is classified within the oil & gas industry based on the Industry Classification Benchmark (ICB) classification system. As of December 2015, the Datastream World Index is composed of 66 countries (26 developed and 40 emerging markets) worldwide. For each market, a representative sample of stocks covering a minimum 75%–80% of total market capitalization enables market indexes to be calculated. By aggregating market indexes for regional groupings, regional and world indexes are produced. Within each market, stocks are allocated to industrial sectors using the ICB jointly created by FTSE and Dow Jones. Sector indexes are then calculated.
Thomson Reuters Datastream World-Datastream Mining Index
The Datastream World DS Mining Index (MNINGWD) is part of Thomson Reuters Datastream Global Equity Indexes dataset. It is composed of any equities within the Datastream World Index that is classified within the oil & gas industry based on the Industry Classification Benchmark (ICB) classification system. As of December 2015, the Datastream World Index is composed of 66 countries (26 developed and 40 emerging markets) worldwide. For each market, a representative sample of stocks covering a minimum 75%–80% of total market capitalization enables market indexes to be calculated. By aggregating market indexes for regional groupings, regional and world indexes are produced. Within each market, stocks are allocated to industrial sectors using the ICB jointly created by FTSE and Dow Jones. Sector indexes are then calculated.
Other contributors to this report include Joe Comras and Emily Ginsberg.
Footnotes