Fundamentals and share prices have come under pressure for natural resources equities this year, but we continue to believe they offer strong long-term return prospects
- Natural resources equities have had a difficult 2015. Oil prices remain under pressure, even as the supply glut appears to be narrowing, with US shale production growth slowing and global demand growth surprising on the upside. The easing of sanctions on Iran is a supply wild card in the medium term.
- Revenues, earnings, and cash flow for natural resources equities have all taken substantial hits as commodity prices have slid. Some additionally are facing balance sheet pressures.
- Cyclically adjusted valuation metrics appear to bake in today’s dismal near-term conditions (normalized P/E ratios are in the 13th percentile of our valuation history over the past 42 years), and investors with a long-term time horizon could benefit if conditions normalize in coming years.
Early this year, we offered a relatively sanguine outlook for natural resources shares in the midst of the crude oil bloodbath. As volatility persists, earnings for natural resources stocks plummet, and the potential for increased oil supply from Iran looms, has our long-term outlook for natural resources equities changed materially? While we offer a more complete answer in the pages that follow, the short answer is no.
Oil prices are likely to see substantial further volatility, but they seem unlikely to spend a multi-year period much below current levels. And valuations of natural resources stocks are low (normalized valuation metrics at least—more traditional metrics that don’t adjust for short-term cyclicality reflect shares as being more expensive today than they were a year ago!). Cheap starting valuations are associated with enviable long-term returns, but valuations rarely serve as a performance catalyst, so investors without a long time horizon should not be comforted by today’s forgiving prices.
Oil Supply Glut Is Narrowing
Please see Sean McLaughlin et al., “Feeling Energetic About Natural Resources Shares Amid an Oil Rout,” Cambridge Associates Research Note, January 2015.
While oil price volatility may continue, today’s prices appear sufficiently low to bring supply and demand into balance over the medium term. After a massive decline in drilling activity, US production growth has moderated and in fact may have already peaked. As we highlighted in January, today’s shale wells have a very rapid rate of decline—one-third of the lifetime production of typical Bakken well is pumped within the first year, and within five years, monthly production will have declined by 90% versus the peak initial production. Drilling activity has slowed dramatically from last November: horizontal wells, the most productive and plentiful variety today, have declined 52% and are now at 2010 levels. While producers are “upgrading”—focusing their now more-limited resources on the most productive acreage within each shale basin—the rapid production-decline rate of wells that were drilled in recent years is outrunning the impact of this upgrading. US shale production is leveling off and may have peaked (Figure 1).

Figure 1. Rolling Three-Month Change in Horizontal Rig Count and US Shale Crude Oil Production
January 31, 2007 – June 30, 2015
Sources: Baker Hughes Incorporated, US Energy Information Association, and Thomson Reuters Datastream.
US shale production, of course, only accounts for about 5% of global production, so while it has been a “swing state” producer in recent years, production-level changes in several other large producers could materially impact global supply (particularly Iran, which could see production rebound strongly as sanctions lift). Figure 2 highlights production-growth dynamics in some of the key global oil-producing countries.
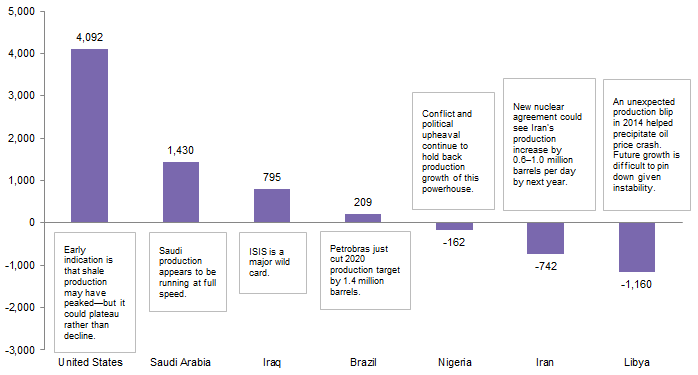
Figure 2. Change in Oil Production from 2010 to 2014
Millions of Barrels per Day
Source: British Petroleum.
Notes: Oil production includes crude oil, tight oil, oil sands, and natural gas liquids (NGLs), the liquid content of natural gas where this is recovered separately. Change over the past four years is based on annual data.
While forecasters may have strongly held and well-articulated views on medium-term production growth globally, or in particular regions, recall that oil prices declined during the second half of 2014 in part because investors had been badly underestimating growth in US production. And compared to many other large producers, the US offers a wealth of reliable production data, relative political stability, and no threat of armed conflict within its borders. A grain of salt is a mandatory accompaniment to any oil-production forecast.
Please see Sean McLaughlin et al., “Oil Prices Can’t Find Their Footing, Even Amid Geopolitical Turmoil,” Cambridge Associates Research Brief, October 30, 2014.
Production growth appears to have moderated as we expected, and developed markets demand is increasing more than we had anticipated. Last fall, we argued that mandated increases in fuel economy, combined with changing consumer behavior and demographics, might dampen the demand increase from the developed world. However, while both gasoline consumption and driving volume remain well below their long-term trend levels, they are rebounding, as Figure 3 illustrates.[1]It is difficult to say whether the rebound owes much to falling prices, however. As the chart indicates, demand began to pick up well before last year’s fuel-price collapse. Demand growth in the … Continue reading
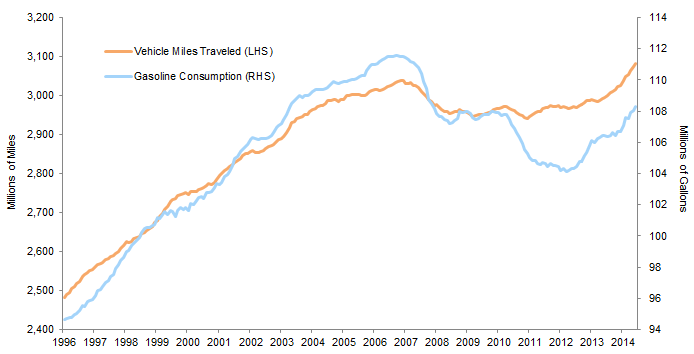
Figure 3. United States: Trailing 12-Month Total Vehicle Miles Traveled and Consumption of Gasoline
January 31, 1996 – May 31, 2015
Sources: Energy Information Adminstration (EIA), Federal Reserve Bank of St. Louis, Thomson Reuters Datastream, and US Federal Highway Administration.
Demand growth in Asia is also strong. Chinese oil demand (roughly 12% of global oil consumption) increased 5.2% during the first five months of 2015, compared to the same period of the prior year. The Chinese stock market’s recent volatility occurred after the measurement period, and it is impossible to know whether the stock market’s struggles will impact the pace of automobile purchases.
It remains to be seen whether supply and demand will balance at today’s prices, but it is clear that progress toward this equilibrium has been substantial over the past year, with both consumers and producers responding to the halving of oil prices.
Fundamentals for Energy Firms Are Dimming Further
Shares of energy-related firms have taken a beating since last summer: the MSCI World Energy Index has returned -31% since June 30, 2014. Small-cap US energy shares have returned about -54% over that time. Investors recognize that revenues, income, and cash flow will be sharply diminished with oil prices at $40 per barrel instead of $100. Fundamentals were not great for many of the largest integrated energy firms, even when oil prices were more than twice today’s levels. Now they have deteriorated substantially and may continue to do so (Figure 4).
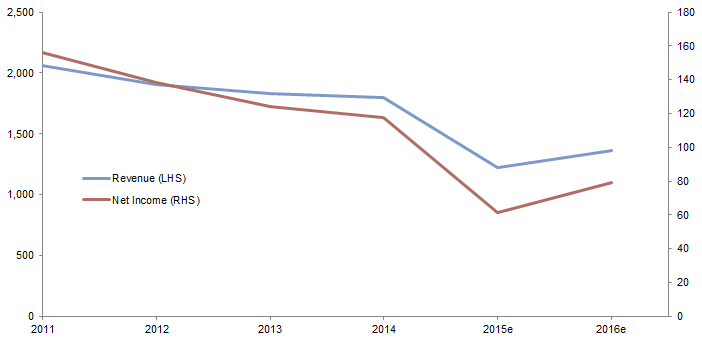
Figure 4. Total Revenue and Net Income for Ten Largest Global Energy Firms
As of August 7, 2015 • US Dollars (Billions)
Source: Bloomberg L.P.
Notes: Data are consensus expectations from Bloomberg for 2015 and 2016. The ten firms are the largest by market capitalization in the energy sector of the MSCI World Index.
In addition to revenue that is estimated to decline by more than 40% from 2011 levels and profits that are projected to drop more than 60%, balance sheets are feeling some strain from debt incurred in recent years. Debt coverage ratios have worsened as cash flow and income metrics have plummeted. Firms that have been reluctant to step off the dividend and buyback treadmill have been increasing their borrowing pace to keep up, a trend that was well underway even when oil prices were more than twice current levels, and that has continued (Figure 5).
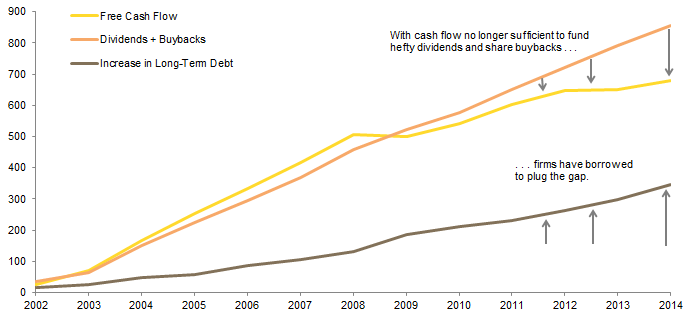
Figure 5. Cumulative Free Cash Flow, Dividends + Buybacks, and Increase in Debt for Integrated Energy Companies
2002–14 • US Dollars (Millions)
Source: Bloomberg L.P.
Notes: Universe of integrated energy companies included Exxon Mobil, Chevron, Conoco Phillips, BP, Total, and Royal Dutch Shell. Free cash flow is defined by Bloomberg as cash flow from operations less capital expenditures.
Integrated energy majors have diverse revenue streams and investment-grade ratings, and are unlikely to face harsh questions from ratings agencies or bond investors in the near term.[2]Indeed, as of late July, an ExxonMobil ten-year bond was priced to yield 3.1%, less than 100 bps above ten-year Treasury yields. Credits issued by smaller energy firms, however, have come under substantial pressure over the past year, and this may increase in coming months. Redeterminations, where banks reassess energy-borrower collateral twice annually, may force additional deleveraging this fall. Nearly half of independent North American producers tracked by Bloomberg were spending at least 10% of their revenue on interest payments, and nearly three-quarters carry speculative-grade credit ratings. Several credit managers raised large energy funds last fall and winter, expecting that waves of significant distress would allow them to acquire bonds (and in some cases the eventual control of valuable collateral) at bargain prices. Thus far, distress and defaults have been spotty, but both could pick up this fall.
With few opportunities for asset sales so far this year, heavily indebted producers have needed to raise equity to rationalize their balance sheets, and this has further dented returns. Small-cap US energy firms have fallen 21% year-to-date, compared with 13% for the energy firms in the large-cap S&P 500 Index.
Valuations for Resource-Oriented Firms Are Appealing
Near the beginning of this year, our valuation assessment for natural resources equities changed from “fairly valued” to “undervalued” as share prices dropped. The degree of undervaluation has continued to increase this year, in our opinion. However, some managers and sell-side analysts believe that valuations have deteriorated. What is the source of this discrepancy? Time horizon and cyclical adjustments to earnings metrics. While share prices for energy indexes have dropped by approximately 30% since last June, earnings metrics have dropped even further (this is true of trailing 12-month earnings, EBITDA, forward earnings expectations, and other metrics). Thus, standard valuation metrics that don’t account for cyclical variation in the earnings stream appear rather rich (Figure 6).
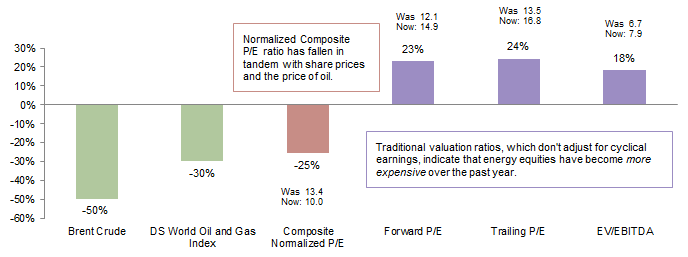
Figure 6. Change in Brent Crude, Energy Equities, and Energy Company Valuations
July 31, 2014 – July 31, 2015
Source: Thomson Reuters Datastream.
Notes: Valuation ratios are all calculated for the Datastream World Oil and Gas Index. EV/EBITDA is the ratio of enterprise value to EBITDA. Enterprise value is the combined value of a firm’s equity and its debt, net of its cash. EBITDA is the firm’s earnings before interest, taxes, depreciation, and amortization.
For an equity asset class such as natural resources that has a highly cyclical earnings stream, we believe it is particularly important to normalize the earnings in an attempt to strip out some of the cyclical variation. When no adjustments are made, traditional valuation multiples tend to overstate the valuation when earnings are troughing and to understate the valuation when earnings are peaking. It is difficult to say whether earnings are truly near trough levels, but they have fallen 60% from peak levels, roughly in accordance with commodity prices, as is typical (Figure 7).
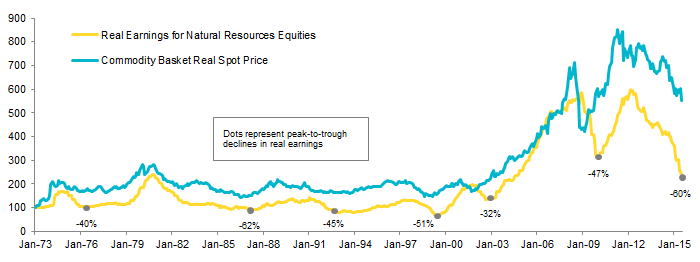
Figure 7. Inflation-Adjusted Earnings and Commodity Prices Peak-to-Trough Declines
January 31, 1973 – July 31, 2015 • Rebased to 100 on January 31, 1973
Source: Thomson Reuters Datastream.
Notes: The endpoint dot reflects the 60% drop in real earnings from peak to current; it is unknown whether the current earnings level is a trough. Commodity basket reflects a diversified basket of 22 commodities, similar in construction and weightings to the Bloomberg Commodity Index.
Our preferred valuation metric is a normalized composite P/E ratio, which compares share prices to the average of three cyclically adjusted earnings metrics.[3]The three metrics are trendline earnings (which pinpoint where earnings would be today if they followed the series’ long-term trend), return on equity (ROE)–adjusted earnings (which mechanically … Continue reading Today, natural resources are priced at 9.6 times normalized composite earnings, which is in the 13th percentile of monthly valuations dating back to 1973 (Figure 8).

Figure 8. Composite Normalized Price-Earnings Ratio for Natural Resources Equities
January 31, 1973 – August 7, 2015
Source: Thomson Reuters Datastream.
Notes: Natural resources equities are composed of 80% Datastream World Oil & Gas Index and 20% Datastream World Mining. Data are monthly except for most recent data points as of August 7, 2015.
At this point, astute readers may point out that natural resources equities can be tied to a wide variety of commodities, yet we have focused primarily on oil. To be sure, a broad swath of commodities have seen painful price declines over the past several years, including most of the key commodities produced by large index components. While energy firms account for the large majority of market capitalization of global natural resources equities, both energy and mining firms are cheap today, as shown in the figure 8.
What catalysts might unlock the value we see in natural resources equity shares today? It’s difficult to say for certain; there is not one anticipated event or outcome keeping investors on the sidelines. However, the following events, should they occur, would likely be viewed as positives for natural resources equities: (1) a rebound in longer-dated oil futures (implying that the long-term supply/demand picture once again favored producers); or (2) positive earnings surprises a few quarters from now, were energy firms to demonstrate that today’s lower oil-services costs and attention to cost structures allowed them to turn a profit and continue to shower investors with dividends despite low oil prices. Valuations could remain moribund for more than a few quarters—that’s one reason a long time horizon is important.[4]That long time horizon (and specifically its rarity) offers a crucial source of comparative advantage: most shareholders cannot afford to wait years for valuations to revert, and that is one of the … Continue reading Of course, one of the potential catalysts is a rebound in oil prices, so savvy investors might ask, why not just own commodities instead? Commodity indexes will indeed likely do well if oil prices rise sharply.[5]Some commodities are more tilted to oil than others, but many of them have hefty weights to heating oil and to related products such as gasoline. However, owners of natural resources equities get paid to wait, with chunky dividend streams of about 4%. Commodity index investors, on the other hand, pay handsomely in the form of negative roll yields[6]Investors owning futures positions for commodities that are in contango (that is, the near-month futures are cheaper than longer-dated futures), receive less proceeds when selling maturing contracts … Continue reading today of 16% annualized for Brent crude oil (other key commodities have negative roll yields as well). If oil prices rebound shortly, it’s possible that commodity index investors will make out better than those that own natural resources firms. But patience, if required, may prove less expensive for equities than commodity futures.
Investors that don’t have the inclination or ability to weather considerable short-term pain should avoid this volatile and pressured asset class. On the other hand, investors with long time horizons could be rewarded with solid returns. Return projections from our “return-to-normal” scenario—which attempts to illustrate the potential return for an asset class should valuations and other conditions revert to typical levels over a ten-year time horizon—paint a rosy picture indeed for natural resources equities: a ten-year real annualized return of 8%. That said, this is a highly stylized scenario (which does not necessarily represent our base case), and actual returns could be materially different.
Conclusion
Oil prices remain moribund and volatile, but with US shale production apparently near a plateau or peak, a prolonged further price decline seems unlikely absent a stark change in the supply/demand balance (which might be introduced by the removal of Iranian sanctions or by a significant growth slowdown). Global oil demand has surprised to the upside, US shale production growth is finally slowing after drilling activity collapsed, yet strong Saudi production and the potential for an Iran supply bounce-back continue to pressure oil prices. The fundamentals of natural resources equities have deteriorated as their revenue and the value of their reserves has fallen. While these equities look rich based on traditional P/E metrics, our cyclically adjusted metrics indicate that they are actually quite undervalued. While valuations have historically informed long-term returns, short-term returns are almost completely independent of valuations. Long-term investors may be rewarded by quite healthy returns if conditions revert to average levels, but the near-term is quite uncertain.
Contributors
Sean McLaughlin, Managing Director
Alex Jones, Senior Investment Associate
Footnotes