China has recently taken dramatic steps to open its domestic bond market to foreign investors. The launch of the Bond Connect Program in July 2017 builds upon reforms announced in early 2016 that, in theory, remove investment quota restrictions and repatriation limits for foreign institutional investors when buying or selling bonds. This is in contrast to China’s onshore equity markets, where foreign investors still face certain restrictions.
The upshot is that a large market offering yields higher than those found in the developed world is now open. At first glance, this appears to be a huge opportunity for investors. However, as with many things in China, the story is more complicated than it appears.
This paper provides an introduction to the onshore Chinese bond market and discusses the outlook for the market and other considerations for investors.
China’s Three Bond Markets Defined
Broadly speaking, China has three bond markets: an onshore CNY-denominated market, an offshore CNH-denominated market, and an offshore “international” market denominated in other currencies, predominantly US dollars (Figure 1).
China’s Currency: RMB, CNY, or CNH?
The name and abbreviation for China’s currency is often a source of confusion for investors. The official name of the currency is the renminbi (literally “the People’s Currency”), abbreviated RMB. The basic unit is the yuan (a generic term for a unit of currency), which can be further subdivided into smaller units (e.g., jiao). In practice, both renminbi and yuan are used interchangeably for the Chinese currency. Adding to the confusion is that China has two different currency abbreviations used in the currency market. The CNY code refers to the RMB traded onshore (with values set by the People’s Bank of China [PBOC]), and the CNH code refers to the RMB traded in Hong Kong by offshore investors. Although CNY and CNH closely track each other, they can at times diverge. Thus, China has one currency (the RMB), but two different prices (onshore CNY and offshore CNH).
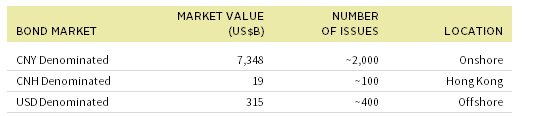
FIGURE 1 CHINA’S THREE BOND MARKETS
As of September 30, 2017
Sources: Barclays, Bloomberg L.P., CCDC, and Citigroup Global Markets.
Notes: CNY-denominated market is represented by the ChinaBond New Composite Index; CNH-denominated market is represented by Citigroup Dim Sum Bond Index; and USD-denominated market is represented by the USD-denominated China exposure in the Bloomberg Barclays Global Aggregate Bond Index.
Many investors are surprised to learn that most global fixed income benchmarks, including emerging markets debt indexes, have little-to-no exposure to China. Currently, index exposure is typically limited to the USD-denominated market, which is only US$315 billion in size, or 0.6% of the Bloomberg Barclays Global Aggregate Bond Index.
Please see Seth Hurwitz and Sean Duffin, “Dim Sum Bonds: Still Just an Appetizer,” Cambridge Associates Market Commentary, February 2013.
The offshore CNH or “dim sum” market comprises bonds issued in Hong Kong and denominated in CNH. Launched in 2010 to help internationalize the RMB by encouraging the growth of CNH assets, this market remains relatively small (US$19 billion) with limited liquidity and market concentration issues.
The onshore CNY-denominated market is the true Chinese bond market, with a size of RMB 48.8 trillion (or ~US$7.3 trillion), making it the third largest individual bond market in the world (or fourth largest considering the Eurozone bond market as a whole) (Figure 2).
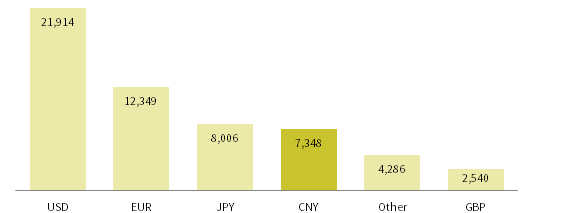
FIGURE 2 SIZE OF CHINA’S ONSHORE BOND MARKET COMPARED TO OTHER MARKETS
As of September 30, 2017 • US$B
Sources: Barclays, Bloomberg L.P., and CCDC.
Note: Market size is based on the Bloomberg Barclays Global Aggregate Bond Index, except for the CNY-denominated bond market, which is based on the ChinaBond New Composite Index.
The onshore bond market can further be sub-divided into the Chinese Interbank Bond Market (CIBM) and the exchange-traded bond market (Figure 3). This paper will focus on the CIBM, given that it accounts for over 80% of outstanding bond issuance and is the market that foreign investors have been given access to via the Bond Connect Program and CIBM Access Program.
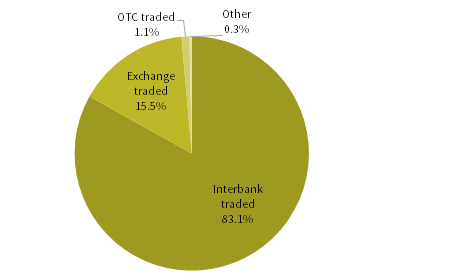
FIGURE 3 TRADING OF ONSHORE BONDS
As of March 31, 2017 • Percent of Registered Bonds
Sources: CCDC, CSDC, Goldman Sachs Global Investment Research, and Shanghai Clearing House.
Accessing the Onshore Market
Please see Aaron Costello and Han Xu, “The Opening of China: An Update for Investors,” Cambridge Associates Research Brief, September 30, 2016.
In February 2016, Chinese authorities announced that foreign institutional investors would be allowed to access the CIBM with no investment quotas or repatriation restrictions applied. All that was required was to register with the PBOC and appoint an onshore custody bank. This triggered a wave of excitement among global bond investors and saw the major index providers place onshore Chinese bonds under review for potential inclusion in global bond benchmarks.
By early 2017, the excitement had died down, as index providers deemed onshore Chinese bonds not ready for inclusion in flagship indexes, citing a number of investor concerns including a less-than-smooth registration process, settlement issues, and the inability to access onshore CNY currency forwards for hedging, as well as general skepticism about the ability to repatriate funds amid periods of market stress and RMB weakness.[1]Instead, index providers have created separate indexes that include China for investors and managers that wish to track this exposure. Responding to this feedback, Chinese authorities have announced changes to the settlement cycle and allowed foreign investors that register with onshore custodians to trade onshore currency forwards.
A separate Bond Connect program, launched in July 2017, provides another route to access the CIBM. Rather than register and settle trades onshore, investors can register offshore in Hong Kong and use the Hong Kong Monetary Authority (the de facto central bank) as the clearing bank and counterparty through its Central Money Markets Unit (CMU), an entity with a credit rating (AA+) currently higher than the Chinese government (A+). This should reduce concerns over repatriation and capital account risk, since the assets are held and settled offshore.
The downside to the Bond Connect at this juncture is that it does not provide access to onshore currency hedging and does not allow block trading, which may deter some large investors. However, investors can choose instead to register and settle onshore to overcome this.
Although it is too soon to tell how successful the Bond Connect program will be (and how smooth the actual trading will be), at the time of launch 110 foreign institutions had already pre-registered for the program.
Overview of the CIBM
The CIBM is the onshore Chinese bond market as far as foreign investors are concerned.[2]Investors with QFII or RQFII allocations can currently access the exchange-traded bond market, albeit with repatriation restrictions. Thus, the new CIBM and Bond Connect programs are designed to be … Continue reading Since banks are the largest holders of bonds in China, this market has the highest trading volumes and the widest range of bonds available. The CIBM is regulated by the PBOC and is supported by the China Central Depository & Clearing Co., Ltd.
Composition
The CIBM can be broadly grouped into four main segments (Figure 4):
- Policy Bank Bonds: Bonds issued by the three main development banks (China Development Bank, Agricultural Development Bank of China, and the Export-Import Bank of China) account for over one-quarter of the market and are the most actively traded segment. Though not technically sovereign bonds, they are viewed as such by local investors and traded similarly.
- Central Government Bonds: China’s central government bonds (CGBs), are typical sovereign bonds issued in a range of maturities. These bonds are the second most actively traded segment, despite being a smaller share of the overall market.
- Local Government Bonds: Created to allow local governments to refinance short-term bank loans into longer-term bonds, local government bonds are largely held by banks. These obligations of provincial-level governments are considered illiquid. Though not backed by the central government, local investors view these bonds as having an implicit government guarantee.
- Corporate Credit: The various types of corporate bonds issued in China account for over a quarter of the market.[3]China has various types of corporate bonds, as at least six different regulators are in charge of approving bond issuance depending on the type of corporate entity involved. This results in multiple … Continue reading Most of the corporate credit segment is made up of bonds from state-owned enterprises (SOEs) and liquidity can be poor for some segments. Some analysts make a distinction for the bonds issued by the four major central government–owned banks (Agricultural Bank of China, Bank of China, China Construction Bank, and Industrial and Commercial Bank of China), which are viewed as having implicit government guarantees.
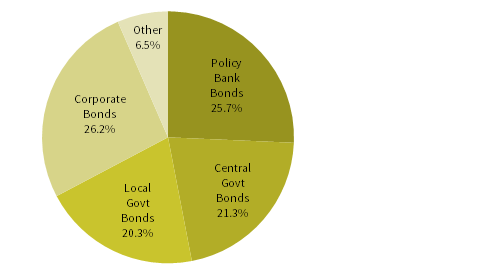
FIGURE 4 COMPOSITION OF THE ONSHORE BOND MARKET
As of September 30, 2017 • Market Value: US$7.3 trillion
Source: CCDC.
Note: Based on the ChinaBond New Composite Index.
Alternatively, some analysts divide the market into three broad segments: government-related bonds (CGBs, local government, and agency bonds), financial bonds (policy bank and commercial bank bonds), and corporate bonds (non-financial corporate bonds, including commercial paper). However, this classification method obscures the distinct liquidity profile of policy bank bonds and CGBs from the rest of the market.
Credit Quality and Ratings
Most bonds in China are rated by domestic rating agencies, whose ratings are not comparable with those of international rating agencies. Nearly half of the market is considered “AAA.” However, these ratings are not taken seriously by most asset managers, which employ their own ratings. Generally speaking, the informal threshold for “investment grade” is AA; issuers that would fall below AA simply opt to remain “unrated.”
Goldman Sachs estimates that 93% of the onshore market is made up of “government-related issuers,” including 87% of the corporate segment. Many domestic investors and domestic mutual funds actively hold credit exposure given a pervasive belief that SOE-backed entities carry no default risk because the central government will bail out investors to avert economic and social unrest. According to Goldman Sachs, since 2014 there have been 29 onshore bond defaults, with a total notional amount of RMB 75 billion (~US$11 billion). In 13 cases, bond holders were made whole; the remaining 16 cases are as yet unresolved. In early August 2017 it was reported that an SOE-backed steel company had announced a debt restructuring that would make small retail investors whole, but force large bond holders to take a 78% haircut or swap debt for equity. If executed, this would be the first onshore bond restructuring with losses. This may set a precedent for future defaults or restructurings.
Recent defaults have yet to generate a meaningful repricing of credit risk in the market, as there remains little difference between yields and spreads across companies and sectors, despite obvious differences in underlying fundamentals. As a result, most foreign investors deem credit risk to be fundamentally mispriced in China, and generally avoid much of the corporate credit space in the onshore market. Concerns over liquidity, the quality of financial disclosures, and the reliability of corporate data only add to the skepticism. This is in contrast to Chinese debt in the USD-denominated bond market, which trades actively with dispersion across issuers. In an effort to encourage participation in the Bond Connect program, the government has announced that the “big three” international rating agencies (Fitch, Moody’s, and Standard & Poor’s) will be allowed to enter China and rate bonds, which may help ease some investor concerns.
Investor Base
The investor base in China is unlike most other markets. Commercial banks hold 56% of all bonds, compared to only 22% for “fund institutions” or asset managers (Figure 5). Commercial banks hold an even higher share of government bonds, which at 68% is an outlier globally. Yet, among corporate bonds, asset managers dominate, holding 47% compared to 18% for commercial banks. The growth in asset manager bond holdings (both corporate bonds and all bonds) is a reflection of the growing savings of Chinese households. Currently, foreign investors account for less than 2% of bond holdings; most are held by global central banks and concentrated in the CGB segment.
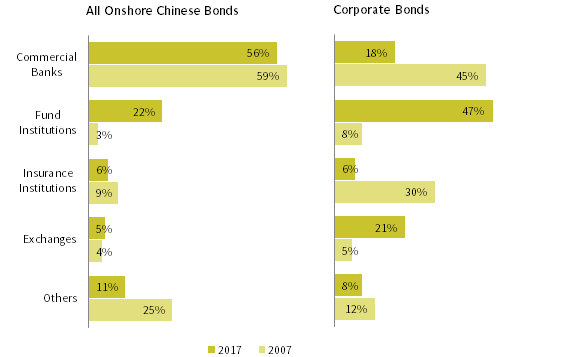
FIGURE 5 HOLDERS OF ONSHORE BONDS: 2007 vs 2017
As of March 31, 2017
Sources: CCDC and Goldman Sachs Investment Research.
Note: Foreign investors included in “Others” and foreign holdings amount to only 1.4% of all bonds.
Liquidity and Investability
The concentrated nature of holdings understandably raises questions about market liquidity, as banks tend to buy and hold bonds to maturity. In general, policy bank bonds and CGBs are the most liquid, and local government bonds and certain credit segments are deemed illiquid. However, some managers complain that even among CGBs liquidity exists only for on-the-run issues. Other analysts argue that overall liquidity is comparable to other developed bond markets.
This disconnect partly stems from the fact that turnover on the exchange-traded segment of the bond market can be higher at times than the CIBM, as the former is driven by domestic active managers. Most foreign investors do not have access to the exchange-traded bond market, making low turnover a legitimate concern. Ultimately, most foreign investors only consider the CGBs and policy bank bonds as “investable” and these two segments are what the index providers are considering for inclusion in global bond benchmarks.
Bloomberg estimates the investable portion of the CIBM to be only US$2.8 trillion in market cap (split roughly 50/50 between policy bank bonds and CGBs). If included in the Bloomberg Barclays Global Aggregate Index, this portion would only account for 6% of the index, roughly the same size as the GBP-denominated bond market. Citigroup has made a similar proposal for its World Government Bond Index (WGBI), but focusing on the CGB segment (Figure 6).
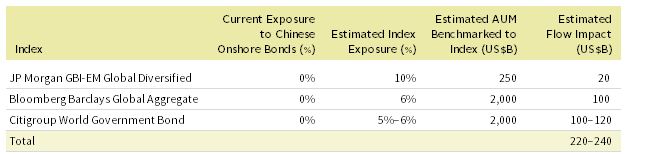
FIGURE 6 POTENTIAL INDEX WEIGHTS AND RESULTING FUND FLOWS
As of July 31, 2017
Sources: Barclays, Bloomberg L.P., Citigroup Global Markets, Goldman Sachs Investment Research, and J.P. Morgan Securities, Inc.
Notes: Estimates are subject to change. Excludes other indexes, which are estimated to contribute ~US$10 billion.
The impact on local currency emerging markets bond indexes could be much larger, with China conceptually reaching 30% of such indexes. However, most index providers calculate “constrained” versions of their emerging markets debt benchmarks, which typically cap a country’s weight at 10%. It is widely expected this would be applied to China when the time comes for index inclusion.
As a result, current estimates of the index-related flows into onshore bonds are in the range of US$220 billion to US$240 billion. For context, this is less than the expected CGB bond issuance in 2018. While Goldman Sachs estimates that foreign inflows into the CIBM could reach US$1 trillion over the coming decade, near-term fund flows will be much more muted. Most observers see index inclusion starting in 2018 at the earliest, and potentially not until 2020. Thus, investors do not need to rush in today in advance of a flood of index money.
Risk/Return Characteristics
Regardless of the timing of eventual index inclusion, onshore Chinese bonds are very likely to join global benchmarks in the coming years. To understand the impact of inclusion, we analyze Chinese central government bonds, as these are the most likely to join global and emerging markets bond indexes in the intermediate term. (For analysis of other onshore bond segments, see Appendix 1.) [All three appendices can be found in the pdf.]
Historically, Chinese government bonds have exhibited risk/return characteristics more akin to high-quality developed markets sovereign bonds than emerging markets local currency sovereign bonds. Since January 2004 (when our data begin) onshore Chinese government bonds have generated annualized total returns similar to US and global government bonds, but well below those of emerging markets sovereign bonds, based on representative index returns. This is because bond yields in China have historically been more similar to developed markets than emerging markets, and that remains the case today (Figure 7).
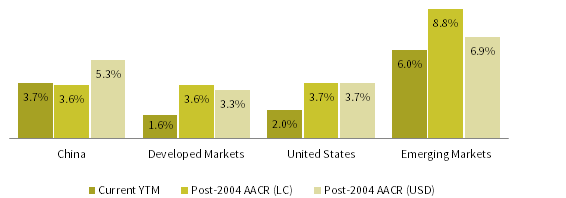
FIGURE 7 GOVERNMENT BOND YIELD AND RETURN COMPARISON
As of September 30, 2017
Source: Barclays, Bloomberg L.P., Citigroup Global Markets, J.P. Morgan Securities, Inc., and Thomson Reuters Datastream.
Note: China is represented by JP Morgan GBI-EM Broad China Index, developed markets is represented by Citigroup World Government Bond Index, United States is represented by Bloomberg Barclays US Aggregate Treasury Index, and emerging markets is represented by JP Morgan GBI-EM Global Diversified Index.
In terms of volatility, in local currency terms Chinese bonds are no more volatile than US Treasuries. Indeed, in local currency terms, most bond markets have average volatility in the 3%–4% range. Given that China has historically kept a tight leash on the RMB and that for much of the 2004–17 period the RMB has appreciated, the volatility of Chinese government bonds in USD terms over this timeframe has been only marginally higher than it is in local currency terms. This is in contrast to global bonds and emerging markets bonds, which saw their USD volatility double and triple, respectively (Figure 8).

FIGURE 8 GOVERNMENT BOND VOLATILITY COMPARISON
January 31, 2004 – September 30, 2017
Source: Barclays, Bloomberg L.P., Citigroup Global Markets, J.P. Morgan Securities, Inc., and Thomson Reuters Datastream.
Note: China is represented by JP Morgan GBI-EM Broad China Index, developed markets is represented by Citigroup World Government Bond Index, United States is represented by Bloomberg Barclays US Aggregate Treasury Index, and emerging markets is represented by JP Morgan GBI-EM Global Diversified Index.
Correlation analysis (in local currency terms) also highlights how Chinese government bonds are more similar to developed markets sovereign bonds (correlation of 29%) than emerging markets government bonds (correlation of 16%). The lower volatility and correlation of CGBs to emerging markets government bonds likely reflects that China runs a current account surplus and is a net creditor to the world. In contrast, most of the countries that make up emerging markets bond indexes run current account deficits and rely on foreign investors to fund government borrowing. Consequently, in periods of market stress, Chinese government bonds tend to rally, while emerging markets currencies tend to sell off as foreign investors pull out of the market and domestic institutions can’t absorb the selling, resulting in negative emerging markets bond returns in hard currency terms. During the last three large global equity market sell-offs (2007–09, 2011, and 2015–16), Chinese government bonds produced positive or flat returns (Figure 9).
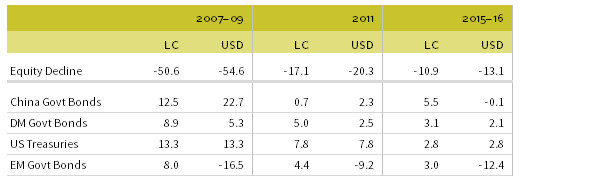
FIGURE 9 GOVERNMENT BOND PERFORMANCE DURING EQUITY MARKET DECLINES
Percent (%)
Sources: Barclays, Bloomberg L.P., Citigroup Global Markets, J.P. Morgan Securities, Inc., MSCI Inc., and Thomson Reuters Datastream. MSCI data provided “as is” without any express or implied warranties.
Notes: China government bond is represented by JP Morgan GBI-EM Broad China Index, developed markets government bonds is represented by Citigroup World Government Bond Index, US Treasuries is represented by Bloomberg Barclays US Aggregate Treasury Index, and emerging markets government bond is represented by JP Morgan GBI-EM Global Diversified Index. Equity decline dates are based on the MSCI All Country World Index gross of dividend taxes using monthly returns closest to the dates of equity market peaks and troughs.
Overall, the combination of a current account surplus, a partially closed capital account, and a market dominated by domestic investors with a buy-and-hold mentality makes Chinese government bonds more akin to developed markets sovereign bonds than emerging markets sovereign bonds. Indeed, the addition of CGBs to global fixed income benchmarks should have the impact of lowering overall index volatility, especially given the low correlation of Chinese government bonds to other bond markets. This should give comfort to investors in global sovereign bond strategies, but is a double-edged sword for emerging markets sovereign bond investors, who may see overall asset class returns reduced by the low yield on China government bonds relative to emerging markets bonds.
Market Outlook
Many investors are excited about Chinese bonds given ten-year sovereign yields north of 3.6%. Interest rates in China have been rising amid monetary tightening by the PBOC to support the RMB and rein in financial market excesses. Though yields are below their 2013 peaks, spreads versus other developed bond markets are reaching ten-year highs, with the spread against US Treasuries a notable exception (Figure 10).
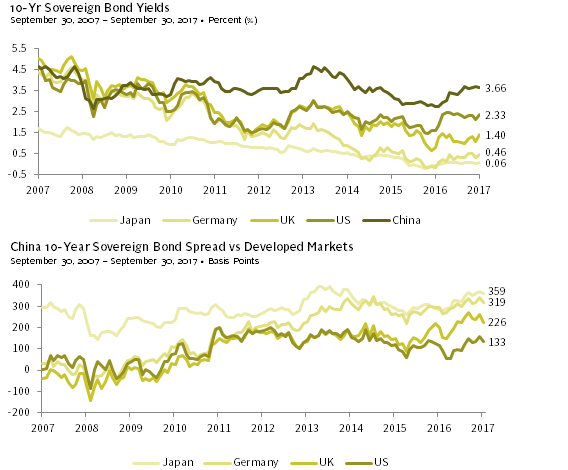
FIGURE 10 SOVEREIGN BOND YIELDS AND SPREADS
Source: Thomson Reuters Datastream.
However, the RMB remains a major concern for investors, as renewed currency weakness could wipe out any extra return from higher yields. At the same time, hedging the RMB is difficult and costly. Our analysis shows the implied negative carry from hedging RMB back to USD, both for CNY and CNH (Figure 11). Negative carry for CNH has generally been higher than CNY and has become more volatile since 2015, as the PBOC has routinely intervened in the offshore market to squeeze short sellers and support the RMB. Once CNH hedging is factored in, the yield on Chinese bonds falls from 3.66% to 1.37%, lower than the carry-adjusted bond yields for Germany (2.69%) and Japan (2.12%). The hedged yields would be even worse for European and Japanese investors, as we show in Appendix 2.
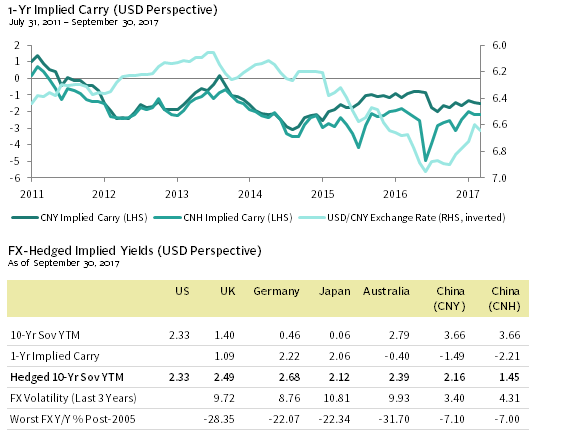
FIGURE 11 THE COST OF HEDGING RMB EXPOSURE
Source: Thomson Reuters Datastream.
Note: Implied carry is based on one-year FX forwards.
RMB-hedged China bond exposure is thus not a yield play, but a bet that bond yields will fall (i.e., a hope for capital appreciation). RMB-hedged exposure may appeal to investors that have a bearish view on the Chinese economy. Indeed, a long-term bullish case can be made for Chinese bonds should the economy slip into a Japan-like deflationary stagnation due to China’s growing debt overhang.
At the same time, some investors are comfortable with unhedged exposure to Chinese yields and the RMB. This is based on a view that the RMB is set to appreciate due to continued USD weakness and/or because they view the RMB as a “managed” currency that is inherently less volatile than other currencies (including developed markets currencies), given China’s FX reserves and the PBOC’s historical willingness to intervene to support the RMB. Unhedged exposure is thus a bet on RMB appreciation.
What complicates the outlook for the RMB and Chinese bond yields is China’s closed capital account, which keeps domestic savings trapped and domestic asset values inflated. Chinese investors have pent-up demand to globally diversify their portfolios. Any time China relaxes capital controls, outflows increase, putting downward pressure on the RMB. This is a different dynamic than what has occurred over the past decade or so, where China has largely pegged the RMB to the USD and kept the capital account closed.
Although China has ample domestic savings, resumed capital outflows and the need to sell FX reserves to support the RMB could send interest rates higher, doubly hurting foreign investors. The threat of capital outflows is a long-term headwind for the RMB, and the recent push by Chinese authorities to open the CIBM to foreign investors is very likely based on hopes that foreign inflows will help offset domestic outflows. All that can be said is that the volatility of the RMB will likely be higher going forward than in the past. Thus, investors must decide whether they are comfortable with the currency risk, and look at historical data with a grain of salt.
Conclusion and Implementation
The onshore Chinese bond market is now open to foreign investors. But despite its seemingly large size, it is still far from fully investable, especially the corporate credit space. As Chinese government bonds are added to global fixed income benchmarks, overall index volatility will likely be lowered given the risk/return profile and correlations of onshore Chinese bonds, with the impact likely to be greater for emerging markets sovereign bond benchmarks.
We are not enthusiastic about dedicated allocations to Chinese bonds for most investors. Current yields offer little buffer against any resumed RMB weakness, and the negative carry from hedging the RMB removes any pick up in yield. For now, we prefer investors gain exposure to onshore Chinese bonds through allocations to global bond managers or Asian/emerging markets debt active managers, many of whom will likely begin to add exposure ahead of index inclusion.
Dedicated Chinese bond allocations may be more appealing to institutions or investors that have RMB liabilities or spending needs. In addition, investors with high conviction in RMB strength and willingness to tolerate the extra volatility may find RMB bonds more attractive than global bonds, or a complement to such exposure. However, such an investment would largely be a currency play.
Based on recent conversations with global asset managers, most are taking a measured approach to the onshore bond market and building up their capabilities. They are not in a rush to launch China-only fixed income mandates, but rather will introduce exposure via global and regional strategies. With that said, there are a handful of managers with existing products and/or the ability to run separate accounts. There are also a few domestic Chinese asset managers with institutional-quality products available for foreign investors.
For those interested in direct passive exposure, a partial list of currently available exchange-traded funds (ETFs) is included in Appendix 3. Given the very small size of assets under management for these ETFs (the largest is only US$159 million) and the related poor liquidity, at this juncture we do not advise investors to gain passive exposure via ETFs.
Aaron Costello, Managing Director
Han Xu, Investment Associate
Footnotes