Despite its economic size, China remains under-represented in global investment benchmarks. China accounts for 15% of global GDP,[1]Based on IMF data and nominal GDP in USD terms. While purchasing-power-parity-adjusted GDP weights are often cited, these are inappropriate to compare to index market-cap weights, which are in … Continue reading but less than 3% of global equity benchmarks, and effectively 0% of global fixed income benchmarks. Rather than a reflection of the size of China’s domestic markets, this gap reflects limits on foreign investor access, as well as issues regarding free float and liquidity. However, recently announced reforms have the potential to improve investor access and increase China’s weight in global benchmarks. This brief covers new developments in China’s domestic markets and their potential near- and longer-term impacts.
Dramatic Opening of the Onshore Bond Market, But Limited Near-Term Impact
Previously accessible only to “sovereign investors” such as global central banks, the People’s Bank of China (PBOC) announced in February that the onshore renminbi-denominated bond market would be open to a broad array of institutional investors with no quota or repatriation restrictions—a dramatic change. While the program has yet to get fully underway (details were only released in May), at face value this means the onshore bond market is now open to foreign investors, who can buy and sell as much as they please, when they please.
The PBOC’s announcement triggered the major index providers to place onshore RMB-denominated bonds on watch for possible index inclusion. Currently, China is excluded from the major local currency government bond indexes, including the Citigroup World Government Bond Index (WGBI) and the J.P. Morgan GBI-EM Global Diversified Index, a widely used emerging markets (EM) local currency bond index. China does account for 0.5% of the Bloomberg Barclays Global Aggregate Bond Index (Global Agg), but this exposure reflects offshore USD-denominated investment-grade debt from Chinese issuers, not RMB-denominated debt.
According to figures from China Central Depository & Clearing, the onshore RMB-denominated fixed income market is US$6.1 trillion in size. This makes China the fourth largest global bond market. If included in full in the Global Agg, China would account for 11%.

Size of Bond Markets in the Global Aggregate Index vs the China Onshore RMB Market
As of July 31, 2016 • USD Billions
Sources: Barclays, Bloomberg L.P., and ChinaBond.
Note: Size based on the Bloomberg Barclays Global Aggregate Index, except for RMB-denominated bonds, the size of which is based on data from ChinaBond.
However, this overstates the potential near-term size of China in fixed income benchmarks. Despite its large size, the Chinese onshore bond market is rather illiquid, given that most bonds are bought and held to maturity by major banks. This is especially the case for corporate bonds. Further, few domestic Chinese corporate bonds are rated by the international ratings agencies, typically a requirement for index inclusion. As a result, most analysis has focused on the impact of including Chinese central government treasury bonds, which at US$1.5 trillion account for a quarter of the onshore market. Yet even here, determining the size of the liquid/investable portion of this segment is challenging.

Composition of the RMB Onshore Bond Market
As of July 31, 2016
Source: ChinaBond.
These issues help explain why it will take index providers several months to consult with market participants about how to proceed. Providers will also want to see whether foreign investors can successfully access the market, given the program is still very new. As of this writing, the major index providers have not yet provided guidance on how they will include China in their benchmarks. Decisions are expected to be announced by the end of the year, and most observers expect China to be added to benchmarks over the course of 2017.
J.P. Morgan research estimates that China could initially be weighted at 2% of the Global Agg, 5% of WGBI, and 10% of the GBI-EM Global Diversified.[2]The GBI-EM Global Diversified Index limits single-country exposures to 10% of the index. J.P. Morgan tracks US$520 billion in Chinese government bonds, which account for 30% of the unconstrained … Continue reading No matter what the actual percentages turn out to be, they will be lower than the total size of China’s onshore bond market, reflecting the limited free float of the market. Thus, despite the opening of the world’s fourth largest bond market, China will not reshape global fixed income benchmarks in the near term. Still, this change paves the way for further increases, especially as issuance in China is expected to increase over the coming years.
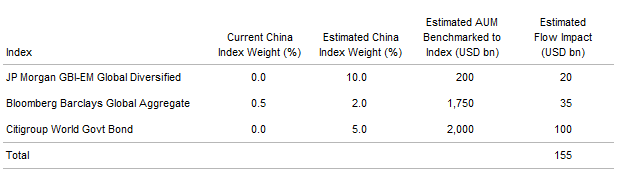
J.P. Morgan Estimates of China’s Potential Bond Index Weights and Fund Flows
As of May 31, 2016
Sources: Barclays, Bloomberg L.P., Citigroup Global Markets, and J.P. Morgan Securities, Inc.
Note: Estimates are subject to change.
Improved Access to Onshore Equities, But Still Not Enough for MSCI and FTSE
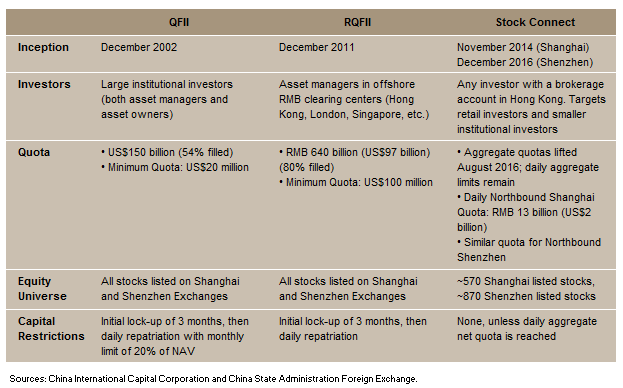
The onshore Chinese A-share market is one of the largest equity markets in the world, but one which most investors have little exposure to given the difficulties in obtaining quota access. Over late 2015 and early 2016, Chinese authorities made significant changes to the Qualified Foreign Institutional Investor (QFII) program[3]Please refer to the Appendix for an overview of China’s A-share access programs. to streamline the approval process, shorten the initial lock-up period, and allow daily repatriation of funds, all in an attempt to persuade MSCI to start including A-shares in the company’s widely followed global equity benchmarks.
Yet in June 2016, and for the third year in a row, MSCI announced it would keep A-shares under review given feedback from market participants. While commending China on improving access for foreign investors over the previous year, MSCI cited three broad concerns for delaying A-share inclusion: (1) share suspensions, (2) quota and repatriation limits, and (3) pre-approval of A-share index-linked products.
Somewhat unique to China, A-share companies can ask to have their shares voluntarily suspended from trading. During the June/July 2015 market crash, nearly 50% of Shanghai-listed stocks were suspended, and on some days the combination of voluntary suspensions and individual stock circuit breakers resulted in the entire market being untradeable, according to analysis by Gavekal Research. New regulations have been put in place to limit the amount of time stocks can be voluntary suspended (a range of ten days to five months), though investors remain concerned about the ease with which companies can do this. MSCI has stated that more time is needed to see whether the guidelines are effectively implemented.
Regarding quota and repatriation limits, MSCI is also taking a wait-and-see approach. While recent changes, in theory, resolve MSCI’s concerns, implementation issues continue to be reported and a backlog of quota applications remains. More contentiously, an aggregate quota of US$150 billion is still imposed, as is a monthly repatriation limit of only 20% of net asset value. These limits frustrate the major index fund and exchange-traded fund (ETF) providers which have influence on MSCI’s decision process.
The pre-approval of A-share index-linked products by Chinese regulators also frustrates asset managers, as it could result in a delay between when A-shares are in the benchmark and when new and existing index products can include them. This issue remains unaddressed and resolving it is deemed essential by asset managers if A-shares are to be included. Yet this issue, alongside the loosening of the monthly repatriation limit, could be easily addressed over the coming year.
Indeed, the announcement of the Shenzhen–Hong Kong Stock Connect program in August illustrates that opening the A-share market remains a priority for Chinese authorities. The announcement surprised investors by stating that the new scheme would not have an aggregate quota limit and also removed the quota on the existing Shanghai–Hong Kong Stock Connect.[4]Launched November 2014, the Shanghai–Hong Kong Stock Connect program allows any investor with a brokerage account in Hong Kong to purchase select A-shares trading in Shanghai. The Shenzhen Connect … Continue reading While daily quotas of ~US$2 billion remain in place for each of the Stock Connect programs, investors can, in theory, accumulate as many A-shares as they like over time. This has raised speculation that the various quota programs may be merged or abolished over the coming year. If this or any other meaningful change occurs, MSCI has reserved the right to allow an off-cycle announcement ahead of the June 2017 Market Classification Review.
Overall, the hurdles preventing A-shares from being included in the MSCI indexes seem easily cleared, should China decide to push forward. Index rival FTSE has already produced a set of indexes that include A-shares; the US$60 billion Vanguard Emerging Markets Stock Index Fund has successfully transitioned to one of them, implying large funds can access the A-share market.[5]On August 31, the Vanguard Emerging Markets Stock Index Fund completed its transition to benchmark against the FTSE® Emerging Markets All Cap China A Inclusion Index. Vanguard claims this is the … Continue reading Yet, at its September Country Classification Review, FTSE also chose not to upgrade A-shares to the standard FTSE global index family, instead keeping them on the watch list for next year.
Currently, China composes 2.8% of the MSCI All Country World Index (ACWI) and 26.0% of the MSCI Emerging Markets Index. This exposure only reflects the offshore Chinese equity universe of stocks listed primarily in Hong Kong and the United States,[6]Since the beginning of 2016, ADRs (American depositary receipts) such as Alibaba and Baidu have been included in the MSCI indexes, addressing an important gap in index coverage. In fact, it was … Continue reading and represents less than one-third of the total Chinese equity universe. With a full-float market cap of US$5.4 trillion, the domestic A-share market on its own is the second largest stock market in the world.
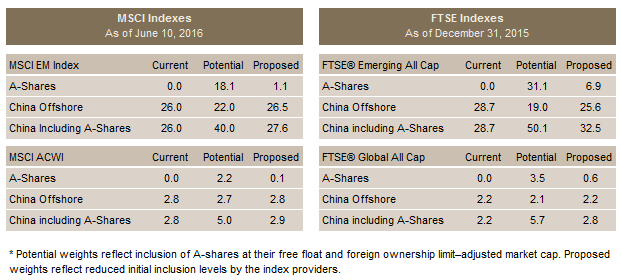
China’s Current, Potential, and Proposed Weights in Global Equity Indexes*
Percent (%)
Sources: FTSE International Limited and MSCI Inc. MSCI data provided “as is” without any express or implied warranties.
Notes: For MSCI, proposed implies A-shares are limited to only 5% of their free float and foreign ownership limit–adjusted
market cap. For FTSE, proposed implies A-share weight is capped by the aggregate QFII/RQFII quota.
However, like China’s bond market, looking at the total size overstates the investable size of the market, due to restricted free float and foreign ownership limits (see sidebar below). Taking these limits into account, MSCI estimates the inclusion of A-shares could potentially increase China’s weight in ACWI to 5% and in the EM index to 40%. The weights are similar to FTSE’s estimates for how large China could become in its global indexes, although China would account for 50% of the FTSE EM index, given that the index does not include Korea.
While these are the potential amounts that China’s weights may reach if A-shares are included in the global indexes, as of now the proposal from MSCI is to start small, increasing China’s weight in the MSCI EM index by only 1.1 percentage points (ppts) and only 0.1 ppt for ACWI. FTSE’s quota-constrained A-share inclusion global index only increases China’s weight by 6.9 ppts for EM and 0.6 ppt for global. These low initial weights reflect the implementation challenges imposed by the current quota system.
How Large Is China’s Equity Market?
With a full-float market cap of US$5.4 trillion, the domestic A-share market on its own is the second largest stock market in the world. Yet, similar to the onshore bond market, looking at the total size of the market overstates the investable size of the market.
By MSCI’s calculation, only 38% of A-share market capitalization is free floating, reflecting the fact that the market is concentrated in state-owned enterprises with most of the shares held by the government. For instance, PetroChina is the largest stock in the A-share market by full float, but is deemed to only have a 2% free float, while Industrial and Commercial Bank of China (the second largest stock) has a 6% free float. The free float for offshore-listed stocks is only marginally better, with China Mobile (the largest HK-listed stock) at 30% and Alibaba (the largest US-listed stock), 40%. Overall, the free float outstanding for the All China universe is only 42%. This compares to 80% for ACWI and 50% for EM, highlighting that low free float is an issue for EM companies in general.
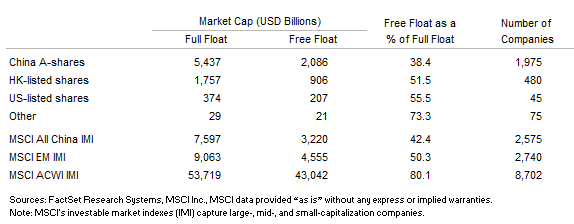
MSCI All China Index Breakdown
As of July 31, 2016
Free float is important as it reflects the investable portion of the market and helps prevent distortions in index performance. Stocks with limited free float are arguably more volatile and prone to overshoots; this partially explains the volatility of A-shares, and was also an issue for Japanese stocks in the 1980s, overstating their size in global indexes. For example, on an unadjusted basis, Japan grew to become the largest stock market in the world in the late 1980s, exceeding 40% of the MSCI World Index, which was not free-float adjusted at the time.
After adjusting for limited free float, Chinese equities as a whole would still have a market cap of US$3.2 trillion, ranking as the third largest stock market and accounting for 7.1% of ACWI and a whopping 48.3% of EM. Further complicating matters is the 30% foreign ownership limit placed on A-share companies. Adjusting for this further reduces China’s potential weight to 5.0% for ACWI and 40.0% for EM. Thus, China’s potential share of global market cap shrinks from nearly 13% to 5% due to free float and ownership restrictions on A-shares. Still, A-shares have the potential to nearly double China’s weight in global equity benchmarks if the index providers move forward with inclusion.

Conceptualizing China’s Weight in MSCI IMI Indexes
As of July 31, 2016
Don’t Expect a Flood
Overall, while China’s domestic markets may soon be included in global benchmarks, the expected small size of the initial inclusion is likely not large enough to trigger passive inflows that would meaningfully impact asset prices in these markets.
In fixed income, J.P. Morgan estimates that US$155 billion could flow into the Chinese government bond market by the end of 2017 due to index inclusion based on the AUM tracking these indexes. Such flows would only partially absorb the expected US$200 billion in new issuance next year. It is true that in a world of negative bond yields, the 2.7% yield on offer in China will appear attractive to many fixed income investors, but may not be high enough to compensate for risk of RMB weakness, especially since it is difficult to hedge RMB exposure and doing so will remove any yield pickup. Part of the impetus for China’s surprise opening of its bond market is to attract foreign inflows to help offset domestic outflows, which spiked earlier this year. While outflows and the RMB have stabilized recently, it is unclear whether foreign buying would be enough to offset domestic outflows should US rates rise and the RMB resume weakening.
In equities, MSCI’s proposal would result in approximately US$20 billion in additional market cap, less than one day’s average trading volume in the A-share market. While FTSE’s inclusion indexes have higher initial weights, fewer assets track the FTSE indexes, resulting in a smaller amount of passive flows.
Even if MSCI ultimately decides to ramp up the initial allocation to A-shares, it is unclear that investors will rush into the market. The A-share market is very volatile and relatively expensive compared to Hong Kong–listed Chinese equities, which currently trade at a 20%–30% discount to A-shares. Despite the Shanghai–Hong Kong Stock Connect being open for nearly two years, less than half of the “northbound” (Hong Kong to Shanghai) quota had been utilized, while “southbound” flows from China into Hong Kong had reached 90% of the quota. With the launch of the Shenzhen Connect and the removal of aggregate quotas for the Shanghai program, more money may continue to flow south than north.
Thinking Holistically and Looking Ahead
Given that the increase in benchmark weights will occur gradually over the next few years, investors should not be in a rush to increase exposure to China. Investors also need to think holistically about their China exposure, looking across equity, hedge fund, and private equity exposures. Portfolios with EM equity overweights may already have sufficient China exposure relative to equity benchmarks, while exposure to China via private equity and hedge funds may compensate for any perceived underweight in public equities.
Furthermore, focusing on China’s share of market capitalization fails to consider indirect exposures that companies outside of China have to the Chinese economy (and exposures Chinese companies have outside of China). A way to gauge these exposures is to look at company revenue. According to data from MSCI, China accounts for 12.7% of ACWI constituent revenues. Interestingly, this figure is relatively close to China’s share of global GDP, implying that, while the ACWI benchmark appears to be underweight Chinese equities, global companies are capturing an appropriate share of revenues from China.
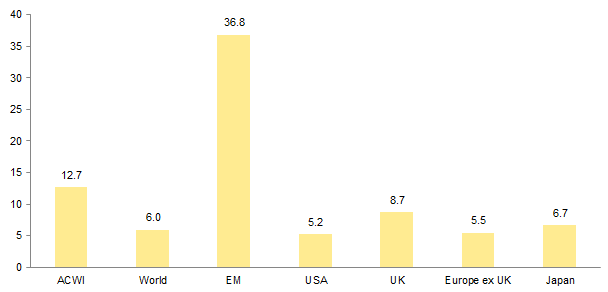
Index Revenue Exposure from China
As of July 31, 2016 • Percent (%)
Source: MSCI Inc. MSCI data provided “as is” without any express or implied warranties.
Note: Based on MSCI revenue exposure data.
Still, assuming China moves forward in opening its domestic markets, global investors need to consider the emergence of an investment world where China starts to command dedicated portfolio allocations that are distinct from broad emerging markets, which will become even more dominated by China. Indeed, EM ex China indexes and products may become commonplace in the years ahead, for both fixed income and equities.
For instance, the inclusion of RMB-denominated bonds into EM local currency debt indexes may impact the risk/return profile of the asset class given China’s lower yields relative to the index, but also less volatile currency compared to other EM currencies. While some investors may welcome this, others may not, which may result in ex China versions of EM debt indexes, especially for unconstrained indexes. For broad global investment-grade bond indexes, Chinese bonds may modestly increase overall yields, but should not impact the overall risk/return profile as China will not dominate the index.
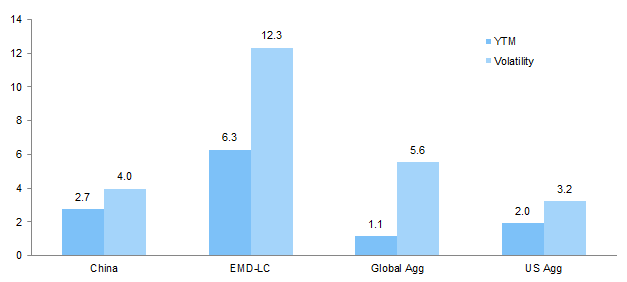
Fixed Income Yield and Volatility
As of August 31, 2016
Sources: Barclays, Bloomberg L.P., J.P. Morgan Securities Inc., and Thomson Reuters Datastream.
Notes: YTM is yield to maturity. Volatility measures the annualized standard deviation of USD index returns between December 31, 2003, and August 31, 2016. “China” represents the J.P. Morgan GBI-EM Broad China Index, “EMD-LC” represents the J.P. Morgan GBI-EM Global Diversified Index, “Global Agg” represents the Bloomberg Barclays Global Aggregate Index and “US Agg” represents the Bloomberg Barclays US Aggregate Index.
As of now, the need for dedicated China fixed income managers seems limited for most investors, with exposure best gained through global or regional fixed income mandates, which allow managers the flexibility to allocate to Chinese bonds as they deem fit.
The case for dedicated China managers is more compelling in the equity space (both long-only and equity hedge funds), particularly managers that have the flexibility to increase China exposure across onshore and offshore equities. With China potentially growing to 40%–50% of the EM equity market, China specialist managers may prove to add more value than EM generalists, especially among A-share stocks, which require more local knowledge.
For an overview of the A-share market, please see Aaron Costello et al., “The Door Is Opening: An Overview of the Chinese A-Share Market,” Cambridge Associates Research Report, October 2013.
This is recognition that (1) the Chinese equity universe is large and deep enough to support dedicated managers; (2) active management is a better way to capture China’s growing size in global indexes, as the manager makes the relative value/timing decision across share classes; and (3) active managers have shown the ability to add value in Chinese equities, given the retail-driven nature and lopsided, top-heavy structure of the market.
The Bottom Line
China’s weight in global benchmarks is set to rise over the coming years, and most investors are underweight China today relative to future benchmark weights. However, we do not think investors should rush to increase China exposure. Index weights will rise slowly, while free-float and liquidity issues will still cap the size of China in benchmarks relative to the total size of the country’s equity and bond markets. As a result, a flood of foreign capital into China is unlikely, especially given current valuation and currency concerns. The A-share market remains expensive relative to offshore Chinese equities, and renewed RMB weakness could overwhelm the modest incremental yield from Chinese bonds.
Instead of rushing to increase equity and bond exposure now, investors should instead think holistically about their current Chinese exposure, looking across long-only, hedge fund, and private equity allocations. Investors should also realize that economic exposure to China is greater than direct Chinese equity exposure, given global revenues from China. Still, investors should prepare for an investment landscape where China starts to command dedicated portfolio allocations that are distinct from broad emerging markets, which will become even more dominated by China.
Appendix: A-Share Access Programs
Qualified Foreign Institutional Investor (QFII)
Launched in December 2002, the QFII program is geared toward large institutional investors, both asset managers and asset owners. Investors need a minimum AUM of US$500 million and the ability to receive a base quota of US$20 million. The aggregate quota has grown from US$20 billion in 2002 to US$150 billion currently. Over 270 licenses have been issued, totaling US$81.5 billion (54% of aggregate quota).
RMB Qualified Foreign Institutional Investor (RQFII)
Launched in December 2011, the RQFII program is geared toward asset managers located in financial centers with offshore RMB clearing (Hong Kong, London, Singapore, etc). The RQFII program has evolved significantly over the years. Initially exclusively for Chinese asset managers with Hong Kong subsidiaries and confined to fixed income and balanced fund mandates, the program was extended to allow Chinese institutions to issue A-share ETFs. It has since been expanded to allow any financial institution in an offshore RMB clearing center to offer products with any investment mandate. The aggregate quota has grown from RMB 20 billion (US$3 billion) to RMB 640 billion (US$97 billion). Over 170 licenses have been issued, totaling RMB 510.3 billion (US$76.4 billion) (80% of aggregate quota).
Hong Kong Stock Connect
Launched November 2014, the Shanghai–Hong Kong Stock Connect program allows any investor with a brokerage account in Hong Kong to purchase select A-shares trading in Shanghai. In August 2016, a similar program was announced for the Shenzhen exchange, expected to be active by the end of the year. The programs target retail investors and smaller institutional investors.
Initially, the Shanghai–Hong Kong Stock Connect had an aggregate quota of RMB 300 billion (US$45.5 billion) and a daily quota of RMB 13 billion (US$2 billion) for Northbound (Shanghai) flows. Southbound (Hong Kong) quotas were smaller at an aggregate quota of RMB 250 billion (US$37.9 billion) and daily quota of RMB 10.5 billion (US$1.6 billion). However, the August announcement stated aggregate quotas will be lifted for both Connect programs, while daily quotas will remain.
Aaron Costello, Managing Director
Han Xu, Investment Associate
Footnotes