Advice in Brief
- The consensus view that a global recession is not imminent seems reasonable, but the possibility cannot be ruled out. This keeps us looking for bargains, but leaving the bar high, as most assets are not cheap and what is cheap is generally cyclically oriented.
- Asian emerging markets or Asia ex Japan equities offer appeal relative to US equities for long-term investors.
- Energy master limited partnerships are attractive.
- We prefer natural resources equities to index-like commodities, but would not overweight relative to broad equities today.
- Elevated yields on energy high-yield credits are tempting, but it is too early to move aggressively into this area.
- We continue to believe that private equity investments will ultimately provide the best opportunities in energy as distressed sellers part with upstream assets and oilfield services businesses.
- Low sovereign bond yields diminish the protection such bonds can provide, while increasing their opportunity cost. Beyond high-quality sovereign bonds, we advise focusing defensive positions in cash and hedge funds with less equity and credit exposure.
- Now is the time to be certain that liquidity is sufficient to support future spending needs and capital calls, rebalance, and take advantage of future opportunities.

Portfolio Tilts from C|A’s Chief Investment Strategist
Markets have become increasingly volatile. Economic growth has shown signs of slowing, and the lack of clarity around the future direction of Chinese policymakers and the US Federal Reserve has further elevated risk premiums. High growth expectations priced in to some markets have been lowered to better reflect the realities of a slow growth world. Credit spreads have risen and equity markets have fallen in a pattern reminiscent of 2011 when investors reassessed risk amid the escalation of the Eurozone crisis and the US debt ceiling standoff. The International Monetary Fund (IMF) has downgraded 2015 global growth expectations (again) from 3.3% to 3.1%. As the IMF states in its October 2015 Global Financial Stability Report, “in an environment of declining commodity prices, reduced capital flows to emerging markets and pressure on their currencies, and increasing financial markets volatility, downside risks to the outlook have risen, particularly for emerging market and developing economies.”
As markets adjust to slower growth prospects, we continue to monitor the investment landscape to evaluate developing opportunities. In this edition of VantagePoint, we briefly explore the investment implications of the growth slowdown. In particular, we assess opportunities in markets where valuations have cheapened most appreciably: emerging markets equities and commodity-related assets. We also take a deeper look at the degree to which the diversification offered by sovereign bonds, particularly US Treasuries, is worth the opportunity cost at today’s ultra-low yields.
Resetting Expectations
The market consensus is that economic growth will moderate, but a global recession is unlikely. Historical precedents to test this consensus are limited, as the economic and financial landscape has shifted over time. As many observers have noted, the closest historical parallel is the Asian financial crisis in the late 1990s when emerging markets entered recession, commodity prices plummeted, and developed markets growth softened, but managed to avoid recession. Many critical differences exist between now and then that make historical comparisons difficult. Most notably, emerging markets have increased from under 30% to roughly half of global GDP; the portion of developed markets corporate sales coming from emerging markets is now up to 15% to 20%; financial ownership of emerging markets assets by developed markets investors has increased from less than 1% to nearly 6% of developed markets assets; and the financial linkages between developed and emerging markets have increased, but are far more dispersed among many less leveraged players. Importantly, developed markets were able to respond to stressed conditions by easing monetary policy in 1998. Monetary policy offers more limited prospects today.
These differences suggest slower growth is likely, but provide no reason to conclude that a global recession is on the horizon. Economic growth, while slowing in some segments (e.g., manufactured goods), is gaining strength in services and remains reasonable in developed markets, particularly the United States. Changes in the nature of financial linkages make systemic risk less likely, although such risks can never be ruled out, of course. Further, investors should not underestimate the potential for lower commodity prices to boost disposable income to consumers in countries that are net commodity importers. This was an important factor that helped developed economies sustain growth in the late 1990s.
Developed markets exposures to emerging markets are higher today than in the 1990s, but most developed markets rely on “vulnerable” emerging markets for less than 2% of exports, according to analysis by Lombard Street Research.[1]Lombard Street Research defines vulnerable emerging markets as Brazil, Chile, China, Indonesia, Malaysia, Russia, South Africa, Thailand, and Turkey. These countries are vulnerable for a mixture of … Continue reading Exposures vary, with exports to such countries accounting for only 0.8% of US GDP, compared with nearly 4% of German GDP. Japan remains vulnerable because of close trade links to China, but much less so than was the case in the 1990s because of vastly lower financial linkages. The United Kingdom has relatively limited export reliance on stressed emerging markets, but its banks are among the most exposed regarding financial linkages.
For a discussion of our views on Eurozone and Japanese equities, see the third quarter edition of VantagePoint, published July 13, 2015.
Overall, the markets most exposed to a slowdown in emerging markets also have the cheapest valuations. We maintain our recommendation to overweight Eurozone and Japanese equities relative to US equities on a currency-hedged basis given relatively attractive valuations and continued strong earnings growth. Fundamentals remain relatively strong, valuations relatively attractive, and our broader investment thesis remains intact (Figure 1). Further, as discussed next, emerging markets equities now sell near their cheapest valuations on record.

Figure 1. Fundamentals and Valuations Support Overweighting Europe and Japan vs US Equities; Emerging Markets Trade Near Their Cheapest Valuations Ever
As of September 30, 2015
Sources: FactSet Research Systems, J.P. Morgan Securities, Inc., and MSCI Inc. MSCI data provided “as is” without any express or implied warranties.
Notes: The composite normalized price-earnings (P/E) ratio is calculated by dividing the inflation-adjusted index price by the simple average of three normalized earnings metrics: ten-year average real earnings (i.e., Shiller earnings), trend-line earnings, and return on equity (ROE)–adjusted earnings. The post-2001 ROE-adjusted P/E is used for Japan. Japan EPS growth estimates are for its fiscal years ending March 31. For example, the 2015 estimate is for the period April 1, 2015, to March 31, 2016. Estimates for 2017 are not available for emerging markets or emerging markets Asia.
* Emerging markets Asia and Japan data represent ROE-adjusted P/E ratios.
Emerging Markets Risk at an Attractive Price
The risks to emerging markets are well known. Commodity weakness, a slowdown in Chinese economic growth, falling currencies, and prospects for higher rates amid Fed tightening are key worries today. Corporate earnings are under pressure amid slowing global growth and sagging exports, corporate non-financial debt levels have risen, and credit spreads have widened. The asset class is vulnerable to a vicious cycle of poor returns and risk aversion that lead to capital outflows that further depress asset values, push currencies lower, and pressure interest rates higher, which in turn puts more stress on asset values, triggering more outflows. This cycle is particularly damaging to countries that rely on external funding to support current account deficits.
The very fact that these weaknesses are widely known is what makes the area of interest to long-term value-oriented investors. Emerging markets equities, both in aggregate and specifically in Asia, are now very undervalued, currencies are undervalued, and investor outflows have retraced much of the cumulative net inflows seen over the 2009 to early 2013 period. We continue to advise small overweights to Asia ex Japan or emerging Asia relative to US equities. Asian emerging markets may prove more defensive given their stronger financial position (e.g., larger current account surpluses and higher foreign exchange reserves) and ability to benefit from lower commodity prices as net commodity importers in aggregate. Investors initiating or maintaining such overweights should recognize that these assets may not outperform until estimates for both global growth and/or regional earnings are upgraded, and the timeframe for this has become more uncertain.
Leverage Blues
Corporations in emerging markets have increased leverage since 2007, raising concerns that companies will enter a period of deleveraging, much as some developed markets have experienced since the global financial crisis. This is a risk that bears watching. Non-financial private debt for emerging markets as a whole increased 50 ppts as a share of GDP to reach 127% of GDP by the end of 2014. Excluding China, the increase was roughly 20 ppts. Further, leverage ratios (total debt/EBITDA) of emerging markets corporations went from being well below those of developed markets in 2007 to slightly higher at roughly 2.65x according to BIS data.[2]Note that this may overstate leverage relative to listed equities. According to Morgan Stanley, much corporate borrowing is by unlisted entities. In their coverage universe, 70% of Asian market cap … Continue reading Of particular concern is external debt given the prospect of weaker earnings, depreciating currencies, and rising credit spreads that could be aggravated by Fed tightening, although, again, investors anticipating the Fed would move in September appear to have priced in some of this.
While these are valid concerns that we are monitoring closely, we believe there are several mitigating factors: some of this risk has been priced in to the market; only 10.5% of non-financial debt is external debt; emerging markets have substantially larger foreign exchange reserves today than in the late 1990s; and currency and duration asset/liability mismatches that were prevalent in the 1990s are now minimal.
Currencies Undervalued, but Vulnerable
See Aaron Costello and Jason Widjaja, “Assessing the Likelihood of Another EM Currency Crisis,” Cambridge Associates Research Note, September 2015, and “Are We Heading for an EM Currency Crisis?,” Cambridge Associates Market Commentary, September 2013.
We have written much about our view that a repeat of the late-1990s emerging markets currency crisis seems unlikely today.[4] The prevalence of flexible exchange rates, development of local currency debt markets, and higher foreign currency reserves have changed the character of emerging markets, making systemic crises less likely. Flexible exchange rates allow for gradual currency adjustments in contrast to more disruptive breaks in pegs, local currency bond markets permit better currency matching of income to liabilities, and higher foreign currency reserves enable more controlled currency depreciation amid capital outflows. Indeed, many countries today maintain adequate foreign exchange reserves to cover short-term external debt and foreign bank claims.
Of the 20 emerging markets currencies we track, the median real effective exchange rate is 4.5% below its long-term median and is now undervalued. The median emerging markets currency would need to fall another 7% in trade-weighted terms to reach lows seen in 2001. However, even as currencies have fallen considerably, further adjustments are needed and prospects for further declines and elevated volatility remain.
Pockets of undervaluation do exist, particularly in commodity-linked currencies with current account deficits, though these currencies are also the most vulnerable in today’s environment. Asian equities provide some shelter from currency risk, as roughly 40% of the MSCI Asia ex Japan Index and 36% of the MSCI Emerging Markets Asia Index is denominated in Hong Kong dollars, which are pegged to the US dollar. Of course, Asian equities do remain exposed to currency weakness, particularly if China seeks to further devalue the renminbi, or the Japanese yen weakens further, setting off devaluation by regional trade competitors. Although the renminbi needs to depreciate further given stress in the Chinese economy, we believe a major devaluation is unlikely.
Valuations Offer a Margin of Safety
Emerging markets equities have rarely been so cheap. The index as a whole trades at a cyclically adjusted P/E ratio of 10.7 and Asia ex Japan at 10.9, the 3rd and 6th percentile of the post-1995 historical distribution, respectively. Looking at the (admittedly short) historical data, emerging markets and Asia ex Japan have demonstrated strong subsequent performance from starting-point valuations equal to today’s levels or better. In absolute terms, all subsequent returns for emerging markets equities and Asia ex Japan were positive over the subsequent one-year horizon, and all but one were positive over the five-year horizon. Our analysis of emerging markets is limited by the short history. As you might expect, very undervalued periods are concentrated in the Asian financial crisis and the subsequent recession amid the tech/telecom bubble aftermath.
Many observers have pointed out that relative valuations are not as cheap today as they have been in the past and that investors should wait until relative values reach late-1990s depths (Figure 2). We would in turn highlight that relative valuations got to such depths in the late 1990s not because emerging markets were cheaper than they are today, but because developed markets equities reached bubble heights, led by the US market. Further, emerging markets have outperformed US and broad developed markets equities over the subsequent five-year period each time relative valuations reached today’s levels or better (Figure 3). The subsequent one-year track record for emerging markets relative performance under such conditions has been more mixed, but emerging markets equities have outperformed US and developed markets equities in the instances in which beginning-period absolute valuations were as cheap as they are now.
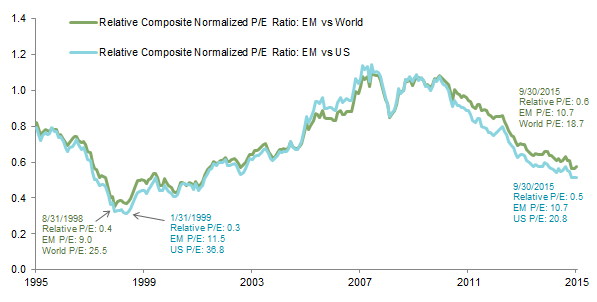
Figure 2. Emerging Markets Equities Relative Valuations Are Cheap, But Not Rock Bottom
September 30, 1995 – September 30, 2015
Sources: MSCI Inc. and Thomson Reuters Datastream. MSCI data provided “as is” without any express or implied warranties.

Figure 3. Emerging Markets Equities Have Tended to Outperform US Equities From Today’s Valuations
September 30, 1995 – September 30, 2015 • Local Currency
Sources: MSCI Inc. and Thomson Reuters Datastream. MSCI data provided “as is” without any express or implied warranties.
Cheapness in emerging markets today (in contrast with the late 1990s) is based on the relative stability of earnings as prices have declined. Emerging markets equity prices have dropped 34% in US$ terms since their peak in April 2011, but actually did not peak in local currency terms until April of this year. Through the end of September, the market has fallen 18%, a drop in the bucket compared to the 52% peak-to-trough decline in 2007–08 and the 47% decline in 1997–98.
Please see Sean McLaughlin et al., “Emerging Markets: Putting a Premium on Patience,” Cambridge Associates Research Note, September 2015.
Overall, we judge that the valuation discount provides an attractive opportunity for overweighting Asia ex Japan or emerging Asia relative to US equities, even as risks remain elevated. Investors pursuing this opportunity must exercise patience, as further global economic weakness or softening earnings will delay the return on this investment. We would expect emerging markets equities to underperform developed markets equities should emerging markets stress be worse than the market expects, more or less repeating the late 1990s experience of investors seeking safety in developed markets until valuations in developed markets become vulnerable as was the case with the tech bubble. However, fund flows out of dedicated emerging markets equity funds have been significant, suggesting much of the fickle, short-term capital has left the market. All of the 2012 inflows and 63% of the inflows since 2009 have been reversed, toward the high end of previous retracements (Figure 4). More broadly, the Institute of International Finance has estimated that net capital outflows from both residents and non-residents will be negative this year ($540 billion) for the first time since 1988. Outflows could certainly continue, putting further pressure on currencies and tightening economic conditions, but a meaningful amount of reversal has transpired at this point.
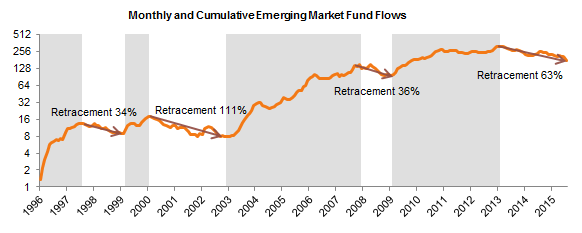
Figure 4. Fund Flows Out of Dedicated Emerging Markets Equity Funds Have Been Significant, Suggesting Fickle Capital Has Left the Market
February 29, 1996 – August 31, 2015 • US Dollars (Billions, Log Scale)
Source: EPFR Inc.
Notes: Shaded areas represent phases of capital inflows. Unshaded areas represent phases of capital outflow.
Down, Down, Down It Goes, Where It Stops Nobody Knows
Commodity prices, particularly energy and metals, continue their seemingly relentless slide. The ongoing divergence of well-informed views about where (and when) prices will bottom leads us to conclude there are too many variables to have high confidence in any one outcome. Our base case assumption with regard to oil is that it will take time for companies and markets to adjust to the end of the commodity super cycle and that prices may be range bound at lower levels for some time as markets, not OPEC, set prices and the marginal cost of production finds a cyclical bottom.
Important steps have been taken toward balancing supply and demand. Oil producers have slashed capital expenditures, reducing production capacity. Lower prices have supported demand, which continues to grow despite a slowing global economy. US crude oil production has leveled off and begun to decline. The longer prices stay depressed, and the lower they go, the more distress we expect to see along the energy complex and the more prices will ultimately need to increase to encourage cap ex in new productive capacity.
Given the ongoing uncertainty regarding when and at what price the oil market will settle, we continue to urge patience in opportunistic investments. We are neutral on Natural Resources Equities (NREs) despite their apparent cheapness, constructive on energy master limited partnerships (MLPs), and watching credit opportunities closely, although it still appears too early. Committing capital to private equity energy managers with the ability, skill, and patience to acquire upstream assets from distressed owners and distressed oilfield services businesses from unnatural owners offers the best approach to energy today.
Neutral on NREs
We currently regard NREs as very undervalued, using our preferred valuation methodology, normalized P/E ratios. Typically, we recommend overweighting very undervalued assets, and often meaningfully so, but we are proceeding more cautiously today for three main reasons: (1) the wide range of error around our valuation estimate suggests these equities may not be as cheap as they appear, (2) financial conditions for NREs have weakened materially, and (3) the link between earnings and uncertain commodity prices is strong, creating further potential for error in earnings estimates. Overall, we would not overweight NREs relative to global equities, as we are not confident that the valuation discount is adequate to justify this positioning. However, investors that have policy or neutral allocations to NREs should rebalance if they have not done so already given long-term prospects are reasonable to attractive, even as more downside risk may remain. We continue to advise an overweight to NREs versus index-like diversified commodity allocations in light of the implementation challenges of the latter.
Our normalized P/E metric today suggests that NREs, with a P/E of 8.5, sell at a 37% discount to their historical median, the 7th percentile of the distribution. Normalizing earnings is important in smoothing the impact of the business cycle on valuation analysis. We have found this to be a superior metric to trailing 12-month earnings, which tend to understate valuations at the bottom of a cycle, or forward earnings that are based on the consensus of analysts that notoriously extrapolate the past into the future. However, if earnings have meaningfully shifted trendlines, the normalization process can create a bias. Our composite real earnings for NREs grew at a 2.2% annual pace from 1973 through 2001, and then escalated to a 7.1% pace through September 2015, even with the recent decline (Figure 5). This general trend also appears in composite earnings for global equities, as earnings grew faster over the last decade or so than they did in the 1970s and 1980s. However, the difference was more muted, with about 1.5% growth in the early period and 2.8% growth more recently.
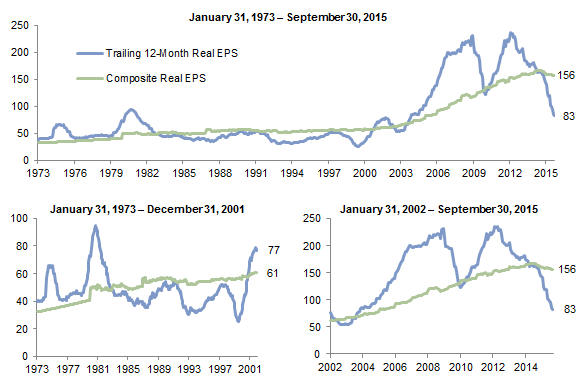
Figure 5. Do Composite Earnings for Natural Resources Equities Overstate Future Earnings Growth Prospects?
Source: MSCI Inc. MSCI data provided “as is” without any express or implied warranties.
Note: Composite earnings are the simple average of three normalized earnings metrics: ten-year average real earnings (i.e., Shiller earnings), trend-line earnings, and ROE-adjusted earnings.
Given the influence of China’s infrastructure investment on commodity demand over the recent period of exceptional natural resources price increases and earnings growth, it is reasonable to expect that 7.1% normalized real earnings growth will not be repeated. Normalization using such historical earnings may overstate prospective earnings. To test the importance of earnings growth on current valuations, we looked at where valuations would be today if normalized earnings grew at the same rate as global equity earnings (2.8%) instead of the more rapid 7.1% earnings experienced during the 2000s. The result: NREs would be fairly valued today, with a normalized P/E of 15, 11% above their long-term median. NREs are thus somewhere between fairly valued and very undervalued, and we choose to take a conservative view by not adding an NRE overweight relative to equities, particularly in light of the financial vulnerability should commodity prices remain low.
Many companies in the natural resources sector, particularly those exposed to energy and metals prices, have seen deterioration in revenues and earnings and are pressured under the weight of high debt levels. The practice of increasing borrowing to preserve dividends and buybacks amid earnings softness has become commonplace (Figure 6). High-yield credits of oil service firms and smaller independent exploration & production companies that are effectively shut out of the credit markets are under stress, while refiners and midstream operators that are less exposed to (and in some cases benefit from) lower energy prices are relatively stable. Stress in the metals and mining sector is more severe and continues to build. The 4.2% dividend yield on the MSCI World Natural Resources Index provides some comfort, particularly as the index is dominated by integrated energy majors with diverse revenue streams (and investment-grade credit ratings) that are likely to do whatever is in their power, including selling off assets, to maintain dividends.
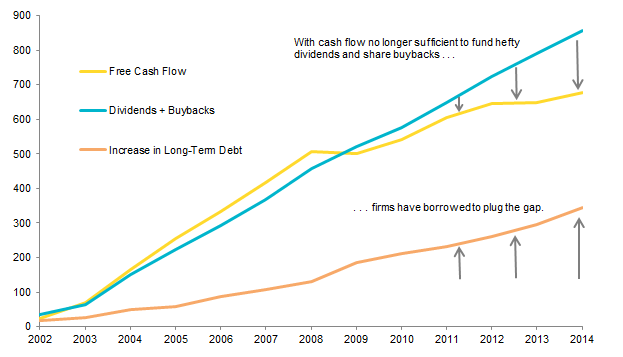
Figure 6. Firms Have Borrowed to Plug the Gap Between Dividends/Buybacks and Free Cash Flow
2002–2014 • US Dollars (Millions)
Source: Bloomberg L.P.
Notes: Universe of integrated-energy companies includes BP, Chevron, Conoco Phillips, Exxon Mobil, Royal Dutch Shell, and Total. Free cash flow is defined by Bloomberg as cash flow from operations less capital expenditures.
Like most investments related to energy, the key to fundamental health is commodity prices, which face an uncertain future. As Figure 7 shows, NRE earnings and oil prices are tightly linked.

Figure 7. Earnings for Natural Resources Equities Move in Sync With Oil Prices
January 31, 1986 – September 30, 2015 • Log Scale
Source: Thomson Reuters Datastream.
Energy MLPs Are Appealing
At yields of over 8%, energy MLPs look to offer good value to investors that use active managers targeting high-quality MLPs. Energy MLPs are generally focused on the midstream sector and earn cash flows based on volume distributed, similar to a toll road business model. Distribution growth comes from capital investment to build out energy pipelines and other infrastructure to increase volume. Midstream energy MLPs generally do not have direct energy price risk, as they are compensated on volume that is primarily priced through take-or-pay contracts that offer cash flow stability and transparency. Distribution growth is likely to slow from its historical rapid pace given that MLPs rely on capital markets to finance investment in capital expenditures required for meaningful increases in distribution growth. MLPs are becoming increasingly conservative in their capital allocation, focusing more on maintaining than on growing distributions.
However, MLPs are vulnerable to energy-price weakness if it is sustained for long enough to stop production in higher cost basins. Smaller MLPs that operate primarily in higher cost basins are therefore more vulnerable. MLPs are also at risk if capital markets go into a deep freeze, as they did in 2008. Because of their reliance on debt and equity markets, MLPs tend to sell off during periods of market stress. During the global financial crisis, better-quality MLPs maintained good access to capital, while low-quality partnerships with weak balance sheets were constrained. Today, bonds issued by many energy MLPs are not showing signs of stress. Upstream MLPs that have direct exposure to commodity prices and small MLPs that have undiversified operations concentrated with high-cost producers are under the most pressure.
If most energy MLPs have limited exposure to oil prices and reasonably healthy financials, why have they sold off? Among many viable theories, the most obvious is that they have sold off in sympathy with energy stocks (Figure 8). Because the vast majority of the Alerian MLP Index has limited direct exposure to oil prices, the sell-off seems to extend beyond fundamentals, particularly given the visibility of cash flows for the next couple of years. Further, distributions seem reasonably well protected; according to BofA Merrill Lynch, MLPs in their coverage universe have cash flow equal to 120% of MLP distributions on average.

Figure 8. Energy MLPs Selling Off in Sympathy With Falling Oil Prices
September 1, 2014 – October 2, 2015
Sources: Alerian, MSCI Inc., and Thomson Reuters Datastream. MSCI data provided “as is” without any express or implied warranties.
Note: Data are daily.
We believe that distributions should be relatively stable on the whole, as MLPs seem to be managing capital allocations carefully to preserve current distributions. However, we suspect that distribution growth will be more subdued than in the past. Still, 8% yields and distribution growth conservatively in the low single digits provide an opportunity for low double-digit returns. Add in the potential for (eventual) improvement in unit prices, and the investment has more upside potential. Relative to the last decade, MLP yields are in the 89th percentile, and MLP yield spreads over Treasuries and investment-grade credit are at similar historic extremes. From such levels, subsequent one-year returns have generally been very rewarding in the past (Figure 9). However, capital outflows from disenfranchised investors worried about energy prices and MLPs’ access to capital markets are exerting continued downward pressure on unit prices. After the worst quarter on record for MLPs (-22.1%) we can’t call the bottom, but believe a lot of pessimism is priced in, providing opportunity for bold investors.

Figure 9. MLP Returns Have Historically Been Strong From Today’s Starting Yields
As of September 30, 2015
Sources: Alerian, Barclays, and Thomson Reuters Datastream.
Notes: Data are daily. Yields based on Alerian MLP Index, Barclays US Aggregate Credit BAA Index, and Ten-Year US Treasury Constant Maturity rate.
* Median yield/spread is calculated since January 1, 2006, and current yield/spread percentile is determined based on yields since that date. Given the asset class’s rapid development, we view observations since January 1, 2006, as more representative than the Alerian MLP Index’s 1996 inception date.
High-Yield Energy Getting Interesting, but Too Early
The yield-to-worst on energy high-yield credits rocketed to 12.3% by the end of September based on the Barclays US High-Yield Bond Index, 425 bps above that of the broad US High-Yield Bond Index, 887 bps above the broad Investment-Grade Corporate Bond Index,[3]Note that the Barclays High-Yield Bond Index has a modified average duration of 4.4 years compared to the Corporate Index’s 7.1 year duration. Therefore, the yield spread overstates the risk … Continue reading and 1,100 bps above the yield on the five-year Treasury (Figure 10). In simplistic terms, the high-yield energy market is pricing in an annualized 13% default rate (assuming 40% recovery) based on the spread over investment-grade corporates. This is a pretty severe level of defaults considering the sector peaked at a default rate of 13% in 1999, and the worst annual default rate for the broad index was 14.7% during the global financial crisis.

Figure 10. Yield to Worst for Energy High-Yield Credit Has Rocketed Above Other Bonds
January 1, 2014 – September 30, 2015
Source: Barclays.
Note: Data are daily.
Whether these yields provide enough protection depends on how low prices go and how long they stay there. If oil prices remain near $45 (and gas at $2.75), basically flat for the next few years, JP Morgan expects average defaults to total a cumulative 25% in 2016 and 2017. This seems to be roughly in line with where the market is priced today based on our simple analysis. In the context of futures pricing, it looks slightly cheap, since the futures curve continues to discount higher pricing ahead—an average of $49 in 2016 and $56 in 2017. Of course, futures pricing is a reflection of the market pricing for hedging and is a poor predictor of future prices. If oil prices staged a mild recovery, averaging $55 through 2017, JP Morgan estimates defaults would be a cumulative 15.4% over 2016 and 2017, and return prospects would be somewhat attractive.
It appears that the market is pricing in a conservative amount of defaults today. If these defaults transpired, investors would be compensated for risk taking relative to investing in investment-grade corporates. In other words, if the realistic level of defaults priced in to US high-yield energy bonds comes to fruition, investors would receive returns approximately equal to the yield on investment-grade bonds. At 3.4%, it is difficult to be too enthusiastic about that prospect for the degree of risk taken. We would prefer to wait until the market discounts enough distress to increase the prospects of generating more equity-like returns. Investors may not need to wait that much longer given the sharp drops in recent weeks. Distress is also now relatively widespread, with approximately 40% of the face value of the Barclays High-Yield Energy Index trading at distressed levels (i.e., option-adjusted spread greater than 1,000 bps).
Sovereign Bonds
It seems highly unlikely that the European Central Bank or the Bank of Japan will raise rates, much less back off quantitative easing any time soon. However, the Fed seems closer, despite its decision to hold off in September, citing uncertain global economic conditions. The case for raising rates this year rests largely on wage inflation, evidence of which is mixed, with average hourly wages stagnating, while median wages and the Employment Cost Index are rising modestly. The poor September jobs report diminishes the pressure to raise rates, but other labor measures are sending conflicting signals (e.g., jobless claims and employment-based tax receipts show no signs of weakening). If US labor force data continue to tighten, the Fed will likely begin rate increases even if the global economy remains vulnerable.
Please see Celia Dallas et al., “Revisiting Fixed Income Investing When Interest Rates Rise,” Cambridge Associates Research Note, October 2015, for more analysis.
If the Fed raises policy rates, what should investors expect regarding returns on notes and bonds? Historical results have varied. Since 1970, there have been 11 periods in which the Fed has increased the Fed Funds rate by at least 100 bps. Both short- and long-duration Treasury yields have tended to move in sync with the Fed Funds rate, although ten-year yields have not risen by as much as two-year yields during most cycles (Figure 11). Longer-duration bonds often outperform those with shorter duration when policy rates increase, as the higher duration can be offset by a smaller increase in yield and higher coupon payments. For example, bonds with maturities of ten years or longer outperformed shorter-duration bonds and cash in five of the 11 periods, while cash outperformed Treasuries of all durations in the other six periods, although in three of the periods the outperformance was minor. Notably, five-year bonds were never the best performers because they offered lower yield relative to longer-dated bonds at the start of the tightening periods, and they have more interest rate sensitivity than cash.

Figure 11. Short- and Long-Duration Treasuries Tend to Move With Fed Funds Rate But Not in Perfect Harmony
June 30, 1976 – September 30, 2015 • Percent (%)
Source: Federal Reserve.
Many investors are understandably concerned that sales of Treasuries held by emerging markets in their foreign exchange reserves will cause rates to rise sharply. In fact, nearly 65% of central bank foreign exchange reserves are held in US dollar assets. However, Treasury holdings by central banks outside the United States tend to have shorter maturities—74% have a maturity of under five years, compared to 4% over ten years. This suggests that more pressure from flows on the shorter end of the curve, which is also most influenced by Fed policy, is likely. For investors worried about prospects of rising rates, hiding out in shorter-duration Treasuries is not a panacea.
A key difference between today and the historical record is that yields across the curve are well below where they were at the start of previous tightening cycles. With such low yields (and coupon income), will longer-dated bonds be able to outperform even if the yields rise less or fall when the short end increases? Consider what would happen if the Fed Funds rate increased to 3.5% at the end of three years, as the median Federal Open Market Committee voting member anticipates, and the spread between the Fed Funds rate and the ten-year Treasury remained at its median spread of 150 bps. A linear 300 bp increase over the three-year period from the current yield of 2.06% to 5.06% would result in a return of -12.6% cumulative (-4.4% annualized) on a constant-duration ten-year Treasury portfolio. Anything over a 90 bps increase would result in a negative total return. However, if the ten-year Treasury were yielding 6% today and increased the same 300 bps linearly, the cumulative three-year return would be 2.2%, or 0.7% annualized (Figure 12).

Figure 12. Today’s Low Treasury Yields Provide Limited Protection Against Rising Rates
Cumulative Three-Year Return of a Constant-Duration Ten-Year Treasury Bond If Rates Follow FOMC’s Median Expected Increase
Sources: Federal Reserve and US Department of the Treasury.
Note: Yields are assumed to increase 300 bps linearly over the three-year period.
Today, investors should consider to what extent the protection Treasuries provide is worth the opportunity cost. Low yields translate to low returns, as the current yield to maturity is the primary driver of future bond performance for a buy and hold or constant maturity portfolio. Further, downside risk is elevated relative to the upside. Put simply, the insurance costs more (in terms of opportunity cost) and provides less protection with more downside risk. The partial exception is very long-duration bonds, such as the 30-year Treasury. The higher convexity of these bonds boosts duration enough at these low yields that the capital gain for a 50 bp or 100 bp decline in yields is effectively the same from today’s 2.9% yields as it was when yields were 5%. In other words, you get the same amount of insurance, but it is more expensive, and the room for yields to decline is far less than for yields to increase, so the asymmetric risk/return profile is sustained.
For institutions with defined benefit pension plans that are seeking to hedge liabilities, matching the duration to their liabilities is the best solution irrespective of bond yields. For further discussion, see Sona Menon and Greg Meila, “Avoid the Agg Drag,” Cambridge Associates Research Note, June 2014.
For these reasons, on and off since 2009, we have advised investors holding bonds as a deflation hedge to hold part of their allocation in cash when yields have been at or near very overvalued levels. We maintain this advice today. We would keep some sovereign bond exposure, given they retain some valuable diversification capacity, and would seek to increase exposures should yields increase to more fairly valued levels. For investors with large sovereign bond allocations that cannot accept the return drag of sovereign bonds and cash, we have recommended reducing such allocations to the minimum amount that would be needed in a stressed environment to meet spending and other liquidity needs. The remainder of the sovereign bond allocation can be put to work in diversifying hedge funds with relatively low equity and credit exposure. However, we would be careful not to increase the total portfolio equity and credit exposure today beyond neutral levels.
Bargain Hunt, but Keep Your Seatbelt Fastened
As investors downgrade growth prospects and remain as “data dependent” as the US Federal Reserve in determining their risk appetite, volatility is likely to remain elevated. We live in a highly global world where softening growth and tightening credit conditions in one place can have unintended, unexpected consequences elsewhere. The consensus view that a global recession is not imminent seems reasonable, but the possibility cannot be ruled out. This keeps us looking for bargains where they exist, but leaving the bar high in recognition that most assets are not cheap today, and what is cheap is generally cyclically oriented. We remain patient, and will look to build opportunistic positions on further weakness.
To take advantage of opportunities, investors need to maintain adequate liquidity and diversification. Now is the time to be certain that liquidity is sufficient to support future spending needs and capital calls, as well as rebalance. Buckle up. It might be a bumpy ride.
Footnotes