While there has been much debate around whether active managers can outperform passive indexes overall, a more relevant question is whether investors should pursue active management in public, long-only equities at all. Despite the challenges, we believe active management, especially in less efficient markets, can be worthwhile if investors: 1) employ a rigorous manager research process, 2) exercise patience, and 3) build well-diversified portfolios to reduce unintended risks. By following these principles, investors can improve their prospects of generating excess returns through active management.
The Median Manager Will Not Suffice
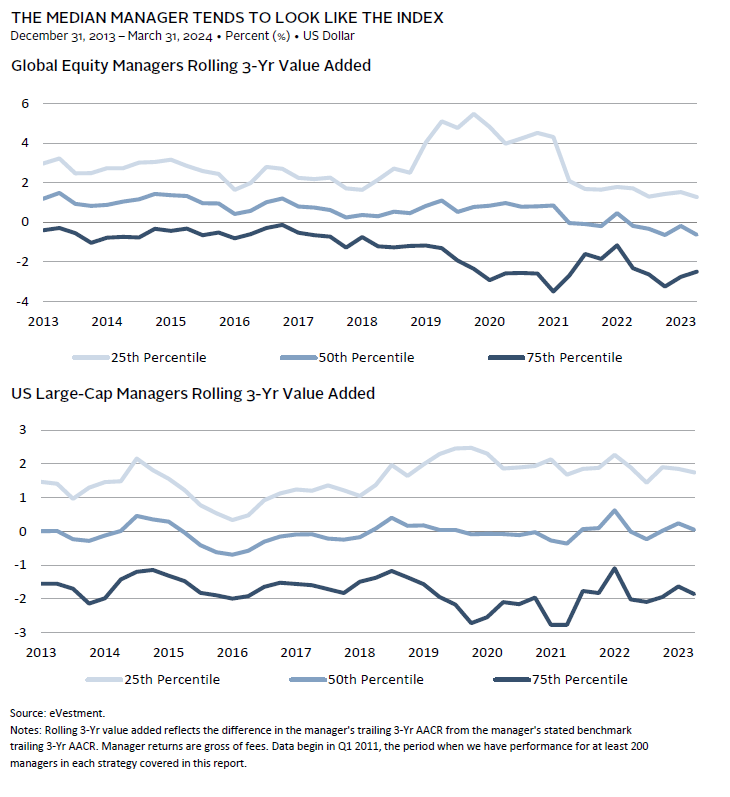
The median manager has delivered rather pedestrian returns in excess of its benchmark, but there are plenty of managers that have delivered meaningful excess returns over time. More specifically, since 2011,[1]We selected this starting point for our analysis to have an adequately large sample size of managers for all strategies evaluated. Emerging markets managers offered a particularly thin data set until … Continue reading the median global manager has delivered an average, gross of fee, rolling three-year excess return of 0.6% and the median US large-cap manager has fared even worse at -0.1%. Taxable investors require even higher returns to outperform the market net of fees and taxes as index funds tend to be more tax efficient than active managers. For such investors, we lean into tax-efficient managers that can also harvest losses and generate “tax alpha.” In short, to earn excess returns of 30 basis points (bps) to 40 bps net of fees requires finding managers well into the top half—closer to the 35th percentile for US large caps and 45th percentile for global equities.
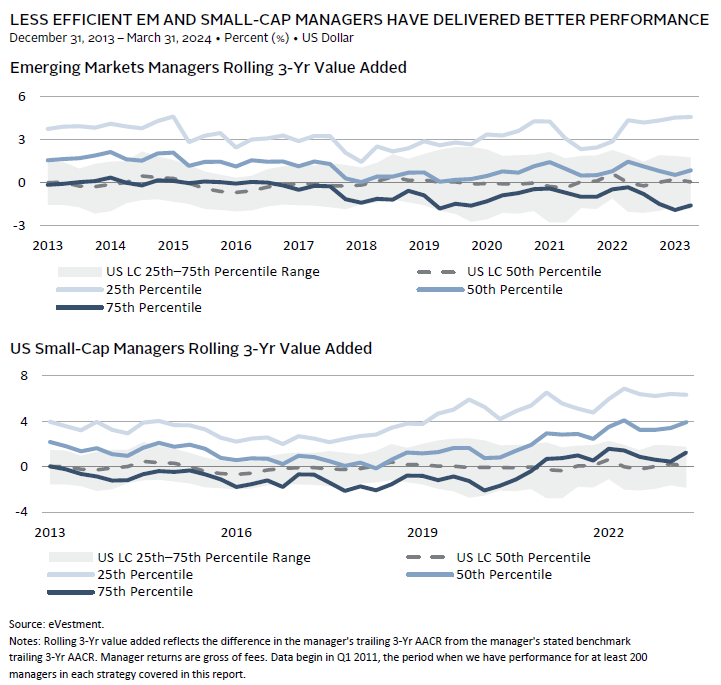
Managers trafficking in less efficient markets (whether that means less in the way of sell-side coverage, buy-side product offering, or tech-enhanced transparency), such as small caps and emerging markets, have fared better over time. The following data show that in contrast to more efficient US large-cap equity managers, the median manager in such strategies has offered value even after fees, with the average of rolling three-year, gross value–added returns of 1.4 percentage points (ppts) for US small-cap managers and 1.1 ppts for emerging markets managers.
Structural Challenges
Understanding the hurdles active managers face can help provide insights into ways to improve the odds of outperforming the market. Challenges include the tendency of even the best managers to experience meaningful periods of underperformance, index concentration, and shifting manager characteristics. More recently, investors have raised concerns that the rise of passive investing has made it more difficult for active managers to outperform, while we see passive’s ascent as more of a mixed blessing.
Even the Best Managers Underperform Periodically
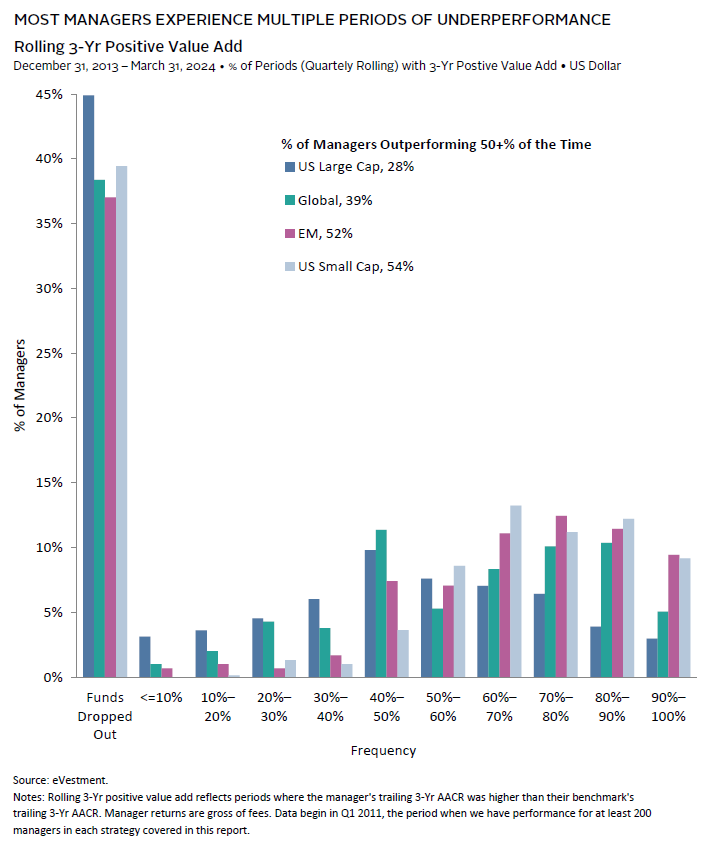
Identifying managers that can outperform the market is challenging because those that outperform during one period do not always repeat this feat. Indeed, most managers reporting performance at the start of 2011 either underperformed their benchmark during the majority of rolling three-year periods or stopped reporting, which typically happens due to liquidation, mergers, or poor performance.
See Celia Dallas and Kevin Ely, “CA Answers: Is the Environment for Active Management Improving?,” Cambridge Associates LLC, January 30, 2018.
Our 2018 study of active US equity managers from 1996 to 2016 found that only 27% of the 1,368 managers reporting performance in 1996 survived for the entire 20-year period. Of those 370 survivors, 85% outperformed the relevant style index. These 317 winners did not outperform over every short-term period. Most underperformed their relevant style index by a considerable margin from time to time, with 60% underperforming for three consecutive calendar years, and more than 90% underperforming in two consecutive calendar years at least once. The underperformance was often severe. On an annualized basis, 18% underperformed by 10 ppts or worse over three years and by more than 5 ppts per year over five years.
Positive Skew and Concentration Risk
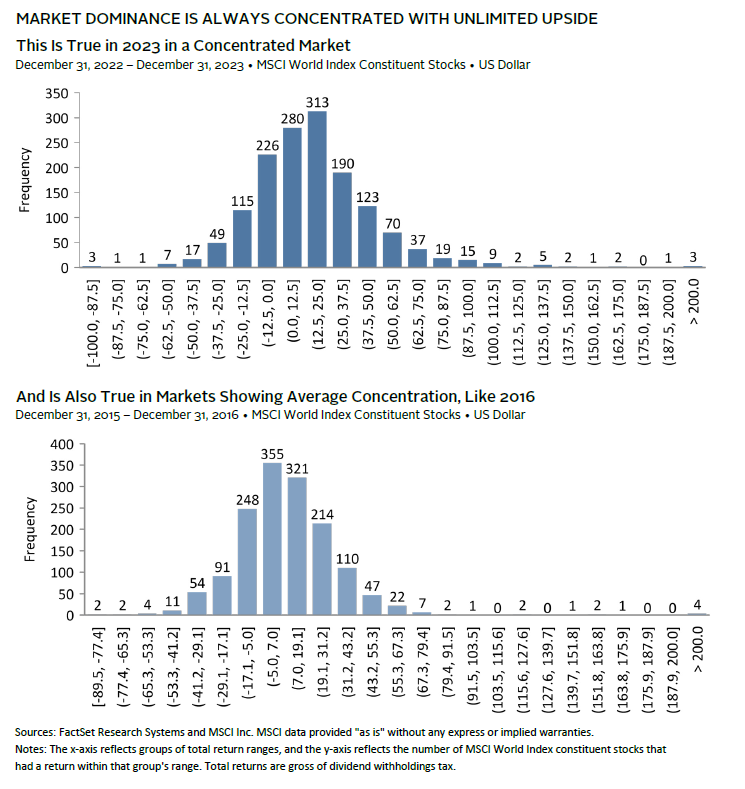
Positive skew is another challenge for active managers. Return distributions from long positions in equities tend to have long right tails (positive skew) because single-stock negative returns are capped at -100%, while positive returns can exceed +100%.
Positive skew impacts most long-only managers that hold more concentrated portfolios than the underlying benchmark. According to research by Ikenberry, Shockley, and Womack, without exceptional skill, the odds are incredibly low that an active manager investing in S&P 500 constituents will hold one of those stocks with extremely high returns. This drag from skew is lessened when funds hold more than 35 stocks but is still present even when a portfolio holds 150 stocks.[2]See David Ikenberry, Richard Shockley, and Kent Womack, “Why Active Fund Managers Often Underperform the S&P 500: The Impact of Size and Skewness,” The Journal of Wealth Management, January … Continue reading Historic performance data studied by Petajisto further underscores the challenge.[3]See Antti Petajisto, “Underperformance of Concentrated Stock Positions,” https://ssrn.com/abstract=4541122, June 30, 2023. His work revealed that the top quintile of stocks by performance in the US equity market over a five-year period subsequently underperformed the broad US equity market over the next ten years. This underperformance was consistent and meaningful. The median of prior stars underperformed in nearly 86% of monthly rolling periods since 1926 by a cumulative 17.8% over the decade, or nearly 2 ppts per year. It is difficult to strike the right balance between holding concentrated positions and capturing enough of the tail of positive returns.
Concentration of outperformers doesn’t pose a significant challenge to active managers when the best performers have low index weights, but when they are concentrated in the largest stocks—as they have been in recent years—the index is a particularly tough bogey to beat. For example, in 2023, the number of stocks outperforming the S&P 500 Index was unusually low (29% versus a median of 49%) and gains were highly concentrated in a handful of mega-cap stocks, with the top ten companies contributing 62% of the index’s return. Concentration in the top ten stocks for MSCI ACWI last year, however, stood at 42%, and the share of stocks outperforming fared slightly better at 34%. Over a longer-term period, the global index has a higher share of outperforming stocks with a median of 50%.
Shifting Manager Characteristics
For a more in-depth discussion see Kevin Ely, “Catch My Drift? Active Managers’ Style Tends to Change Over Time,” Cambridge Associates LLC, September 2021.
A key challenge in building portfolios of active managers is avoiding unintended bets as a byproduct of manager selection, given their underlying exposures tend to drift over time. Manager exposures shift across the capitalization and factor spectrum (e.g., value, quality, momentum) as well as geographic, economic sector, and currency exposures. The following figure shows how the average growth and value manager’s style characteristics tend to shift over time.[4]Style drift is a natural tendency for managers that appears to have more to do with changes in the opportunity set than intentional shifting of strategies. This is reflected in the apparent … Continue reading

The Rise of Passive—Is Passive Harder to Beat?
A key question for investors is if the increase in passive investing has changed active managers’ ability to outperform by altering market efficiency. To earn excess returns, skilled (or lucky) managers must outperform the market at the expense of those that underperform. Skilled active managers have an easier time outperforming in less efficient markets with a higher share of unskilled investors. Overall, markets are more efficient today due to the proliferation of lower cost access to uniform information through technological and regulatory developments. These developments have diminished managers’ ability to consistently secure an informational edge to make excess returns.
As index funds have become more prevalent, the share of ownership and trading by price-insensitive buyers has increased, providing potential for more inefficiencies. Buy/sell decisions are less driven by deep research on stock-specific fundamentals and more so by aggregate factor data that are increasingly traded as a portfolio. Their price insensitivity can amplify market moves, leading to price instability, and creating dislocations (market inefficiency). This is especially true when passive trades account for most of the volume on any given day. Further, the transition of funds from active to passive pushes relatively more capital into mega-cap index constituents. This happens as index funds receiving capital move to fully invest, replicating market-cap weighted indexes as quickly as possible. These funds buy and sell holdings as capital flows in, and they trade to match shifts in index constituents. Active managers, in contrast, tend to hold some cash and are more price sensitive, often taking their time to put capital to work, favoring more attractively priced stocks and holding more equal-weighted portfolios.
Over the last decade, growth in assets under management in passive strategies has been phenomenal, but the vast majority of global equity market cap continues to be actively managed. Among global mutual funds and ETFs, passive strategies now account for more than half of assets, yet such vehicles account for a minority of global equities as a whole. Chinco and Sammon[5]See Alex Chinco and Marco Sammon, “The Passive Ownership Share is Double What You Think It Is,” May 19, 2023 (last revised April 7, 2024). estimate that passive ownership of US equities is nearly 35% of total US equity market capitalization based on analysis of trading activity around index reconstitutions.[6]The authors acknowledge they may be underestimating passive investing, given their research focused on five index funds: S&P 500, S&P MidCap 400®, Russell 1000®, Russell 2000®, and Nasdaq … Continue reading In short, passive investing has accelerated, yet the majority of the market continues to be actively managed, driving price discovery.
The shifting market structure resulting from capital moving from active to passive management likely contributes to the outperformance of the largest stocks, increasing market concentration, and making it more difficult for active managers to outperform the market in the near term. However, active management remains dominant, and to the degree that the rise of passive accentuates crowding and concentration, it also opens up investment opportunities for skilled active managers. The rub is that it may take more time for the value to be realized.
How Can Investors Improve Outcomes?
Employ a Robust Research Process
Manager selection requires thoughtful consideration of qualitative and quantitative factors over a broad range of characteristics. Manager skill and the ability to survive through cycles appear to be the most important determinants of long-term success. Dedicated fund researchers should focus on these features as they are far more important than analyzing short-term performance. Indeed, the distribution of survivors and non-survivors in terms of percentage of years they outperformed their style index is quite similar. Therefore, assessing the competitive edge and the degree to which the investment process is repeatable are critical.
As the technology and regulatory environment have leveled the playing field for accessing corporate information, managers must work harder to gain an edge. Technology acumen (e.g., data scraping, satellites) can provide an advantage, but managers must continually invest to maintain their lead. Experience and judgment also go a long way to set managers apart. From an organizational perspective, we advise partnering with firms with good governance, alignment of principal and agent issues, strong firm culture, and a high caliber and well-diversified customer base. Securing fee structures that enable investors to retain most of the excess returns also increases the odds of earning excess returns over the long term.

Exercise Patience
Recognizing that even managers with terrific long-term records suffer from periods of underperformance and that the pattern of excess returns tends to be cyclical, it is important to take a patient approach with active managers, assuming that the initial and ongoing due diligence of the investment manager is sound. This in-depth work should encourage investors to stay the course and ultimately fight the behavioral tendency of firing after a period of poor performance. In our experience, one of the biggest mistakes investors make is firing good managers after near-term underperformance. Consider that the dollar-weighted returns of institutional shares of mutual funds are much lower—nearly 200 bps—than the time-weighted returns that the funds report. This is because investors, even institutional ones, tend to sell managers when they are at or near their lows and buy in after a run of good performance.
Construct Well-Balanced Portfolios
The ongoing drift in manager factor exposures creates portfolio construction challenges that can be as important as manager selection. A simplified case study will help illustrate the challenge. Consider a US equity portfolio benchmarked to the MSCI US Index and consisting of an equal-weighted allocation to two managers—a growth manager and a value manager. On initial inspection, it appears they are well balanced, meaning that their combined style exposure would mirror that of the MSCI US Index. Yet in 2021, the value manager drifted to growth as growth outperformed. Once 2022 brought rising interest rates that killed the growth rally, both the growth manager and the value manager underperformed the broad market even as the value-style benchmark outperformed. The result was 18.4 ppts of cumulative US equity underperformance for 2022 and 2023. While an extreme example, given the unusually sharp shift from growth outperformance to value outperformance over this period, this case study illustrates the challenge investors have in managing portfolio exposures and the requisite risk management.
Because of the value manager’s style drift, the portfolio included both an intentional bet on the manager’s skill relative to its value benchmark and an unintentional (and poorly timed) bet on growth relative to value. Based on index exposure, an equal-weighted growth and value portfolio matches the style exposure of the broad index as shown in the bottom panel below. The out- or underperformance of the styles relative to the broad market nearly offset each other perfectly. Yet, when using active manager implementation, potential for style drift opens the door to unintended factor bets.

Investors should study the return attribution of managers to evaluate if managers are skilled in factor rotation. If so, outsourcing factor positioning to such managers is appropriate. Otherwise, investors should maintain factor exposure consistent with the broad market (unless implementing tactical positions). To do so, investors must continuously monitor manager exposures. In the above example, reducing the growth manager allocation or adding to value exposure (active or passive) would have proved beneficial.
Another alternative is to focus on managers that seek balanced exposures relative to their index, adding value through stock selection in a more risk-controlled manner. Including 130/30 managers[7]While the term 130/30 is frequently used to describe such managers due to its popularity, the industry uses this term to refer to any long/short exposure that nets to 100%, such as 120/20 or 150/50. in the long-only public equity portfolio provides a means of including active managers with tight risk controls relative to their benchmarks. Such managers relax the constraint prohibiting shorting, while maintaining net equity exposure of 100%. This approach may help address the challenge of positive skew and concentration. First, these managers can hold more positions than the average long-only manager, increasing their odds of exposure to stocks that outperform. Second, such managers can take more meaningful underweights through shorting securities with tiny index weights that offer limited upside when excluded from long-only portfolios—as of year-end 2023, 86% of securities in the MSCI World Index had weights of less than 10 bps.
In sum, investors need to recognize that drift is a feature of active management requiring ongoing monitoring and management. Investors should find the best active managers that can add value relative to the market and incorporate them into an ensemble that provides a superior orchestral experience. Looking at how individual managers perform relative to the benchmark most closely representing their style is inadequate. It is critical to also consider how the combined set of managers perform relative to the broader market. Too many strings and not enough brass will create an imbalance that will disappoint audiences regardless of how superior the individual musicians are.
Conclusion
Building outperforming portfolios in long-only equities is hard work but worth the effort. Engaging in deep research to identify firms with a repeatable competitive edge and strong organization that can stand the test of time is far more relevant than analyzing short-term performance. Selecting the right managers is only the first step. Constructing portfolios requires careful consideration of manager and market dynamics to adjust for shifting factor exposures and avoid unintended bets for which investors are unlikely to be compensated.
Celia Dallas, Chief Investment Strategist
Sehr Dsani, Senior Investment Director, Capital Markets Research
Grayson Kirk, Graham Landrith, TJ Scavone, and Eric Thielscher also contributed to this publication.
Index Disclosures
MSCI All Country World Index (ACWI)
The MSCI ACWI captures large- and mid-cap representation across 23 developed markets (DM) and 24 emerging markets (EM) countries. With 2,947 constituents, the index covers approximately 85% of the global investable equity opportunity set. DM countries include: Australia, Austria, Belgium, Canada, Denmark, Finland, France, Germany, Hong Kong, Ireland, Israel, Italy, Japan, the Netherlands, New Zealand, Norway, Portugal, Singapore, Spain, Sweden, Switzerland, the United Kingdom, and the United States. EM countries include: Brazil, Chile, China, Colombia, Czech Republic, Egypt, Greece, Hungary, India, Indonesia, Korea, Kuwait, Malaysia, Mexico, Peru, the Philippines, Poland, Qatar, Saudi Arabia, South Africa, Taiwan, Thailand, Turkey, and the United Arab Emirates.
MSCI US Index
The MSCI US Index is designed to measure the performance of the large- and mid-cap segments of the US market. With 625 constituents, the index covers approximately 85% of the free float–adjusted market capitalization in the United States.
MSCI World Index
The MSCI World Index represents a free float–adjusted, market capitalization–weighted index that is designed to measure the equity market performance of developed markets. It includes 23 developed markets country indexes: Australia, Austria, Belgium, Canada, Denmark, Finland, France, Germany, Hong Kong, Ireland, Israel, Italy, Japan, the Netherlands, New Zealand, Norway, Portugal, Singapore, Spain, Sweden, Switzerland, the United Kingdom, and the United States.
MSCI World Growth Index
The MSCI World Growth Index captures large- and mid-cap securities exhibiting overall growth style characteristics across 23 developed markets countries. The growth investment style characteristics for index construction are defined using five variables: long-term forward EPS growth rate, short-term forward EPS growth rate, current internal growth rate and long-term historical EPS growth trend and long-term historical sales per share growth trend.
MSCI World Value Index
The MSCI World Value Index captures large- and mid-cap securities exhibiting overall value style characteristics across 23 developed markets countries. The value investment style characteristics for index construction are defined using three variables: book value-to-price, 12-month forward earnings to price and dividend yield.
Nasdaq 100® Index
The Nasdaq 100® Index is one of the world’s preeminent large-cap growth indexes. The companies in the Nasdaq 100® include 100+ of the largest domestic and international non-financial companies listed on the Nasdaq Stock Market® based on market capitalization.
Russell 1000® Index
The Russell 1000® Index measures the performance of the large-cap segment of the US equity universe. It is a subset of the Russell 3000® Index and includes approximately 1,000 of the largest securities based on a combination of their market cap and current index membership. The Russell 1000® represents approximately 93% of the Russell 3000® Index, as of the most recent reconstitution. The Russell 1000® Index is constructed to provide a comprehensive and unbiased barometer for the large-cap segment and is completely reconstituted annually to ensure new and growing equities are included.
Russell 1000® Growth Index
The Russell 1000® Growth Index measures the performance of the large-cap growth segment of the US equity universe. It includes those Russell 1000® companies with relatively higher price-to-book ratios, higher I/B/E/S forecast
medium-term (two year) growth and higher sales per share historical growth (five years). The Russell 1000® Growth Index is constructed to provide a comprehensive and unbiased barometer for the large-cap growth segment. The index is completely reconstituted annually to ensure new and growing equities are included and that the represented companies continue to reflect growth characteristics.
Russell 1000® Value Index
The Russell 1000® Value Index measures the performance of the large-cap value segment of the US equity universe. It includes those Russell 1000® companies with relatively lower price-to-book ratios, lower I/B/E/S forecast
medium-term (two year) growth and lower sales per share historical growth (five years). The Russell 1000® Value Index is constructed to provide a comprehensive and unbiased barometer for the large-cap value segment. The index is completely reconstituted annually to ensure new and growing equities are included and that the represented companies continue to reflect value characteristics.
Russell 2000® Index
The Russell 2000® Index measures the performance of the small-cap segment of the US equity universe. The Russell 2000® Index is a subset of the Russell 3000® Index representing approximately 7% of the total market capitalization of that index, as of the most recent reconstitution. It includes approximately 2,000 of the smallest securities based on a combination of their market cap and current index membership. The Russell 2000® is constructed to provide a comprehensive and unbiased small-cap barometer and is completely reconstituted annually to ensure larger stocks do not distort the performance and characteristics of the true small-cap opportunity set.
Russell 3000® Index
The Russell 3000® Index measures the performance of the largest 3,000 US companies representing approximately 96% of the investable US equity market, as of the most recent reconstitution. The Russell 3000® Index is constructed to provide a comprehensive, unbiased and stable barometer of the broad market and is completely reconstituted annually to ensure new and growing equities are included.
S&P 500 Index
The S&P 500 Index includes 500 leading companies and covers approximately 80% of available market capitalization.
S&P MidCap 400® Index
The S&P MidCap 400® Index provides investors with a benchmark for mid-sized companies. The index, which is distinct from the large-cap S&P 500®, is designed to measure the performance of 400 mid-sized companies, reflecting the distinctive risk and return characteristics of this market segment.
Footnotes