Advice in Brief
- Comparisons to 2007 are growing. A key distinction today is that policy rates in most developed economies remain near zero. With little inflationary pressure, this cycle could last another several years.
- This is neither a time to be ramping up nor pulling back risk taking. It is a time for diversification, modest tilts to what is relatively cheap, and protection against economic contraction—the primary tail risk as the credit cycle advances.
- Specific asset class advice:
- Maintain small overweights to emerging markets and European equities funded from US equities.
- Hedge currency exposure in European equities. This should prove defensive, particularly for US$-based investors, if market volatility resurfaces.
- Overweight high-quality US equities in place of US small-cap equities.
- Be highly selective in US and European private equity, which are now very overvalued. Focus commitments on growth equity and smaller funds in the sub $500 million enterprise value segment.
- Substitute a portion of deflation-hedging and inflation-sensitive mandates with cash, natural resources equities, and diversifying positions.
- Prepare to rotate back into longer-dated (e.g., ten-year) US Treasuries.
- Know what you own in diversifiers, like low-equity beta hedge funds. You may be taking more credit risk than you think.
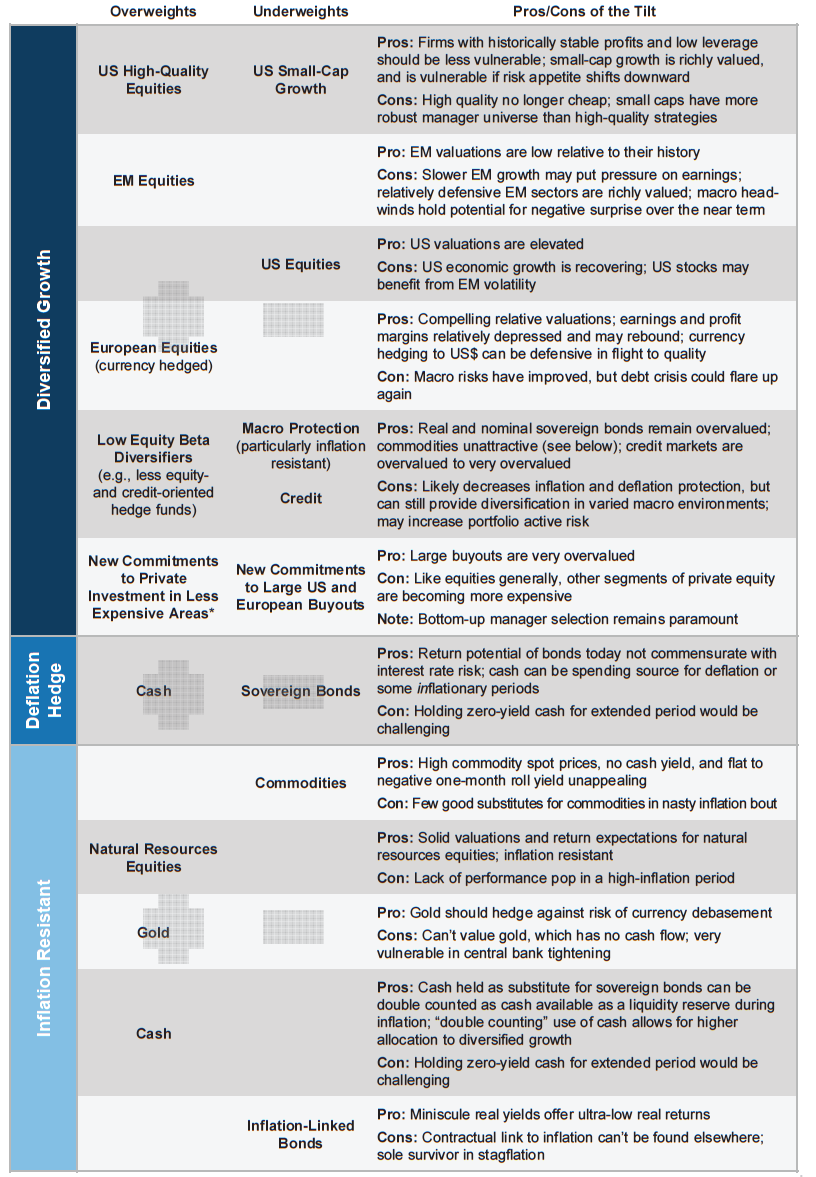
Portfolio Tilts from C|A’s Chief Investment Strategist
* For example, small market buyouts, growth equity, early stage venture, and Asian private equity.
“In central banks we trust.” When assets move from expensive to bubble territory, they do so on the back of an unshakable—and ultimately incorrect—belief that supports and inflates market values. In the 1990s, it was the faith that technology stocks were valuable even if they didn’t demonstrate a path to profitability, so long as they had clicks and eyeballs. In the 2000s, it was that real estate prices could never fall. Today, it is that central bankers will do whatever it takes to keep market prices stable. Belief in this ideal is so strong that volatility has remained low and risk asset prices buoyant in the face of a litany of potential spoilers—weakening earnings, geopolitical risk, and the ongoing threat of deflationary waves from China and the Eurozone. While markets are generally not in bubble territory, the potential is there, fueled by cheap credit and faith in central banks.
These conditions pose a challenge to investors. Cutting back on assets that have benefitted from this environment seems risky since current conditions could persist for years, longer than most investors could tolerate missing the party. Yet riding the wave up as markets escalate well past fair value is risky as well.
In the context of these challenging conditions, this quarter’s VantagePoint reviews the evolution of our advice since the start of the year. We now place a greater emphasis on diversification given the markets are at a more advanced stage of the economic and market cycle and risks are beginning to rise. We recommend sticking closely to policy/neutral allocations, tilting modestly to what is relatively cheap. Given much of what offers relative value today would likely underperform when the cycle turns down, now is the time to take stock of what you own to diversify and protect against the risk of deflation or economic contraction—the primary tail risk as the credit cycle advances. We would seek to increase exposure to longer-term US Treasuries, which most investors are presently underweight, and would beware of creeping credit exposure, particularly in mandates intended to be defensive.
What Rhymes with 2007?
Even as developed markets have been experiencing one of the slowest economic recoveries from the global financial crisis, developed markets equities have generated strong returns. In the United States, the equity rally has been one of the strongest and most extended on record, pushing prices firmly into overvalued territory. Compared to the 24 US equity market rallies of 20% or higher since 1926, the current rally of 193.5% has been the fourth strongest on record, where the average is 109.5%. Normalized price-earnings (P/E) multiples have increased from about 11 in early 2009 to 22.2, their highest level since year-end 2007. In short, equity valuations are back near 2007 peaks, credit spreads are tightening as credit standards are loosening, segments of the buyout market are very overvalued, investors appear complacent based on low implied and realized volatility across a wide range of markets, and all of this is transpiring on the back of synchronized loose monetary policy (Figure 1).
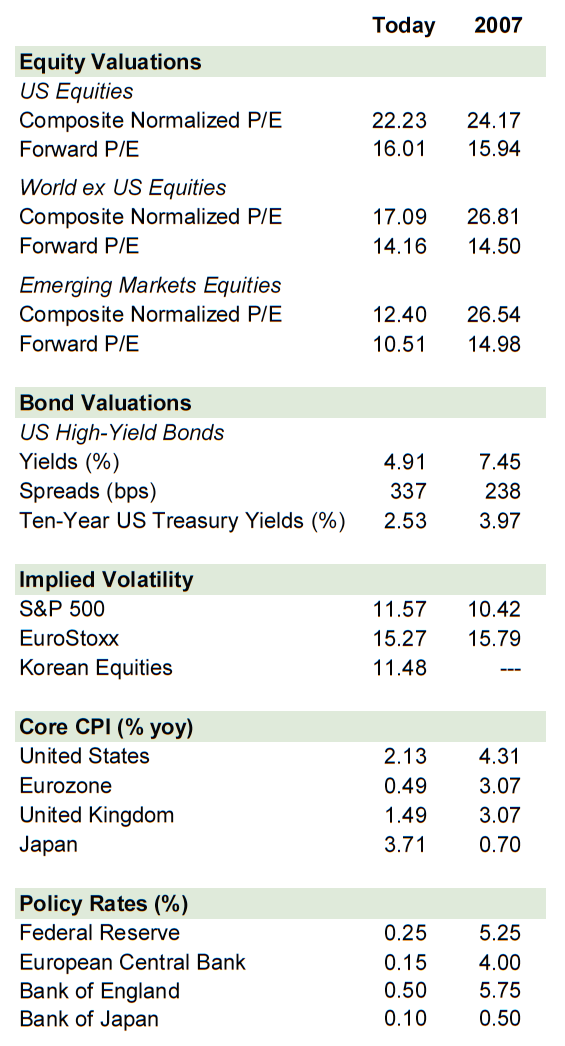
Figure 1. Then and Now
Sources: MSCI Inc. and Thomson Reuters Datastream. MSCI data provided “as is” without any express or implied warranties.
Notes: The composite normalized price-earnings is calculated by dividing the inflation-adjusted index price by the simple average of three normalized earnings metrics: ten-year average real earnings (i.e., Shiller earnings), trend-line earnings, and return on equity–adjusted earnings. Implied volatility and bond valuation data for 2007 represent the minimum month end value for the year, all other 2007 data represent maximum values. Data for Korean equities implied volatility begin on April 30, 2009. Data for 2014 are as of June 30, except core CPI data, which are as of May 31, 2014.
For a more complete discussion comparing the current environment to that of the last two market cycle peaks, please see Eric Winig et al., “Echoes of 2007?,” Cambridge Associates Research Note, July 2014.
However, there are several critical distinctions between then and now. Most notably, policy rates in major developed markets remain anchored near zero. The US Federal Reserve remains committed to its zero interest rate policy for now and the economic cycle at five years is not as advanced as it was in 2007. In contrast, by mid-2006 the Fed had already increased the Fed funds rate to over 5%, setting the wheels in motion for the subprime crisis.
How much longer will this continue? If history serves as a useful guide, as long as several years. Typical economic cycles last seven to ten years and recoveries from balance sheet recessions tend to last longer. The rare global varieties last the longest. If inflation remains muted, unemployment remains high, and wage growth remains contained, the Fed is likely to continue accommodative policies rather than risk prematurely raising rates and choking off what little growth there appears to be. To this point, the Fed has already moved the bogey for determining when to raise rates. Further, even if policy rates do rise in an orderly fashion amid moderate growth, low interest rates could be sustained as deflationary pressures from China, still-overleveraged developed markets, and aging populations could dampen inflation. Low inflation and interest rates are supportive of continued high (but not necessarily expanding) multiples.
Balancing Between Defense and Offense
For now, our view is to remain committed to neutral allocations to risky assets, seeking to manage price risk and take advantage of opportunities by leaning into what is relatively cheap and away from what is particularly expensive.
Within growth assets, the most expensive market, US equities, is also the most defensive, while the cheapest—emerging markets and European equities—are more vulnerable to underperformance when the cycle turns down. Therefore, we recommend keeping tilts to these cheaper assets relatively modest. Risks remain elevated in emerging markets and Europe given considerable challenges related to managing high levels of leverage in some countries, China slowdown risks, balance of payments pressures, and continued strains in the Eurozone amid sputtering growth.
US equities tend to outperform in down markets due to their perceived safe-haven status, particularly taking into account the US dollar’s countercyclical nature. The only global equity market declines of 10% or greater in which emerging markets equities outperformed US equities in US$ terms—and just barely—were the tech bust of 2000–03 and the Eurozone crisis–related drop in the spring/summer of 2010 (Figure 2). Given the locus of the tech bubble was in US equities and that US equities traded at much higher valuations than emerging markets equities, US equities should have been expected to underperform once the bubble popped. As for the latter case, it is difficult to know why emerging markets outperformed US equities as the Eurozone crisis heated up. Most likely, this reflected still-strong concerns about the durability of the US market recovery as it continued to suffer from some of the same excesses as the Eurozone and the economic recovery was still tentative.
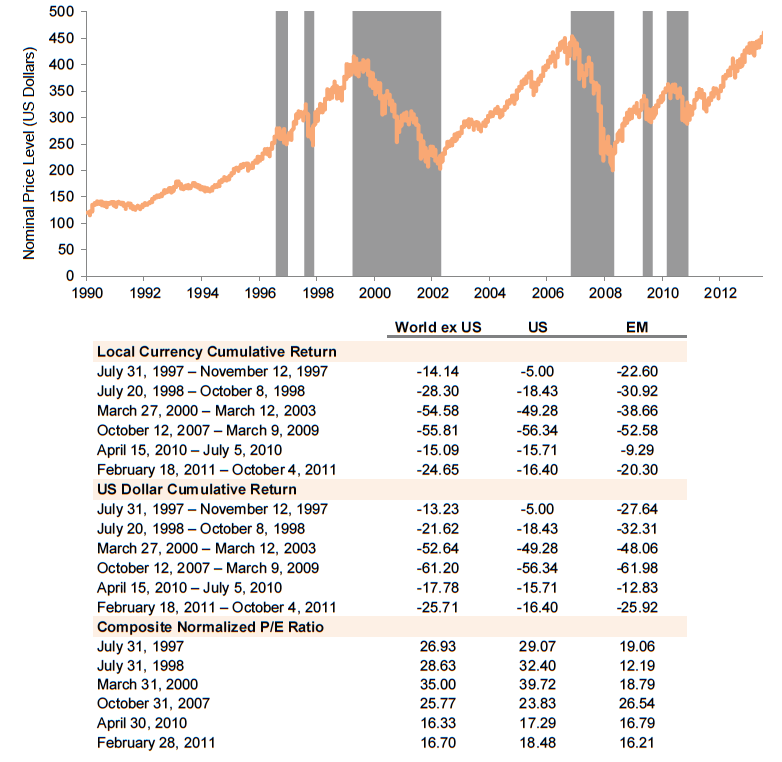
Figure 2. MSCI All Country World Bear Markets
December 31, 1990 – July 11, 2014
Sources: MSCI Inc. and Thomson Reuters Datastream. MSCI data provided “as is” without any express or implied warranties.
Notes: Bear markets (shaded) are based on peak-to-trough change in the MSCI All Country World Index in US dollars of at least 10%. All cumulative returns are based on price returns.
The late 1990s included two other cases in which US equities were much more expensive than those of emerging markets. However, in these cases, US equities outperformed, as excesses were centered in emerging markets—the start of the Asian financial crisis in 1997 and the Russian sovereign default in 1998. As would be expected, emerging markets equities suffered more severely as capital flowed out of emerging markets into the perceived safety of developed markets assets despite higher developed markets valuations.
What should investors expect today? While US equities are the most expensive equity market, conditions supporting US and global equity markets could continue for some time. However, this doesn’t mean US equities should be expected to continue their stellar performance. Indeed, after a 2013 return of 32% on a mere 1.5% increase in earnings per share, advances this year have been more tentative. Earnings could disappoint, particularly as earnings growth has moderated. A correction from such high valuations could be significant, with the market 37% above fair value levels.
If concerns over China’s growth or emerging markets balance of payments pressures reassert themselves, we expect US equities would outperform emerging markets equities. What stands out today is that markets have priced in quite a bit of negativity in emerging markets equities, well ahead of any major shock. Emerging markets equities trade at a P/E multiple of 12.4, not far above levels hit in the last two bottoms for these markets. Cheap valuations in emerging markets will provide some downside protection as China and other emerging markets adjust to slower growth amid higher leverage and, in many cases, greater dependence on foreign capital. Lower valuations will not prevent volatility, however, as investors would likely head for the exits in search of the safety of developed markets, with US assets the most likely beneficiary (Figure 3). If such an environment were to develop, we would seek to increase emerging markets overweight positions on meaningful weakness.
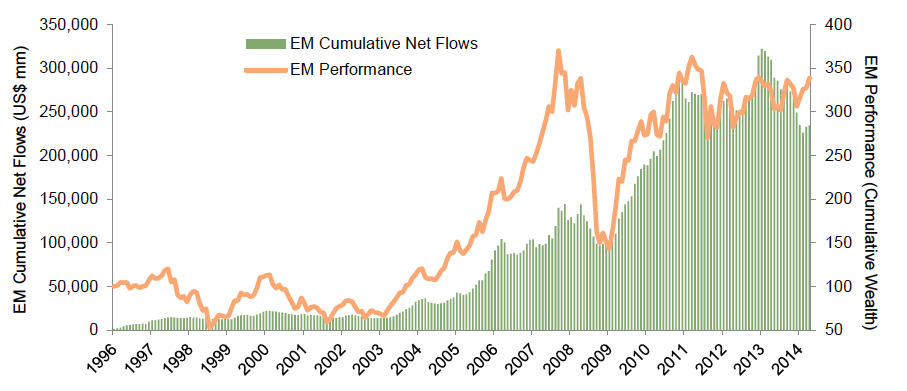
Figure 3. Emerging Markets Cumulative Net Asset Flows vs Cumulative Emerging Markets Performance
February 29, 1996 – June 30, 2014
Sources: EPFR, MSCI Inc., and Thomson Reuters Datastream. MSCI data provided “as is” without any express or implied warranties.
Notes: Data are monthly. EM cumulative net flows data are through May 31, 2014. Rebased to 100 at February 29, 1996.
As for Europe, we continue to watch for signs of a revival in earnings as the key for outperformance relative to US equities. At some point if earnings do not improve, expectations will dampen and the market will re-rate. Investors should hedge currency risk in this position. The euro has been supported by a number of factors this year including lower net exports (driven by lower imports), capital inflows attracted to higher-yielding local fixed income markets and strongly performing equity markets, demand for euros driven by the sale of foreign assets by Eurozone banks seeking to deleverage to meet regulatory requirements, and disinflationary forces that have boosted the value of the euro in real terms. As the central bank seeks to keep monetary policy as easy as it can, considering current practical and political constraints, and much of the lure of peripheral bonds has faded on lower yields, currency risks are tilted to the downside. The pound is also vulnerable, but for different reasons. Investors may reduce expectations for near-term tightening, as the Bank of England is unlikely to raise rates while credit growth in the United Kingdom is still contracting and inflation remains below target. Further, currency hedging for US$-based investors is particularly appealing as the US dollar continues to benefit relative to the euro and pound during risk-off markets given its relatively defensive characteristics.
Private investments have not been immune to the surfeit of capital moving out the risk spectrum in search of attractive returns. Valuations have become extended in a number of market segments, most notably US and European private equity, which we now regard as very overvalued. As a result, we would be highly selective in committing capital, favoring growth equity and smaller funds that operate in the sub $500 million enterprise value segment of the market and have an established approach to creating value. We would caution against scaling commitment sizes with manager fund sizes. Finally, we continue to see a steady flow of opportunities in private equity (venture capital, buyouts, and growth equity) directed to Asian markets.
Venture capital continues to be an interesting area for allocating illiquid commitments. However, the environment is mixed, with late-stage and expansion-stage US venture and late-stage Chinese venture capital overvalued, while early stage remains relatively attractive. Investors should exercise caution in the US late-stage sector where pre-money valuations far exceed the high levels of the late 1990s. We are finding opportunities across strategies including the long-underweighted biotech sector. Managers are putting capital to work at a faster pace than new capital has been committed for the last seven calendar years with still-reasonable prices for early stage deals. While some excess has trickled down to the early stage segment of the market, it has been limited thus far. It is unclear how long this balance will remain, as fund raising spiked in the first quarter while stress in the IPO market in the spring suggests enthusiasm should be checked.
Diversification Wanted
Our overweight recommendations are largely to markets more exposed to deflationary risks. In fact, from a global perspective, we judge deflationary pressures as much stronger than any signs of inflation outside of local inflationary pressures in countries like Brazil, Indonesia, and Turkey. As a result, we continue to recommend watching sovereign bond yields closely and preparing to re-allocate overweights in cash and low-equity-beta diversifying positions into longer-duration sovereigns as yields approach fair value. For US Treasuries, that time may be approaching. We now regard fair value for the ten-year Treasury at 3.5%, with 2.7% as the low end of our fair value range. While it may be tempting to wait until yields reach 3.0% before beginning to move back into sovereign bonds, yields might not reach that level this time around (at least before the cycle turns). The ten-year Treasury yield topped out at 3% in September and December of last year amid concerns that the Fed would tighten sooner.
Even as we regard sovereign bonds as overvalued, the US ten-year appears to have more value as quite a bit of tightening is already priced in (Figure 4). The difference between spot and forward rates at maturities of ten years and longer is small relative to the shorter end of the curve, suggesting that the risk of rising rates is lower at the longer end of the curve. If inflation remains muted in the near term, as we expect, such Treasuries would likely experience positive returns consistent with their yield to maturity.
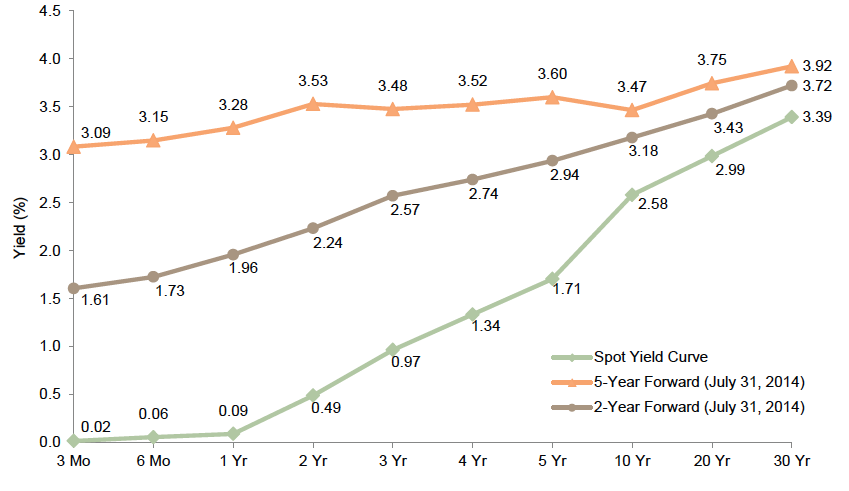
Figure 4. US Treasury Yield Curve: Spot, Two-, and Five-Year Forward
As of July 15, 2014
Source: Bloomberg L.P.
Furthermore, many of the characteristics that historically made long-duration bonds attractive still exist today. They provide excellent diversification characteristics in periods of falling real rates, as evidenced by the negative correlations to equities in recent years; they are highly liquid, which allows for rebalancing during periods of market turmoil; and implementation is cheap and easy. Even acknowledging the potential for lower returns than in the past, their remaining firepower is evident in 30-year US Treasury bonds, which would produce a total return of roughly 24% if yields were to fall 100 bps in a year from June 30 levels. Of course an increase in yield of 100 bps would hurt, but not as much, with a one-year total return of roughly -13%. Even the ten-year would experience a one-year total return of 11% if rates were to fall 100 bps. In contrast, core European sovereigns remain very overvalued and don’t offer much upside should yields fall from already ultra-low levels.
Inflation, less of a risk in the near term, is a significant risk to portfolios longer term. However, as assets most likely to provide some protection against inflation are somewhat expensive today, we recommend remaining underweight and would seek to build allocations back up to policy targets over time on weakness. More specifically, we maintain our recommendation to underweight commodities and inflation-linked bonds, in preference for natural resources equities, cash, a small amount of gold, and diversifiers that have low equity and credit betas. We no longer recommend overweighting leveraged loans relative to inflation-sensitive assets. We had been watching conditions in the leveraged loan market carefully, as credit risk is not a desirable characteristic in mandates intended to provide support to liquidity needs in the event of a surge in unexpected inflation. While we see no immediate catalyst for a decline in leveraged loans, prices have returned to 2007 levels and new issuance continues to escalate, suggesting markets are becoming less discriminating.
Know What You Own in Other Risk-Reducing Allocations
Since the global financial crisis, many investors have sought out hedge funds as a means of reducing equity exposure and increasing diversification. More recently, investors have looked toward hedge funds as an alternative way to diversify portfolios as sovereign bond yields have fallen at the same time that credit and equity valuations across the risk spectrum have risen.
Investors that choose to shift assets from sovereign bonds to hedge funds should think carefully about both the real-time impact on portfolio liquidity and the risk-reward characteristics of this change. For example, is it appropriate for a bond substitute to be a less liquid investment with meaningful equity risk, credit risk, leverage, carry trade exposure, and/or other more exotic active risks that almost certainly exhibit equity-like beta at an inopportune moment? Is the observed low beta a sign of different risk exposures or reduced risk-taking? Is the fund taking sufficient risk to produce a return that will provide the desired portfolio-level impact?
Even among low-equity-beta hedge funds, above-market returns are likely to come from familiar risk sources, perhaps even duration, and be magnified by leverage. Such characteristics should provide increased expected returns in some environments, but have historically suffered more than a traditional sovereign bond allocation in any growth or deflation scare, as credit spreads widen in concert with a decline in equity markets. We continue to exercise caution in credits given little expected reward at such skimpy yields and increasing risk at this stage in the cycle.
Among low-equity-beta hedge funds, many global macro managers build portfolios that allow them to offer daily or weekly liquidity, and therefore share an important characteristic with sovereign bonds. However, these managers are likely to have more dynamic exposures to market risks, so it can be more challenging to know what exposures you have at any point in time. For example, when considering factor risks, did the sale of sovereign bonds and the addition of a global macro hedge fund result in more expensive, more levered bond exposure?
Finally, leverage should be considered for its potential impact to a specific manager’s portfolio and to the investor’s overall portfolio. During a more severe market decline, leveraged managers may find themselves forced to sell positions at the very moment opportunities increase as LPs need liquidity and prime brokers seek to increase collateral requirements. Investor portfolios today are likely to include levered exposures via higher hedge fund allocations, inclusion of alternative risks in the traditional areas of the portfolio (e.g., risk parity, active extension or “140/40”, and absolute return bond funds), and overlay exposures to manage currency and cash.
The United States is now in the sixth year of an expansionary phase, a period of positive returns for risk assets and bonds of all types. Drivers of some low-beta hedge funds’ performance may not be as positive in the future, especially strategies like credits and event arbitrage that are highly correlated to equities. Some managers, particularly those with enough alpha, volatility, and defensive positioning, may provide outsized returns during periods of stress. However, it is important to understand what you own and how that has shifted the risks you are taking to earn portfolio returns.
Conclusion
Valuations are drifting upward, the credit market is getting extended, and many markets are looking stretched. However, we see no near-term catalyst to end the current cycle. In fact, the current cycle may very well end up at the long end of the seven- to ten-year typical range should inflationary pressures remain in check in the near term as we expect. In this environment, we recommend staying close to policy targets or neutral allocations to risk assets, tilting toward what is relatively cheap and away from what is relatively expensive within growth-oriented assets, and carefully reviewing the characteristics of assets intended to provide diversification, particularly in the event of economic contraction. Portfolios may include more credit risk than you think.
We may be wrong about the length of this cycle and markets could turn south sooner than we anticipate. If this is the case, having some real diversification, particularly in the event of unexpectedly strong deflationary pressures, would be welcome ballast to support liquidity needs.