Left unaddressed, the significant and increasing problem of pension underfunding could sink some municipal issuers in the next market downturn. Although investors in high tax brackets will likely continue to benefit from holding municipal bonds as a cornerstone in their portfolios, they should diversify across states and issuers that are better prepared to navigate any rough seas ahead.
- The Tax Cuts and Jobs Act (TCJA) contained a number of provisions with implications for muni investors, but changes to the tax code should not materially reduce munis’ after-tax appeal or lead to a deterioration in their credit quality.
- Aggregate US public pension underfunding has improved somewhat over the past two years, but a number of state and local governments will be hard pressed to fulfill their obligations in the next economic downturn. Muni bond investors should prepare for pension-related volatility by diversifying across municipalities and issuers and ensuring their managers are actively managing the portfolio’s credit exposure.
- Absolute valuations look reasonable, and although relative valuations look somewhat expensive versus their recent history, muni bonds’ tax advantage means they still have a role to play as ballast in the portfolios of investors in high tax brackets.
As 2018 comes to a close, the worries that have kept muni investors awake at night for the past two years, including the impact of tax changes, the looming threat of underfunded municipal pensions, and the outlook for issuance, have subsided somewhat in the near term, but are likely to continue to haunt investors down the road. In this note, we share our views on each of these concerns, review muni valuations, and discuss the prospects for future muni returns under a variety of hypothetical scenarios. In short, though they should be aware of the significant challenges that municipal issuers face, investors in high tax brackets would struggle to find a compelling alternative to municipal bonds.
A Choppy Voyage
Nearly two years have passed since the 2016 US presidential election, and the journey for muni bonds has been anything but smooth; the looming specter of tax reform and skyrocketing Treasury yields resulted in the worst quarter for muni bonds in more than two decades; the Bloomberg Barclays 10 (8-12) Year Municipal Bond Index fell 4.3% in fourth quarter 2016. The blowout in yields in the months following the election was similar in scale to that experienced at the start of the 2008–09 global financial crisis (GFC), during the default scare induced in December 2010 by analyst Meredith Whitney, and during the 2013 “Taper Tantrum” (unlike the muni crash surrounding the Lehman Brothers bankruptcy, the latter three instances saw munis suffer along with Treasuries) (Figure 1). Munis rebounded strongly in 2017, returning 5.8% for the year, only to decline 1.6% in first quarter 2018 (their first negative first quarter return since 2006) following the implementation of the TCJA. Since then, munis have recovered a portion of their losses year-to-date (returning -0.7%), and have outpaced ten-year US Treasuries by 384 basis points (bps) in 2018.
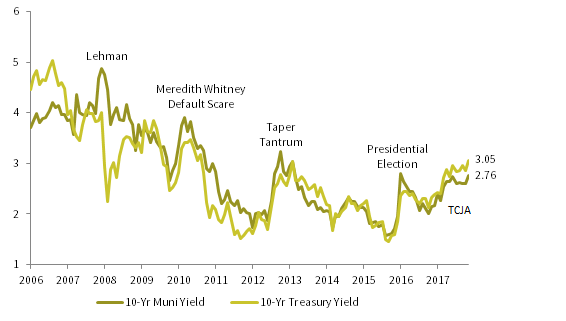
FIGURE 1 YIELDS FOR 10-YR MUNI BONDS AND TREASURIES
November 30, 2006 – September 30, 2018 • Yield (%)
Sources: Bloomberg Index Services Limited, Federal Reserve, and Thomson Reuters Datastream.
Notes: The ten-year municipal yield is based on the Bloomberg Barclays 10 (8-12) Year Municipal Bond Index. All data are monthly.
We evaluate relative valuations for municipal bonds by comparing their tax-advantaged yields to those of vastly more liquid Treasuries: muni yields are often, but certainly not always, below those of comparable-maturity Treasuries. At their post-election peak, ten-year muni/Treasury yield ratios reached 119% in early December 2016. Since then, the ten-year muni/Treasury ratio has compressed and muni yields have roughly tracked the path of Treasury yields for the better part of 2017 and 2018. That is, until recently, as Treasury yields have continued to edge higher as a result of strong economic growth, the return of volatility to equity markets, and restrictive monetary policy, while muni yields have leveled off as concerns over tax reform and infrastructure legislation have dissipated. Ten-year munis and ten-year Treasuries yielded 2.76% and 3.05%, respectively, at the end of September, and the ten-year muni/Treasury yield ratio (90%) looks somewhat expensive relative to its trailing ten-year average (107%).
While investors should recognize the elevated risks posed by underfunded pensions and changes to the tax code, a high-quality, core muni allocation should continue to provide competitive after-tax yield for investors in high tax brackets and be relatively defensive during periods of equity weakness. Though relative valuations versus Treasuries are somewhat rich, absolute valuations for muni bonds are reasonable. Given today’s starting yields (the Bloomberg Barclays 1-10 Year Municipal Bond Index yielded 2.4% at the end of third quarter) and the close linkage between starting yields and subsequent returns, intermediate-term muni bonds are very likely to generate a positive return over the next five years, even if yields increase significantly.
Tax Reform: Safely Navigating Potential Headwinds
As a major beneficiary of the tax code, muni bonds were viewed as particularly vulnerable to tax reform following the Republican Party’s sweeping victory in the November 2016 election. The TCJA, the final version of the Republican Party’s campaign promise to rewrite the tax code, was signed into law in late December 2017. The new tax legislation contained a number of provisions with implications for muni bonds, including a reduction in the personal and corporate income tax rates, the elimination of advance refundings, and a cap on state and local tax deductions. Overall, we view the TCJA as a mixed bag for muni bonds; the near-term impact on the supply/demand dynamics and credit quality of munis is relatively benign, and while it is possible the new tax legislation could lead to a decline in the medium- to long-term credit quality of certain issuers, we do not believe this will negatively impact the broad universe of muni bonds.
The TCJA kept munis’ tax exemption status intact, preserving their appeal versus taxable alternatives, but the reduction in personal and corporate income tax rates could limit the attractiveness of muni bonds for certain types of investors. On the one hand, the cut in the top marginal personal income tax rate from 39.6% to 37% is not likely to have a meaningful impact on individual demand for munis; although the majority of muni bond investors are concentrated in the top tax brackets, it would take a much larger cut in the top tax rate to dampen individuals’ appetite for muni bonds. The cut in the maximum marginal corporate income tax rate from 35% to 21%, on the other hand, could meaningfully reduce the attractiveness of muni bonds to corporations, especially for banks and for property and casualty insurers (in recent years, banks and insurers have held nearly 30% of all outstanding muni bonds). Figure 2 highlights how the after-tax advantage muni bonds held over similar corporate bonds has disappeared under the lower corporate income tax rate; given a maximum corporate income tax rate of 35%, the yield for A-rated ten-year muni bonds (2.93%) is greater than the after-tax yield for the A-rated corporate bonds (2.64%), but with a maximum tax rate of 21%, the after-tax yield for corporates (3.21%) is greater than for munis.[1]We use single-A issues as a proxy for “high quality” in our comparison of muni and corporate bonds because the size of the AA- and AAA-rated segments in the 8-12 year maturity range of the … Continue reading Banks and insurers still find muni bonds appealing for their diversification, low default rates and other criteria, but their appetite may be shrinking; banks trimmed their muni exposure by 5% during first half 2018.[2]Property and casualty insurers, as well as life insurers, have actually increased their holdings of muni bonds in the first half of 2018. This could mean that relative valuations will play a much more important role in determining the attractiveness of muni bonds for corporations going forward. In periods of heavy retail investor outflows, muni/Treasury ratios may need to widen further than they have historically to attract interest from opportunistic banks and insurers.
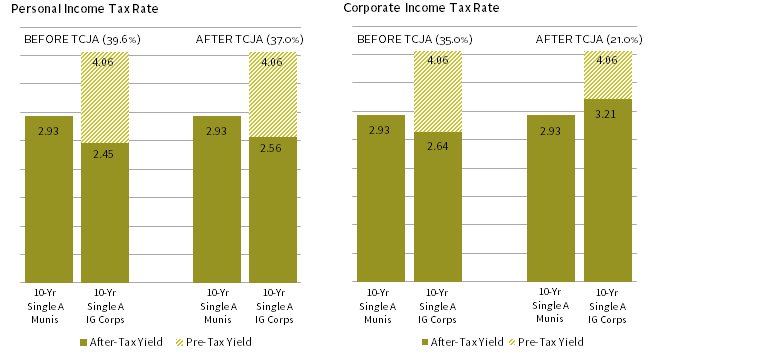
FIGURE 2 AFTER-TAX YIELDS OF COMPARABLE MUNI AND IG CORPORATE BONDS BEFORE AND AFTER TCJA
As of September 30, 2018 • Yield (%)
Source: Bloomberg Index Services Limited.
Notes: TCJA stands for the Tax Cuts and Jobs Act. To partially account for differences in quality and duration between municipal and corporate bond indexes, asset class yields are represented by the A-rated issues of the Bloomberg Barclays 10 (8-12) Year Municipal Bond Index and the 8-12 year maturity bonds in the Bloomberg Barclays US Corporate Investment Grade Index.
Given the cuts to the top personal and corporate income tax rates, it is important to keep in mind that the relationship between tax rates and relative muni yields has not always been consistent. In Figure 3, we compare ten-year muni/Treasury ratios to the prevailing top personal and corporate income tax rates. Munis appear to have suffered (versus Treasuries) from the Reagan tax cuts in the 1980s. The rise in the top individual brackets under President Clinton made municipal bonds more appealing, helping to suppress yields relative to Treasuries. But it is clear from the chart that tax rates are only one of many factors driving relative yields.
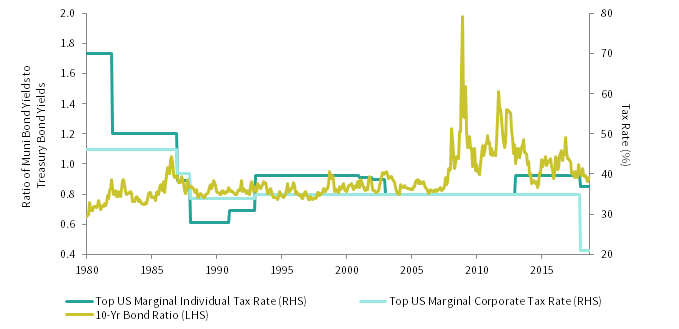
FIGURE 3 10-YR YIELD RATIOS FOR MUNI BONDS IN VARIOUS INCOME-TAX REGIMES
January 31, 1980 – September 30, 2018
Sources: Bloomberg Index Services Limited, Federal Reserve, Tax Foundation, Tax Policy Center, and Thomson Reuters Datastream.
Note: Data are monthly.
Additionally, any negative impact on muni bond demand due to tax cuts should be partially offset by two of the TCJA’s other provisions: the elimination of advance refundings (a frequently used technique by muni issuers designed to lower borrowing costs) and the $10,000 cap on state and local tax deductions. Advance refundings have accounted for roughly 20%–25% of muni issuance in recent years, and their termination has curtailed bond issuance on a gross basis so far in 2018. It will likely take some time for issuers to transition to alternative, possibly more expensive, instruments to replace the function of advance refundings (see below for more detail on additional limits on near-term muni bond supply). The $10,000 cap on state and local tax deductions may actually support muni bond demand in the near term; high-tax bracket taxable investors living in high-tax states may view muni bonds issued by those states as a more attractive tax savings tool now that their effective state and local tax rates have increased.
The larger issue for many muni investors, as well as state and local officials, is the impact of the cap on state and local tax deductions on government finances and muni credit conditions. In the near term, the TCJA is actually expected to boost state tax receipts, mostly due to provisions included in the new tax legislation that expand the tax base and a one-time bump from an increase in 2017 tax payments from filers looking to take advantage of additional deductions included in the 2017 tax code. The Census Bureau reports that aggregate state tax collections grew 8.0% year-over-year in first half 2018, (versus a post-GFC average first half growth rate of 4.9%). The unexpected increase in state tax receipts has helped replenish rainy day funds and has allowed for incremental contributions to underfunded pension plans. However, there is still fear that the increase in effective state and local tax rates could contribute to outmigration from high-tax states to low-tax states, putting undue stress on some state and local governments’ budgets, spending priorities, and underfunded pension liabilities in the future. The states most vulnerable to an increase in outmigration (including Connecticut, New Jersey, and New York) are already suffering from elevated outmigration, and some, if not all, of the following conditions: high-top state personal income tax rates, large average state and local tax deductions, an overdependence on high-tax individuals for tax revenues, and/or significantly underfunded pension liabilities.
While the cap on state and local tax deductions may eventually contribute to outmigration from high-tax states, we are not overly concerned about its effect on the credit quality of muni bonds. A vast body of literature exists on the causes of outmigration, and while tax rates have been found to be a contributor, they are just one of many determining factors, including employment opportunities, income growth differentials, and property values. So far, early attempts to quantify the effects of the cap on state and local tax deduction on outmigration have resulted in substantially different results. Any meaningful reduction in the tax base would likely take a number of years to manifest itself due to the considerable costs associated with changes in employment and lifestyle continuity. We believe the key concern for muni credit conditions continues to lie with state and local governments’ underfunded pension liabilities.
Pension Underfunding: The Real Danger Lurks Beneath the Surface
The headline-grabbing TCJA should not distract investors from the serious issue of underfunded pension liabilities, which remains the key credit risk for the broad universe of muni bonds. Although some individual issuers face credit problems stemming from falling property values, over-indebtedness, or policy decisions that further exacerbate unfavorable revenue trends already challenging some regional and standalone health care credits, our focus is on the more systemic credit risk that stems from pension underfunding. Strong pension asset returns—combined with improvements in plan contributions and positive pension reforms—have boosted public pension funding ratios for the time being, but not enough has been done to stave off the potential blow to munis’ credit quality from pension underfunding.
After reaching record levels in fiscal year 2016, Moody’s projects that aggregate unfunded state and local government pension liabilities fell by more than 6% in fiscal year 2017; they are penciling in a further 5% decrease in fiscal year 2018.[3]Moody’s analysis is based on a 56-plan sample, which represents roughly half of all US public pension plan’s total assets. As a result, average public pension funding ratios have increased from 47% in fiscal year 2016 to an estimated 53% in fiscal year 2018. Unfunded pension liabilities reported under Moody’s methodology, which uses a more conservative approach for valuing pension liabilities,[4]Moody’s uses the FTSE Pension Liability Index to value pension liabilities. The index represents the single discount rate that would produce the same present value as calculated by discounting a … Continue reading differ from unfunded liabilities reported by US public pension plans in official filings, which tend to rely on their assumed rate of return of pension assets to value pension liabilities.[5]According to a recent NASRA study, the median assumed rate of return of US public pension plans has steadily decreased from ~8% in fiscal year 2011 to ~7.5% in fiscal year 2017, moderately increasing … Continue reading The improvement in pension funding ratios over the past two years is mostly due to strong equity performance (under Moody’s methodology, rising interest rates have also contributed to better funded pension plans).[6]The FTSE Pension Liability Index reached 4.14% as of June 2018, up from 3.61% in June 2016. According to Moody’s, public pension assets returned 12% on average in fiscal year 2017 and an estimated 9% in fiscal year 2018 amid robust equity performance.[7]Average returns are based on Moody’s 56-plan sample, which has been a reliable indication of the average return for the entire universe of US public pension plans in the past. The commitment by some state and local governments to increase plan contributions and enact progressive pension reforms have also contributed to the recent reduction in pension funding gaps, though these steps have been less impactful than rising asset values.[8]For example, Dallas and Houston both passed bills to stabilize pension benefits and withdrawals, while even New Jersey (via state lottery proceeds) and Chicago successfully instituted near-term … Continue reading
The recent strong performance of pension assets has improved funding ratios, but aggregate state and local government pension liabilities remain near all-time highs, and pensions have become increasingly dependent on pension asset returns to close funding gaps. According to Barclays, public pensions have historically relied on earnings from pension assets for about 60% or more of the revenue used to close funding gaps, with employee and employer contributions having covered the remaining 40%. At the same time, the standard US public pension plan, in an effort to meet their return assumptions in a low interest rate environment, has relied heavily on risk assets, such as equities and alternatives, leaving them exposed to considerable downside risk in the next equity market correction. Moody’s estimates that even if pension assets meet their assumed rates of return, pension funding ratios will still see only modest improvements in fiscal year 2019, moving up 1 percentage point to 54%. But in a scenario where pension assets decline 10% (all else equal), Moody’s projects that unfunded pension liabilities would grow by 22% in fiscal year 2019, slashing funding ratios to 45%, just below their fiscal year 2016 low (Figure 4).
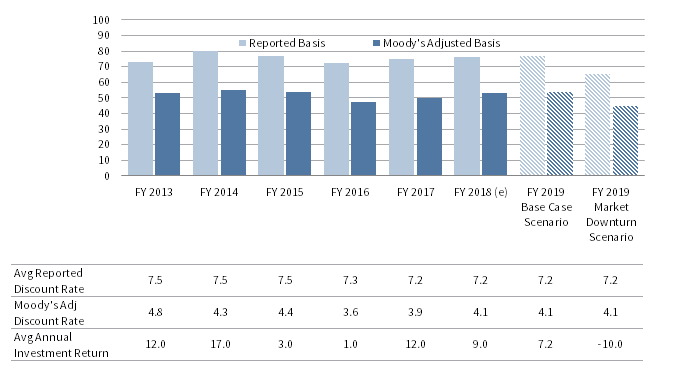
FIGURE 4 US PUBLIC PENSION FUNDING RATIO
Fiscal Year 2013 – Fiscal Year 2019 • Percent (%)
Source: Moody’s Investors Service.
Notes: Funding ratios are based on Moody’s 56-plan sample, which accounts for roughly half of total US public pension assets. Moody’s adjusted–basis funding ratios are calculated using the yield on the FTSE Pension Liability Index as the discount rate used to value pension liabilities. FY 2018 data are estimates. FY 2019 scenario forecasts hold discount rates constant and assume an average annual pension plan return of 7.2% (“Base Case Scenario”) and -10.0% (“Market Downturn Scenario”).
Such an event could represent a day of reckoning for state and local governments still facing significant funding issues (e.g., Chicago, Connecticut, Houston, Illinois, and New Jersey), even after the recent improvements in aggregate pension funding ratios. According to J.P. Morgan’s chief strategist Michael Cembalest, the combination of tax increases, spending cuts, increased plan contributions, and required rates of return needed to close pension funding gaps is already unrealistic for many of these municipalities.[9]See Michael Cembalest, “The ARC and the Covenants, 2.0: An Update on the Long-Term Credit Risk of US States,” J.P. Morgan, May 19, 2016. In the aftermath of an equity market correction, the burden placed on some of these governments’ budgets would reach a tipping point. The concern for muni investors is for bond holders and pension plan members possibly being stiffed in the event of a bankruptcy. In four recent bankruptcies,[10]This analysis looks at Vallejo, Stockton, and San Bernardino, California, and Detroit, Michigan. Please see Yvette Shields and Keeley Webster, “Why Pensions Beat Bonds in Bankruptcy Court,” The … Continue reading Moody’s estimates that bondholder recoveries averaged 44 cents on the dollar, while pensioner recoveries averaged 96 cents. To stave off the possibility of default, financially stressed state and local governments will likely need to make sustainable, progressive reforms, such as committing to fully funding actuarially required pension contributions, shifting to defined contribution plans with limited benefits, and/or instituting less generous benefit tiers.[11]The landmark Supreme Court decision on Janus v. AFSCME could give issuers the upper hand in future collective bargaining negotiations with unions, leading to a possible reduction in outsized benefits. Unfortunately, government representatives will likely face substantial plan member and constituent pushback, and it is a stretch to imagine they will have the political willpower or financial flexibility to materially reign in underfunded pension liabilities before it is too late, especially if an economic downturn simultaneously pressures tax revenues.
Investors are rightly concerned that impossible-to-fill pension commitments will be exacerbated in the next economic downturn, and could impact the credit ratings of general obligation bonds. Investors should employ active managers that can steer away from uncompensated pension risks, and should diversify across states, even though doing so may forgo a slight amount of after-tax yield for investors in high-tax jurisdictions.
Issuance: How Low Does the Trough Go?
Even before the TCJA was signed into law, sell-side forecasters were anticipating that a slowdown in issuance would help support muni bonds in 2018; rising interest rates and a sustained dip in new money issuance following the global financial crisis were expected to limit refunding activity. The TCJA exacerbated the decline in 2018 issuance beyond what was already expected, by bringing supply forward from 2018 into late 2017; an estimated $40 billion–$45 billion in anticipated 2018 issuance came to market in fourth quarter 2017, as muni issuers looked to take advantage of provisions included in the previous tax code that were eliminated in the TCJA (Figure 5).[12]As we mentioned above, the final version of the TCJA eliminated the use of advance refundings, which have represented roughly 20%–25% of muni issuance in recent years. Year-to-date, a precipitous decline in refunding issuance through September 2018 (down 51% versus the same period last year) has led to a 15% decline in total muni issuance ($249 billion).
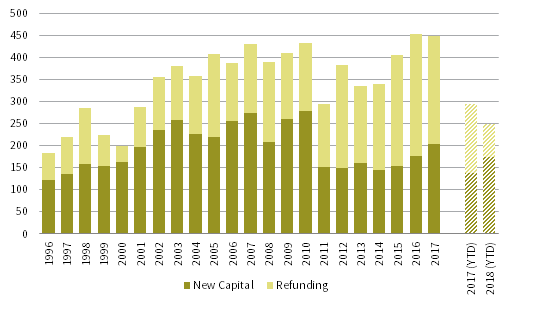
FIGURE 5 MUNI BOND NEW CAPITAL AND REFUNDING ISSUANCE
1996–2018 • US Dollar (billions)
Source: Securities Industry and Financial Markets Association.
Notes: “2017 (YTD)” and “2018 (YTD)” data are through September 30. All issuance data are based on deals with maturity of 13 months or greater.
An unexpected surge in issuance in late 2018, possibly due to federal infrastructure legislation, is unlikely. The White House has signaled on multiple occasions that infrastructure legislation likely won’t happen in 2018, which is not much of a surprise, given how deep we are into an election year and the Trump administration’s decision to prioritize tax and trade policy. Taking infrastructure legislation off the table, Barclays forecasts that total 2018 muni issuance will fall between $295 billion and $315 billion, a decline of 30%–34% from 2017 ($449 billion) and well below the average annual issuance over the last ten years ($389 billion). In the event that major infrastructure legislation is introduced, some investors worry that states and counties would issue large amounts of municipal bonds to fund part of the buildout, overwhelming investor demand and pushing up yields. But based on details of the plan released to date, Barclays foresees a very limited impact on muni supply as only a very small portion of the plan’s total appropriations are assigned to activities that would rely on an increase in muni issuance.
Valuations: Absolutely Shipshape, Relatively … Sprung Some Leaks
Absolute valuations for muni bonds are within reason. In our valuation of Treasury bonds, we look at the trailing ten-year average of nominal GDP growth to develop our fair value range. (In high-growth environments, bond yields tend to drift upward to compete with investments that will do well in those high-growth economies.) For muni bonds, we discount the Treasury fair value by the historical average ten-year muni/Treasury yield ratio (90%) to account for muni bonds’ tax advantages. By this metric, munis are solidly in fair value (Figure 6); the current yield of 2.76% for ten-year muni bonds is within our 2.5% to 3.3% fair value range.
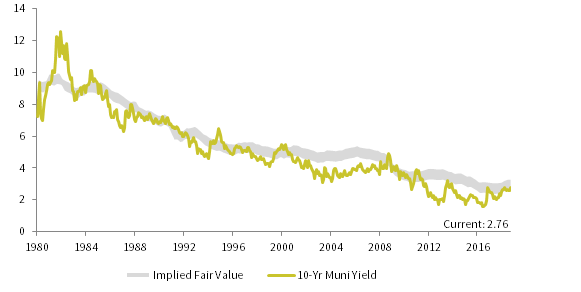
FIGURE 6 MUNI BOND VALUATIONS
January 31, 1980 – September 30, 2018 • Yield (%)
Sources: Bloomberg Index Services Limited, Federal Reserve, Thomson Reuters Datastream, and US Department of Commerce – Bureau of Economic Analysis.
Notes: Implied fair value is based on Bloomberg Barclays Municipal Bond Index yield history relative to the tax-adjusted rolling ten-year average US GDP growth. The ten-year municipal yield is based on the Bloomberg Barclays 10 (8-12) Year Municipal Bond Index.
As already discussed, for high-bracket taxable investors, the after-tax yields of muni bonds remain superior to those of taxable bonds of comparable quality. However, relative valuations for muni bonds versus Treasury bonds look somewhat expensive by certain measures; currently, the ten-year muni/Treasury ratio is 90%, which is in line with its post–1979 average (90%), but well below its average over the previous ten years (107%).[13]The five-year muni/Treasury ratio (82%) is well below its long-term (92%) and trailing ten-year (114%) average levels. There is a potential for munis to underperform Treasuries when starting relative valuations are elevated, especially in the event of a liquidity pinch.
Returns: Looking to the Horizon
When evaluating high-quality bonds (for which there is typically not a material impact from default losses), the starting yield is a solid estimate of subsequent long-term returns. In a falling-rate environment, like we have had for the past 35 years, muni returns have modestly outrun their starting yields in most periods. In a bond bear market, which we could very well be in today, the reverse would generally be true. But the return differences stemming from the level of ending yields are not as large as many investors might believe. Figure 7 illustrates our valuation-based scenario return projections under the return-to-normal framework for the Bloomberg Barclays 1-10 Year Municipal Bond Index over the next five years in a number of ending-yield assumptions that range from a -100 bps change to a +250 bps change. If yields are unchanged and end at 2.45%, nominal annualized total returns would likely come in around 3.0%,[14]Expected returns in this scenario exceed the level of yields, because the continual rolling of bonds to maintain a constant maturity generates price appreciation because of the slope of the yield … Continue reading and even if yields rose 250 bps to 4.95% (higher than their brief spike during the collapse of Lehman Brothers), estimated returns would still be positive at 1.8%. Based on these assumptions, yields would have to increase by more than 700 bps, putting them close to 10% (ten-year muni yields have not topped 10% since mid-1984), to push expected returns into negative territory for a five-year period.
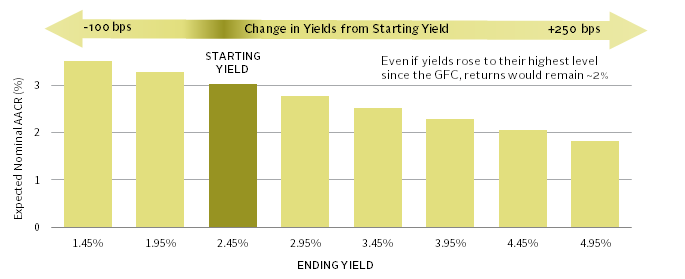
FIGURE 7 5-YR RETURN PROJECTIONS FOR MUNI BONDS AT VARIOUS ENDING YIELDS
As of September 30, 2018
Sources: Bloomberg Index Services Limited, Cambridge Associates, LLC, Federal Reserve, and Thomson Reuters Datastream.
Notes: Projections are based on the Bloomberg Barclays 1-10 Year Municipal Bond Index, which had a starting yield of 2.45% as of September 30, 2018, and an annual roll yield assumption of about 60 bps. Shifts in yield are based on a starting yield that subsequently approaches terminal yield on a linear basis over a period of five years. Projected total returns in the stable-yield scenario exceed the starting yield because of the roll-down effect: when the yield curve is positively sloped, yields decrease and prices increase as a bond’s maturity nears, and this boosts returns when the portfolio is managed to a constant maturity. The scenarios do not include an allowance for default losses; since the 1930s, well-diversified portfolios of high-quality municipal bonds have rarely experienced material default losses.
Conclusion
Taxable investors tend to gravitate toward municipal bonds for the ballast in their portfolios. Muni bonds generally exhibit low volatility, and after-tax returns are often unexciting but higher than those on offer from Treasury or investment-grade corporate bonds.
Of the two key concerns we discussed (TCJA and pensions), pension deficits pose a considerably more meaningful threat to muni bonds over the next five years. The recent improvements in aggregate pension funding gaps may mean that the potential fiscal strain felt by governments with excessive pension liabilities following the next economic downturn is not fully priced in. However, we believe municipal bonds remain investable today even amid the prospect of an eventual pension crunch. Investors should be prepared for pension-related volatility, should diversify across states and issuers, and should ensure that their managers are actively limiting uncompensated exposure to municipalities that have unsustainably high unfunded pension liabilities.
The issuance environment has been supportive of munis so far in 2018, but favorably lean supply dynamics may be hard pressed to offset any continued pullback in corporate demand. For now, market technicals do not represent a significant headwind, but they bear ongoing monitoring. Valuations today are reasonable in absolute terms, but are less attractive in relation to Treasury bonds. Given the tight muni/Treasury ratios, there is the potential that munis could underperform Treasuries in the near term. Still, only a few asset classes equal municipal bonds in terms of stability, and for high-tax bracket taxable investors, the TCJA does not change the fact that these asset classes generally cannot compete with the after-tax expected returns of muni bonds.
TJ Scavone, Associate Investment Director
Graham Landrith, Investment Associate
Footnotes