UK large-cap stocks are undervalued, but lack a clear near-term catalyst to unlock this value; mid-cap valuations are moving higher, but so too are earnings
- Valuations for UK equities in aggregate have been close to their historical averages for some time, masking a divergence between large-cap stocks, which are cheap but face a cloudy outlook, and mid-cap stocks, which are pricier but offer more favourable prospects.
- UK large-cap stocks have suffered from lacklustre profit growth, weighed down by energy and materials firms as well as financials. In contrast, mid caps have benefited from more attractive sector exposure, more gearing to the local UK economy, and higher index churn (more of the index is turned over each year to make room for rapidly growing firms).
- Vulnerabilities for UK large caps include commodity exposure, emerging markets growth, and the fate of the financial sector. Mid caps face questions over valuations and the strength of the domestic recovery, and UK equities in general are exposed to the health of the Eurozone economy, a key trading partner.
UK equities have trailed most global peers so far in 2015, extending a long-running trend. This underperformance masks a divergence across styles, however, as the significant commodity and emerging markets exposure of large caps has weighed on earnings and caused their returns to lag those of mid caps. By some measures UK large-cap stocks now trade at a substantial valuation discount both to global peers and to other UK segments, begging the question of whether they are poised for future outperformance. We are not entirely convinced, at least in the near term, as the likelihood of further earnings weakness suggests a lack of catalysts that would cause large caps to rerate higher. Mid-cap UK equities are a different story, as valuations do not look stretched relative to global peers, and earnings growth may continue to be healthy.
Recent Performance and Valuations
UK large-cap stocks (FTSE® 100) have returned 3.1% over the past 12 months, significantly trailing most global peers. In contrast, mid-cap UK equities (FTSE® 250) have fared much better, returning 17.1% and helping to pull up the return for the broad market FTSE® 350 Index to 5.2% (Figure 1). Over longer time periods the performance of large caps has been more impressive, at least compared to international peers; their 6.2% per annum return over the past decade matches that of the MSCI World ex UK Index. Still, their returns pale in comparison with other UK segments; UK large caps have generated barely half the annual return of mid caps over the past ten years.
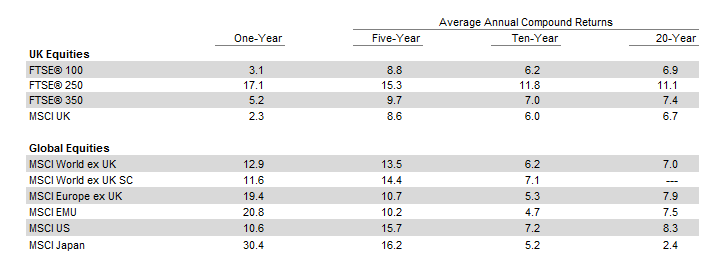
Figure 1. UK versus Global Equity Performance
As at 31 July 2015 • Local Currency
Sources: FTSE International Limited, MSCI Inc., and Thomson Reuters Datastream. MSCI data provided “as is” without any express or implied warranties.
Recent underperformance means that valuations for UK large-cap stocks are below historical averages (Figure 2). UK large-cap stocks trade at just 11.8 times normalised earnings, around 12% below their historical median, making them undervalued. In contrast, UK mid-cap stocks[1]The valuations work shown is for the MSCI UK Small Cap Index, which in terms of market cap, average size, and sector weights is comparable to the FTSE® 250 Index. trade at 19.2 times normalised earnings, in line with their historical median. Given that large-cap UK profits have struggled in recent years and are still well below highs seen prior to the global financial crisis (GFC), a slightly different picture of absolute and relative value emerges using short-term multiples. UK large-cap stocks trade at 15.9 times trailing 12-month earnings, around 10% above their historical median, still less than the 30% premium reflected in the 19.9 times multiple for mid caps.

Figure 2. Composite Normalised Price-Earnings (P/E) Ratios by Region
As at 31 July 2015
Sources: MSCI Inc. and Thomson Reuters Datastream. MSCI data provided “as is” without any express or implied warranties.
Notes: Data are based on composite normalised price-earnings (P/E) ratios except MSCI World ex UK Small Cap, which is based on the return on equity (ROE)–adjusted P/E ratio. The composite normalised P/E ratio is calculated by dividing the inflation-adjusted index price by the simple average of three normalized earnings metrics: ten-year average real earnings (i.e., Shiller earnings), trend-line earnings, and ROE-adjusted earnings. Valuations for UK mid caps are represented by the MSCI UK Small Cap Index. Valuations for UK large caps are represented by the MSCI UK Large Cap Index
Normalised valuations of UK large-cap stocks have cheapened relative both to domestic mid caps and to global peers. UK large caps historically have traded at around a 20% discount relative to UK mid caps, though during the GFC they actually traded at a small premium. This valuation discount has steadily widened over the past three years and now stands at 40% (Figure 3). Similarly, relative to global peers, UK large caps typically offered a 27% discount, but this now also has increased to 40%. As a whole, UK equities[2]As reflected in the MSCI UK Index. are trading at a 35% discount to global peers on a normalised basis, compared to a historical median 20% discount. They appear even cheaper relative to overvalued US equities; the 44% discount as of 31 July is wider than 98% of other observations in our data set, which goes back to 1969.
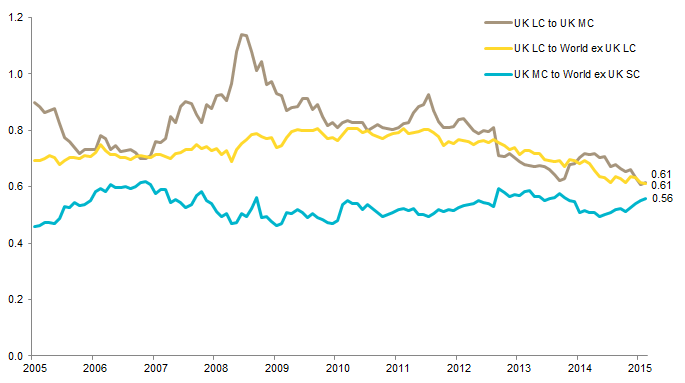
Figure 3. Relative Composite Normalised Price-Earnings (P/E) Ratios
As at 31 June 2015
Sources: MSCI Inc. and Thomson Reuters Datastream. MSCI data provided “as is” without any express or implied warranties.
Notes: Data are based on composite normalised P/E ratios except MSCI World ex UK Small Cap, which is based on the ROE-adjusted P/E ratio. The composite normalised P/E ratio is calculated by dividing the inflation-adjusted index price by the simple average of three normalized earnings metrics: ten-year average real earnings (i.e. Shiller earnings), trend-line earnings, and ROE-adjusted earnings. Valuations for UK mid caps represented by the MSCI UK Small Cap Index and UK large caps, MSCI UK Large Cap Index.
Normalised metrics are typically more useful than short-term equivalents in predicting intermediate-term return potential, as short-term metrics tend to be more volatile and prone to distortion by one-off or nonrecurring events. However, the usefulness of normalised earnings for a concentrated index like the FTSE® 100 is diluted by index profits that are heavily impacted by a handful of mega-cap names and their sectors. The top 20 companies in the FTSE® 100 account for almost 60% of market capitalisation, more than double the equivalent share for the top S&P 500 firms (and three times the equivalent share for the FTSE® 250). Thus, assessing whether large-cap earnings will return to their historical trend requires a close look at prospects for key individual firms and sectors.
Divergent Earnings Trends
A quick glance at earnings data from the past decade tells much of the story behind the underperformance of large-cap UK stocks (Figure 4). During the past decade, large-cap earnings have expanded around 1% per annum, below global peers and at just one-tenth the pace for domestic mid caps. Most of this underperformance has come during the past three years—large-cap earnings were actually outperforming even mid caps in 2011.
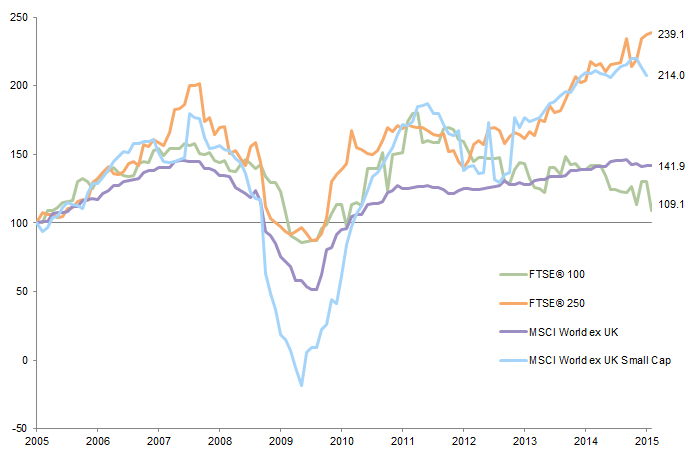
Figure 4. Comparing EPS Growth Across Regions
30 June 2005 – 31 July 2015 • EPS for each region rebased to 100 at 30 June 2005
Sources: FTSE International Limited, MSCI Inc., and Thomson Reuters Datastream. MSCI data provided “as is” without any express or implied warranties.
Lacklustre large-cap profit growth can be explained by several factors, with sector exposure playing a key role (Figure 5). While they have shrunk in recent years due to underperformance, the FTSE® 100 Index’s weights for energy stocks (13%) and materials firms (6%) remain larger than those seen in peer indices. The collapse in commodity prices has severely depressed earnings for these sectors, and certain company-specific issues have also come into play. BP’s 2010 Gulf of Mexico oil spill is one example, and many mining firms have suffered large writedowns after overestimating the pace of Chinese demand growth. The scale of the earnings carnage is hard to understate. The energy sector generated almost a third of FTSE® 100 profits in 2007[3]Slightly less if you include Vodafone in the 2007 total; we have excluded it from our analysis in both years given that in 2014 Vodafone booked a large gain from the sale of its joint venture in … Continue reading; by 2014 its contribution had fallen by roughly a third (Figure 6). The composition of these sector baskets has also been a factor. Global mining giants and many emerging markets companies dominate the FTSE® 100 materials sector, while the smaller FTSE® 250 materials sector basket features other subsectors like industrial goods and services firms, as well as chemicals.
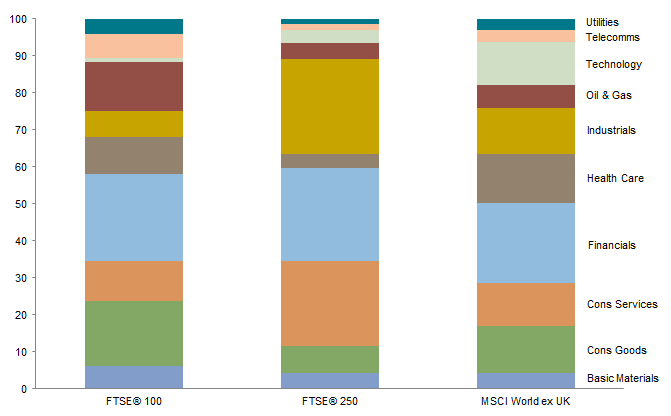
Figure 5. Sector Exposure
As at 31 July 2015 • Percent (%)
Sources: FactSet Research Systems, FTSE International Limited, and MSCI Inc. MSCI data provided “as is” without any express or implied warranties.
Note: Sectors grouped by ICB Multi-Source: ICB Industry codes.
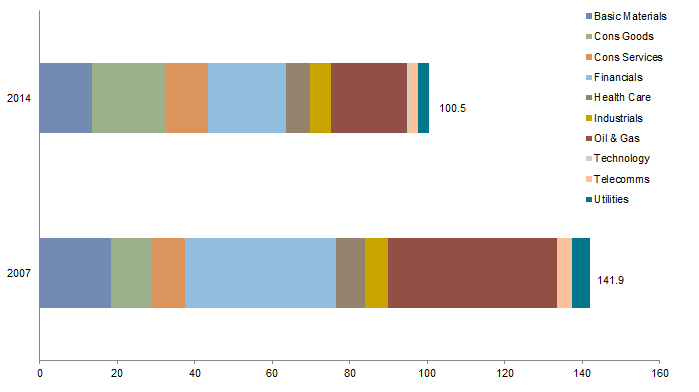
Figure 6. FTSE® 100 Index Net Income by Sector: 2007 versus 2014
Local Currency (billions)
Sources: Bloomberg L.P. and FTSE International Limited.
Notes: Sectors grouped by ICB Multi-Source: ICB Industry codes. Vodafone was excluded. Data are for each company’s 2007 and 2014 fiscal year.
Compositional factors are especially relevant when looking at the financial sector, the largest overall sector in both indices (23% for the FTSE® 100 versus 25% for the FTSE® 250). More than 50% of FTSE® 100 financials exposure (around 10 points of the total index) comes from large banks such as Barclays, HSBC, Lloyds Bank, and Royal Bank of Scotland (RBS); the FTSE® 250 weighting for banks is less than 1%. Many of the large UK banks have reined in international operations, reduced investment banking and trading activities, and trimmed balance sheets in recent years given the fallout from the GFC. While domestic banks had a combined balance sheet of over £6 trillion in 2009, recently this has shrunk to under £5 trillion, based on data from the European Central Bank (ECB). A combination of smaller balance sheets, higher capital requirements, and increased regulatory scrutiny has led to lower banking profits. This is especially true on a per-share basis, as many of the large institutions massively diluted existing shareholders during the GFC; for example, the share count for RBS has increased by a factor of ten since 2007.
FTSE® 100 financials, including the banks just listed but also insurance companies such as Prudential and Standard Life, are also different in that they rely heavily on international markets for revenue growth. Foreign operations once helped drive earnings but are now creating headwinds for many institutions, especially those focused on emerging markets. Currency depreciation has lowered the value of offshore earnings, and slower offshore economic growth, especially in emerging markets, curbs revenue growth and raises risks from weaker loan performance. FTSE® 250 financials are far more exposed to the domestic economy through listings of real estate firms and REITs, as well as to growth in capital markets through brokers and asset managers.
These sector comparisons hint at a broader truth about mid-cap companies—they are far more geared to the health of the local UK economy than large-cap peers. According to data from Goldman Sachs, FTSE® 250 firms earn around 48% of their revenue in their home market, more than double the 22% for the FTSE® 100. For context, this domestic exposure is high for a European index but actually lower than in the United States, where the small-cap Russell 2000® Index earns around 80% of its revenue domestically versus around 70% for the large-cap Russell 1000®, based on data from J.P. Morgan. This domestic exposure has impacted earnings trends between mid and large caps in two main ways: (1) the UK economy is growing at a faster pace than many peers, benefiting firms with domestic exposure and (2) sterling’s strength against emerging markets currencies has had a disproportionate impact on the value of foreign revenues for FTSE® 100 firms given their higher exposure to those markets.
However, we don’t want to exaggerate the detrimental impact of greater global revenue exposures for FTSE® 100 firms. FTSE® 100 consumer staples companies like Unilever and Diageo continue to generate healthy levels of EPS growth despite slowing overseas markets. Of course, FTSE® 250 consumer firms have also fared well, as their leverage to the health of the domestic economy has meant success for sectors such as food retailers, restaurant groups, and home builders.
While typically not a source of much focus for “bottom up” stock pickers, the concept of index churn also helps explain the superior earnings growth for the mid-cap index. Around 14% of the names in the FTSE® 250 have turned over each year (on average) during the last decade, representing roughly 11% of market cap. This represents roughly six times the amount of the large-cap index that was replaced (Figure 7). Put another way, a much larger percentage of the FTSE® 250 is “weaned” each year to make room for more rapidly growing firms, while the FTSE® 100 has not experienced the same degree of “creative destruction.”
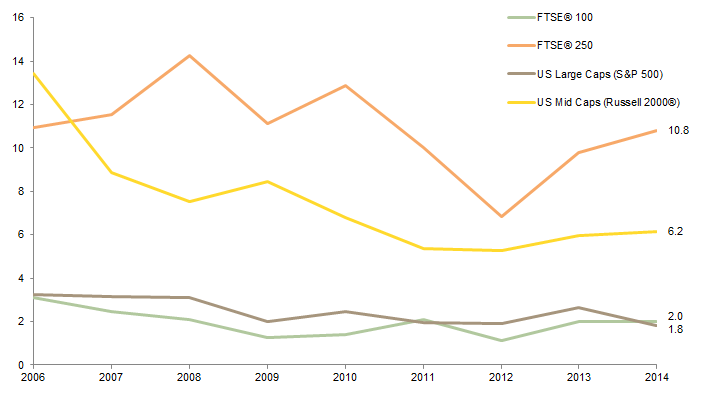
Figure 7. Index Turnover
2006–2014 • Percent (%)
Sources: FactSet Research Systems, Frank Russell Company, FTSE International Limited, and Standard & Poor’s.
Note: Index turnover represents the combined market value of companies added to the index annuallly as a percentage of the total market value in the index.
Outlook for Returns
Future returns for UK equities will be driven by three main factors: earnings growth, changes in valuations, and the dividend yield.
Potential for Earnings Growth. Earnings for large-cap UK companies are expected to sharply contract in 2015 (Figure 8) given the large drag from commodity-related sectors. A sharp rebound is then expected for 2016 as earnings growth for energy and materials firms is flattered by this low base. In contrast, other developed markets like Japan and the Eurozone are expected to see far more robust earnings growth in 2015, and the United States should at least see a small gain. UK mid-cap companies are expected to post a modest decline in earnings this year and generate similar growth as large caps in 2016 despite their relatively higher base. This continues to reflect the ongoing strength of the domestic UK economy and its positive impact on operating leverage for sectors like consumer discretionary and industrials.

Figure 8. Earnings Growth Expectations
As at 31 July 2015 • Percent (%)
Sources: FactSet Research Systems, FTSE International Limited, and J.P. Morgan Securities, Inc.
Looking further out, whether certain large-cap companies and sectors can return to pre-GFC levels of profitability is uncertain. Energy sector profits would clearly be boosted by a recovery in crude prices, but the timeline is key. Large UK energy companies have spent nearly $300 billion on capital expenditure since 2010,[4]Based on data from company reports and Bloomberg L.P. motivated by the high oil price environment that prevailed in recent years. Brent crude averaged over $100 per barrel between 2011 and 2014, but has fallen below $50 in recent weeks. The longer the path to oil price recovery, the greater the time before these projects bear fruit and the higher the chance of a writedown. Cost cuts that have recently been pushed through, which generally speaking have surprised analysts to the upside, will offset this. Still, further challenging the idea of “normalised” (in other words a return to 2011 to 2013) profits for the sector are asset sales, which will eat into future profits. For example, BP had already sold more than $40 billion of assets through the end of last year to fund settlements related to the Gulf spill and intends to divest another $10 billion of asset in 2015.
Similar arguments can be made about the materials sector. Chinese commodity demand may recover from currently depressed levels, but the country’s growth appears to be on a lower trajectory, and many mining firms have been left with excess capacity. When the sector will eventually recover is a subject of intense debate, but recent projects are already starting to be written down given excess capacity. Competition from other global firms is also an issue for the mining sector; for state-owned or state-controlled firms, profit maximisation may play second fiddle to goals such as elevated employment.
The fate of the financial sector will also be important. As stated earlier, smaller balance sheets, increased capital bases, and greater regulatory scrutiny will mean that some banks struggle to reach pre-GFC profit levels. Large UK banks are retrenching and rethinking their geographic and product ambitions. Barclays exemplifies these trends—the bank reported net income of over £4.4 billion in 2007 and the consensus expects full-year 2015 profits to come in at just over £2.5 billion. Some banks have likely put the worst of their GFC-related writedowns behind them, and the outlook for other segments like insurance and asset management seems far more favourable. The outlook for mid-cap financials is more difficult to generalise about, but fee income for asset managers (of which the mid-cap index includes a number) could in general prove less volatile and the business less capital intensive than retail or commercial banking.
Valuation Rerating. Multiple expansion could boost returns in the years ahead, but this is not our base case for several reasons. Large-cap stocks have elevated short-term valuations that seem unlikely to rerate higher in the absence of stronger earnings growth. Similarly, above average valuations for mid-cap stocks also leave less room to expand, though put another way multiple contraction also seems unlikely as long as earnings continue to impress. Higher interest rates are also typically associated with lower multiples, though when the Bank of England will finally hike rates is open to debate and in any case will be coming off a historically low base.
Dividend Yields. Current dividends for large-cap and mid-cap stocks are likely to support returns, with a few caveats. The 3.6% dividend yield for the FTSE® 100 is high by international standards and has generated the majority of the index’s return the past decade. However, around one-third of this dividend yield is provided by energy and materials firms and could be at risk given lower levels of profitability and negative free cash flow for some companies. This said, some energy companies are choosing to issue shares to finance their dividends (so-called scrip dividends), which serves the additional purpose of boosting capital bases (though is dilutive). The current 2.4% yield for the FTSE® 250 looks more sustainable given relatively low balance sheet leverage and a higher coverage ratio; in fact FTSE® 250 companies increased dividends by around 25% during the second quarter according to Capita.
Macro Backdrop and Exposures
Higher exposure to the domestic economy has recently been a boon to mid-cap stocks. On several key metrics, UK economic conditions have been more favourable than those in many developed (and more recently emerging) peers. Real GDP in the UK expanded at a 3.0% pace in 2014, nearly double the rate of developed nation peers, and is expected to advance another 2.5% in 2015 (Figure 9). Faster economic growth has been accompanied by healthy job creation; the unemployment rate has fallen to just 5.6% and is expected to decline further over the next 12 months. Finally, inflation is rebounding after a temporary deflation scare that coincided with lower energy prices; a modest increase in consumer prices should also be seen in 2015.
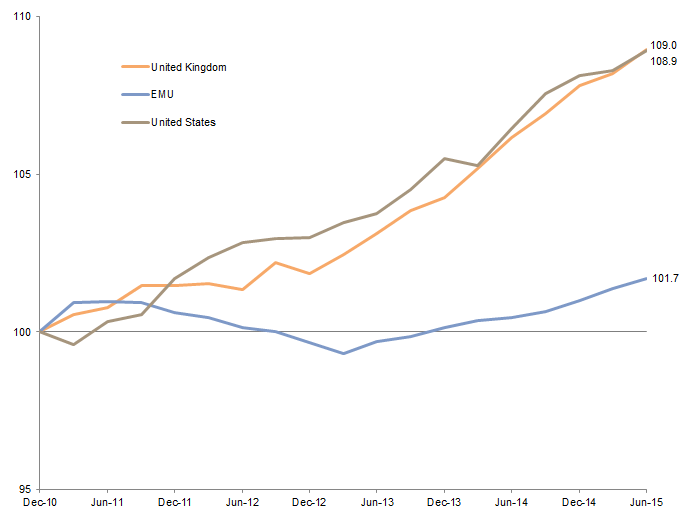
Figure 9. Cumulative GDP Growth
Fourth Quarter 2010 – Second Quarter 2015 • Local Currency • Rebased to 100 at 31 December 2010
Source: Thomson Reuters Datastream.
Still, whether investors should prefer exposure to the UK economy is an open question. The domestic economy has vulnerabilities that include stagnant productivity, a sign that the jobs being added may be in lower value-added sectors like retail and hospitality rather than highly skilled services or manufacturing. The recovery of recent years has also been accompanied by a significant debt build-up, though some of the rough 50 point increase in government debt versus GDP has more to do with the financial sector bailouts than it does higher social spending and is counterbalanced by lower interest rates. The government’s intention to tighten its belt in the years ahead will lessen one potential driver of economic growth.
Currency fluctuations will also come into play. The strength of the pound against emerging markets peers has weighed on profit growth for some large-cap UK companies. If economic growth disappoints and/or the Bank of England fails to match the expected rate hikes from the US Federal Reserve, the pound may weaken against the US dollar, thus increasing the value of earnings (and dividends) for companies that report in US dollars for sterling investors. However, dollar strength is often associated with commodity weakness, which might offset some of the benefits in this scenario.
One wildcard for all types of UK firms is the health of the Eurozone economy, due to strong trade links between the two regions. In recent months the Eurozone has enjoyed a mild cyclical upswing, helped by the ECB’s expansion of quantitative easing, lower oil prices, and a weakening euro. Improving conditions in the Eurozone should present some upside for UK firms that export to the region. However, the recent escalation of tensions with Greece is a reminder that structural adjustments continue to be required in the Eurozone, and further volatility could both curb nascent growth as well as cast a pall over all types of European assets.
Conclusion
UK equities have lagged in recent years, as weak performance from large-cap companies has offset sparkling performance from mid-cap equivalents. This has improved normalised valuations for UK large-cap companies relative to both mid-cap peers and to global equivalents, though it is far from clear when the catalyst will emerge that might unlock this value, and short-term metrics suggest large caps are less of a bargain.
Large-cap earnings are unlikely to recover until commodity prices rally and emerging markets growth stabilises, and the timeframe for both of these events appears to have been pushed back in recent months. The fate of the financial sector will also remain important; while some banks have probably put the worst of their loan and litigation charges behind them, others continue to shrink balance sheets and rethink previous expansions.
The outlook for UK mid-cap companies seems brighter, given more favourable sector and geographic tilts, less foreign currency exposure, and, for passive investors, higher index turnover. In light of earnings trends and short-term valuations that look less stretched relative to domestic large caps, investors choosing between the two asset classes should consider tilts toward UK mid caps, factoring in the size of the mid-cap opportunity (Figure 10). The choice between UK mid caps and foreign alternatives is more complex; normalised UK mid-cap valuations are lower on an absolute basis than global equivalents (Figure 2), but short-term metrics are quite stretched. UK investors looking at offshore markets should assess their desired currency exposures; some of their potential gains on Eurozone or Japanese equities could be diluted if those currencies depreciate against the pound.
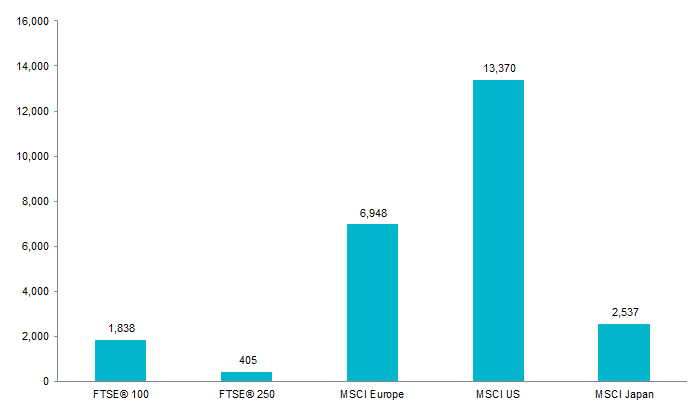
Figure 10. Total Market Capitalisation
As at 31 July 2015 • Sterling (billions)
Sources: FTSE International Limited, MSCI Inc., and Thomson Reuters Datastream. MSCI data provided “as is” without any express or implied warranties.
Note: Total market capitalisation figures are the month-end unadjusted market values.
The flipside of our somewhat unconstructive take on UK large caps is that it is widely shared. Surveys show global equity managers are underweight UK equities and that many UK-focused managers are holding relatively high levels of cash. Thus, it may only take a small earnings surprise (like, for example, one spurred by higher oil prices) to move the needle and make investors more constructive. Still, given the number of uncertainties facing these stocks (oil, China, currency risk, dividends, etc.), it seems unlikely that investors will soon rush back in.
Wade O’Brien, Managing Director
TJ Scavone, Senior Investment Associate
Joe Comras, Investment Associate
Footnotes