Retiring European Central Bank (ECB) President Mario Draghi recently gave bond investors a departing gift, announcing a series of easing measures intended to boost growth and inflation. Fixed income assets had already generated strong year-to-date gains even before the actual announcement, as bond investors (correctly) anticipated the rate cut and resumption of asset purchases. Unfortunately, today’s feast will lead to tomorrow’s famine for credit investors, as low yields portend subdued future returns in public credit; private market returns are also threatened by rising competition. Investors will need to be nimble to find attractive risk-adjusted returns in the months ahead.
Economic and Policy Backdrop
Eurozone economic growth has decelerated since reaching a post-crisis high in 2017, challenged by ongoing secular forces (e.g., debt and demographics), as well as cyclical issues (Figure 1). GDP growth is expected to decelerate from 1.9% in 2018 to 1.1% this year, and the recent sharp deterioration in manufacturing data threatens even this gloomy forecast. Trade-reliant Eurozone economies have been impacted by the US-China trade war, as well as ongoing complications from (among other things) 2018’s drought and revised auto emission standards. Eurozone governments, their hands tied by Eurozone deficit rules restricting the use of fiscal stimulus, have encouraged monetary policy to play a greater role in stimulating growth.
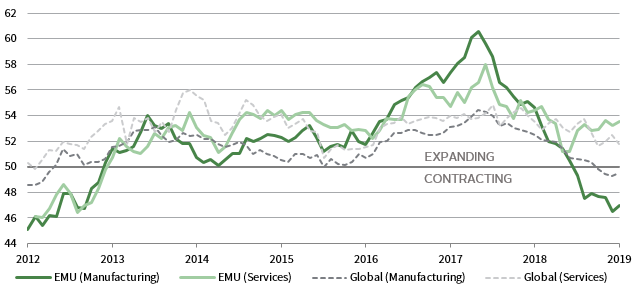
FIGURE 1 GLOBAL & EUROZONE MANUFACTURING & SERVICES PMIS
31 August 2012 – 31 August 2019
Sources: Markit Economics and Thomson Reuters Datastream..
Responding to lackluster growth and limited inflationary pressures, the ECB announced a series of measures, including a 10 basis point (bp) cut to its key benchmark rate, additional bond purchases of €20 billion per month, and a decrease in the interest rate charged to banks on its main lending program (the Term Long-Term Refinancing Operations, or TLTRO) on September 12 (Figure 2). The potential effectiveness of these measures is debatable, given how much has already been done. Indeed, a growing number of Eurozone central bankers had cautioned the ECB against more easing in recent months, positing that the costs of negative rates—to savers, pension schemes, banks, and others—were doing more harm than good. The main policy rate (paid to banks on deposits) was already negative (-0.40%) to encourage more lending. Eurosystem (ECB and individual central banks) balance sheets are already swollen by more than €2.6 trillion of asset purchases in recent years, including more than €2 trillion of sovereign bonds, and are bumping up against limits of how much of these assets they can own. Finally, banks are hardly starved of liquidity; aside from the TLTRO, many are drowning in deposits or have access to cheap wholesale funding.

FIGURE 2 CUMULATIVE NET PURCHASE BREAKDOWN UNDER THE ECB’S ASSET PURCHASE PROGRAM
31 October 2014 – 31 August 2019 • Euro (Billions)
Source: European Cental Bank.
Notes: Other programs category includes Corporate Sector Purchase Program (CSPP), Asset-Backed Securities Purchase Program (ABSPP), and Third Covered Bond Purchase Program (CBPP3).
The September announcement did not address some practical difficulties, such as existing limits on the amount of bonds the ECB can buy, which include not buying more than a third of a member nation’s sovereign debt and only buying non-financial corporate bonds. While these are likely to be eased, there are considerations. The ECB already owns more than €2 trillion of sovereign bonds, including 33% of outstanding German government debt, and the country’s balanced budget may mean just €21 billion of debt is eligible for purchase in 2019. Meanwhile, after buying around €180 billion of non-financial corporate bonds, the remaining eligible universe may be just €340 billion, though the 70% issuer limit could also be eased.
Credit Returns and Valuations
European credit investors have enjoyed significant gains in 2019 as yields have fallen. Euro-denominated corporate investment-grade bonds returned 7.6% year-to-date through August 31, while euro-denominated high-yield bonds returned 9.5%. Credit assets that struggled in 2018 have staged fierce rebounds; deeply subordinated bank debt (euro-denominated contingent capital securities) returned 14.7% year-to-date and leveraged loans returned 3.3%. Some sterling-denominated returns have been even stronger, with corporate investment-grade and high-yield bonds returning 11.1% and 7.8%, respectively, year-to-date.
Strong returns have compressed yields to historical lows. Investment-grade euro corporate bonds yielded just 0.23% as of August 31, and nearly 40% of constituents had negative yields. The 109 bp option-adjusted spread (OAS) on these bonds looks better in comparison (48th percentile), but should be viewed in the context of declining credit quality (Figure 3). Roughly 50% of the euro-denominated investment-grade index is rated BBB. Sterling investment-grade spreads (149 bps, 60th percentile) are above their historical median, while sterling high-yield bond spreads look attractively priced (509 bps OAS, 51st percentile) relative to euro-denominated high-yield equivalents (336 bps, 21st percentile), despite Brexit-related uncertainty. The catch is the size of the opportunity set; the ICE BofA Merrill Lynch Sterling High Yield Index is tiny (£31 billion) compared to the ICE BofA Merrill Lynch Euro HighYield Index (€268 billion). Euro- and sterling-denominated high-yield indexes have a higher-quality (Ba2 & Ba3, respectively) orientation compared to the USD equivalent (B1). Comparing like for like, euro and USD index spreads are closer (e.g., BB-rated spreads in euro and USD terms stand at 227 bps and 221 bps, respectively).[1]A similar story holds true in investment grade, where the OAS on AA-rated corporate bonds in euro and USD terms were 66 bps and 61 bps, respectively.
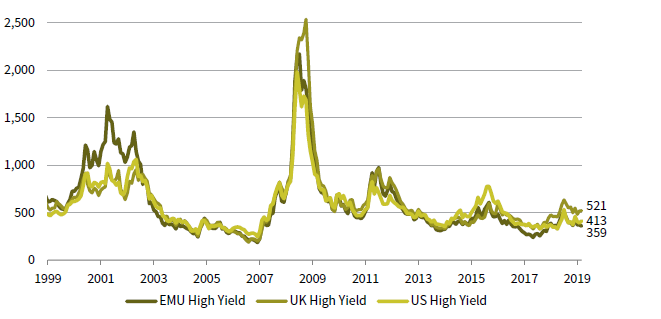
FIGURE 3 OPTION-ADJUSTED SPREADS: EUROZONE, UK, AND US HIGH-YIELD BONDS
30 June 1999 – 31 August 2019 • Basis Points (bps)
Source: ICE BofA Merrill Lynch.
Note: EMU, UK, and US high yield represented by the ICE BofA Merrill Lynch Euro High-Yield Index, ICE BofA Merrill Lynch Sterling
High-Yield Index, and ICE BofA Merrill Lynch US High-Yield Index, respectively.
The ability of foreign investors to enter into cross-currency basis swaps that result in similar (or higher) yields as to those available in their domestic markets may help explain the equivalence of spreads across markets. For example, a USD investor can buy euro high-yield bonds yielding just 3.4%, but can pick up another 260 bps by swapping them back to US dollar. The resulting 6.0% yield is slightly higher than that available via the ICE BofA Merrill Lynch US High Yield Index (5.7%), though there have been times earlier in 2019 when the pick-up was even higher.
Fundamentals and Technicals
European credit fundamentals have been sound, but face slowing economic growth and elevated political risks. Pan-European high-yield issuer revenue growth slowed to just 1% in first quarter 2019 (year-over-year), and further deceleration could eventually flow through to leverage ratios (debt to EBITDA).[2]Deciphering these trends using first quarter 2019 data is complicated by the implementation of International Financial Reporting Standard 16, which forces companies to include certain operating … Continue reading The better news is that the 6x coverage ratio (EBITDA versus interest expense) looks very high on a historical basis, given the low absolute level of interest rates and, thus, bond coupons.
High coverage ratios and reasonable, though slowing, growth help explain why high-yield default rates have been contained. The 12-month trailing issuer default ratio stands at just 0.2%, below its historical median (Figure 4). Looking ahead, a recent increase in higher-quality issuance (around 66% of year-to-date issuance has carried BB ratings, for example) could continue to put a ceiling on defaults. The caveat is that recoveries are already low, averaging just 30%. Meanwhile, loan underwriting standards are easing and so-called covenant-lite issuance (around 80% of market) is rising, as is the case in the United States.

FIGURE 4 EUROZONE HIGH-YIELD ISSUER-WEIGHTED DEFAULT RATES OVER TIME
30 June 1998 – 31 August 2019 • Percent (%)
Source: ICE BofA Merrill Lynch.
Note: Default data represented by the ICE BofA Merrill Lynch Euro High Yield Index.
Slowing issuance amid healthy investor inflows have supported Eurozone credit. Euro-denominated high-yield issuance has totaled €37 billion year-to-date, a 12% decline from 2018’s pace. Euro-denominated investment-grade credit also benefits from favorable technicals; issuance has increased dramatically in recent years, but has been met with robust demand given falling rates. Net issuance rose from barely above zero in 2014 to €162 billion for full-year 2018; 2019 should set a new record with €164 billion of year-to-date net issuance. The ECB’s corporate securities purchase program, which ran from June 2016 through December 2018, absorbed an estimated €5 billion to €6 billion per month of non-financial corporate bonds, and its announced resumption could push already-low yields even lower. Sterling corporate issuance has been much slower, with around £18 billion year-to-date of net investment-grade issuance after just £7 billion in 2018. Meanwhile, sterling-denominated high-yield issuance has been practically non-existent year-to-date (£3 billion).
Other Opportunities
Investors unenthused about near-zero yields on corporate euro-denominated investment-grade bonds or 3.4% yields on euro-denominated high-yield bonds have other options, though they often entail trade-offs, including tying up capital or illiquidity. The scale of some private credit opportunities is also limited, which is particularly concerning in markets where investors have amassed significant dry powder. Within semi-liquid credit, Eurozone collateralized loan obligation (CLO) liabilities offer higher spreads than comparably rated corporate bonds (Figure 5). Newly issued AA-rated CLO debt (often with Euribor floors) recently carried spreads of around 175 bps, more than twice the 66 bp OAS for similarly rated corporate bonds. Supply has been limited; so far this year, borrowers have issued just €20.1 billion of new European CLOs,[3]US volumes year-to-date are more than four times larger at $83.9 billion. a decrease from last year’s pace. Lower-rated CLO liabilities look especially attractive relative to local corporate credit; new issue CLO BBB spreads are currently around 390 bps versus 140 bps for comparably rated corporate bonds. Subordinated debt instruments issued by European banks also look attractive, with spreads on the euro-contingent capital bond index (BB-rated) ending August around 410 bps, nearly twice the spread on BB-rated corporate bonds. Given diverging fortunes for some European banks, however, and the fact that some of these bonds may prove to be longer duration than expected (bonds are typically structured as callable), this opportunity is best accessed through active managers.

FIGURE 5 EUROPEAN CREDIT SPREADS BY RATING FOR VARIOUS ASSET CLASSES
As at 31 August 2019 • Basis Points (bps)
Sources: Barclays, Bloomberg Index Services Limited, and Credit Suisse.
Notes: Asset classes represented by: Bloomberg Barclays Pan-European High Yield Index (HY Bonds), Credit Suisse Western European Leveraged Loan Index (Leveraged Loans), Bloomberg Barclays Pan-European Aggregate Corporate Index (Euro IG), Bloomberg Barclays Pan-European Aggregate Corporate Aa Index (Euro IG AA), Bloomberg Barclays Pan-European Aggregate Corporate A Index (Euro IG A), Bloomberg Barclays Pan-European Aggregate Corporate Baa Index (Euro IG BBB), and Bloomberg Barclays European Banks CoCo Index (Euro Bank Tier 1). CLO data are sourced from Barclay’s CLO & Leveraged Loan Monthly Update. The positioning of the Euro IG asset class on the x-axis represents a split rating of A/BBB.
Credit investors able to lock up capital have a richer opportunity set. The withdrawal of banks from certain lending markets is creating fertile ground for direct lending funds in Europe, but investors should keep in mind that the same forces weighing down yields in public credit also apply in private. Many direct lending funds are targeting just 6% to 7% net returns in euro terms, though the flipside is that these returns are still up to twice the yield of the high-yield index. These funds are typically lending to companies with less leverage than issuers in the broadly syndicated loan market and their loans carry more covenants, but whether this is enough to save them during the next downturn remains to be seen. Investors should monitor underwriting standards closely, as growing competition among some of the recent mega funds raised in this space is likely to encourage borrowers to push for more aggressive terms. The estimated €48 billion of dry powder in such funds is also likely to weigh on future returns.
Please see Himanshu Chaturvedi and Tod Trabocco, “Trade Finance: An Expanding Opportunity for Institutional Investors,” Cambridge Associates Research Report, 2018.
One question for private credit investors in Europe is whether they want to lock up capital now or wait for more attractive opportunities. Many direct lending funds have ten-year lives (including possible extensions). Because of uncertainty over where we are in the cycle, less cyclical strategies with shorter lock-ups may have some appeal to investors.[4]Trade finance is another example of a less correlated strategy that is also available via an open-ended fund. These cover a broad spectrum of activity. Return targets for these strategies can vary—more conservative strategies like trade finance and infrastructure offer low/middle single-digit expected returns, while royalties or insurance investors look for high single-digit/low double-digit returns—though risk is commensurate with return targets. Manager selection is important in these asset classes, as large fund raises may mean some are becoming less selective.[5]For example, FundFire notes more than $9 billion has been committed to litigation finance alone. There are also a variety of sub-strategies (global versus country-specific litigation, pre- and post-settlement claims, etc.), and the potential outcomes of certain transactions may mean returns are more binary than in a typical lending strategy.
For more on how Cambridge Associates categorizes the distressed landscape, please see Tod Trabocco, “Distressed Debt: A New Way to Categorize Managers,” Cambridge Associates Research Report, 2018.
Traditional distressed-for-control managers have recently seen slim pickings, and it is unclear when a pronounced distressed market might offer better opportunities. Economic growth is slowing, but a recession is not a forgone conclusion (and could be deferred by recent ECB intervention). The current 7% distressed ratio (share of European high-yield bonds trading with a spread of greater than 1,000 bps), is similar to that in the United States, but the overall Eurozone high-yield market is much smaller. Trading-oriented strategies could see some opportunities if the sizable euro-denominated BBB universe sees increased downgrades (Figure 6). At €1.4 trillion, it is almost 5x the size of the Bloomberg Barclays Pan-European High Yield Index, raising questions about available demand if a large share of these bonds were downgraded. Still, almost 50% of this exposure is BBB+, and less than 20% carry BBB- ratings (the credits most at risk of credit deterioration). Capital opportunity funds are an evergreen opportunity, given their focus on performing, if struggling, companies and ability to enhance returns by going lower in the capital stack (via subordinated debt) or obtaining equity participation (via warrants, for example). Drawdown funds are one way to tackle the problem of allocating too soon, especially if they use triggers that cite a deterioration in economic or corporate data as a catalyst to call capital.
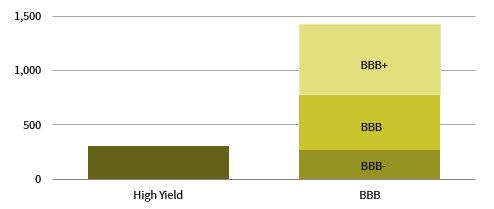
FIGURE 6 EUROPEAN CORPORATE HIGH-YIELD & BBB MARKET VALUES
As at 31 August 2019 • Euro (Billions)
Source: Bloomberg Index Services Limited.
Notes: BBB market represented by the Bloomberg Barclays US Corporate Investment Grade Bond Index. High-yield bond
data are represented by the Bloomberg Barclays Corporate High-Yield Bond Index.
The European non-performing loan market continues to see brisk activity, with around €200 billion of face value trading hands in 2018. Most of the volume took place in Italy and Spain, as northern European banks are more advanced in cleaning up balance sheets. Expected returns are falling as more capital targets the space, though higher returns may be available in less picked-over geographies. As the landscape shifts, sourcing relationships, servicing abilities, and structuring expertise are increasingly important, as securitization is often used to help firms digest large transaction sizes (with sellers often retaining some of the senior risk).
Conclusion
The macro backdrop is not especially encouraging, but accommodative central banks mean European credit markets may remain well-supported. Investors in liquid credit may need to get creative given low yields in asset classes like euro-denominated investment-grade and euro-denominated high-yield bonds. Investors looking for higher-quality investments can invest in trade finance to get attractive yields and low correlations with other risk assets. For those needing higher yields, structured finance markets (like CLO debt) offer much higher spreads than comparable corporate equivalents, but are most appropriate for those who are not in need of daily liquidity. For investors that can lock-up capital in traditional intermediate to long-term closed-end vehicles, the opportunity set is deeper, but so, too, is the competition, and the range of outcomes is broader. Less correlated strategies like royalties and litigation intrigue, but generalizing about “betas” is harder and manager selection is paramount. In general, we are less enamored with direct lending because of low target returns and the need to tie up capital for an extended period, but are attracted to the better terms obtained by private lenders versus participants in broadly syndicated loans.
Wade O’Brien, Managing Director
Brandon Smith, Associate Investment Director
Index Disclosures
Bloomberg Barclays Aggregate Index – Corporates
The Bloomberg Barclays Global Aggregate Index – Corporates is the corporates portion of the Barclays Global Aggregate index grouping. The index consists of more than 5,000 government, corporate, asset-backed, and mortgage-backed securities.
Bloomberg Barclays Corporate High Yield Index
The Bloomberg Barclays Corporate High Yield Index measures the US corporate market of non-investment-grade, fixed-rate corporate bonds. Securities are classified as high yield if the middle rating of Moody’s, Fitch, and S&P is Ba1/BB+/BB+ or below.
Bloomberg Barclays European Banks CoCo Index
The Bloomberg Barclays European Banks CoCo Index gauges the performance of contingent convertible (CoCo) bonds. The index assesses bonds using the middle rating of Moody’s, S&P, and Fitch. When a rating from only two agencies is available, the lower will be used.
Bloomberg Barclays Pan-European High Yield Index
The Bloomberg Barclays Pan-European High Yield Index measures the market of euro-denominated, non-investment-grade, fixed-rate corporate bonds. Inclusion is based on the currency of issue, and not the domicile of the issuer. The index excludes emerging markets debt.
Bloomberg Barclays US Corporate Investment Grade Bond Index
The Bloomberg Barclays US Corporate Investment Grade Bond Index measures the investment-grade, fixed-rate, taxable corporate bond market. It includes USD-denominated securities publicly issued by US and non-US industrial, utility, and financial issuers.
Credit Suisse Western European Leveraged Loans Index
The Credit Suisse Western European Leveraged Loans Index is designed to mirror the investable universe of the Western European USD-, euro- and sterling-denominated high-yield debt markets. Qualifying securities must have a below-investment-grade rating (based on a median rating of Moody’s, S&P, and Fitch).
ICE BofAML Euro High Yield Index
The ICE BofAML Euro High Yield Index tracks the performance of euro-
denominated below-investment-grade corporate debt publicly issued in the euro domestic or eurobond markets. Qualifying securities must have a below-investment-grade rating (based on an average of Moody’s, S&P, and Fitch). Qualifying securities must also have at least one year remaining term to maturity, a fixed coupon schedule, and a minimum amount outstanding of €100 million.
ICE BofAML Sterling High Yield Index
The ICE BofAML Stering High Yield Index tracks the performance of British pound sterling–denominated below-investment-grade corporate debt. Qualifying securities must have a below-investment-grade rating (based on an average of Moody’s, S&P, and Fitch).
ICE BofAML US High Yield Index
The ICE BofAML US High Yield Index tracks the performance of USD-denominated below-investment-grade corporate bonds publicly issued in the US domestic market. Qualifying securities must have a below investment grade rating (based on an average of Moody’s, S&P, and Fitch), at least 18 months to final maturity at the time of issuance, at least one year remaining term to final maturity as of the rebalancing date, a fixed coupon schedule, and a minimum amount outstanding of $100 million.
Footnotes