- Latin American private equity and venture capital provides investors with direct exposure to companies offering products and services to the region’s growing middle class in a way not accessible via public market options.
- The region has a maturing private investment ecosystem with an increasing number of institutional-quality private equity managers, a large pool of small- and mid-sized companies, and attractive valuations relative to historical averages, indicating favorable investing dynamics.
- Non-local investors need to carefully consider their tolerance for exchange rate uncertainty given the difficulties of hedging private equity investments. Today’s near 20-year lows for most Latin American currencies might offer some comfort; however, exchange rate volatility is prevalent in Latin America and historical returns have been severely impacted by currency devaluations.
- CA data demonstrate “local” managers generate better realized returns than “fly-ins.” However, manager selection remains critical, with the variability of returns from median managers to top quartile managers surpassing 1,000 bps.
For more on the situation in Brazil, please see Sean McLaughlin, “Scandal, Recession, and Impeachment, Yet Brazilian Stocks Are Flying,” Cambridge Associates Research Note, June 2016.
Despite the recent economic woes in Latin America, most noticeably in Brazil, private markets continue to offer direct exposure to companies delivering products and services addressing the requirements of the region’s growing middle class in a way not accessible via public market options. Private equity funds in Latin America, which has a population on par with Europe and almost twice the size of the United States, have raised just $50 billion since 2009, including market topping totals of $10.4 billion in 2014 and $7.2 billion in 2015, according to the Latin American Private Equity and Venture Capital Association (LAVCA). Including capital that could be invested by international private equity funds, the region has an estimated $30 billion of dry powder waiting to be invested, one-fifteenth and one-fifth the size of the US and European private equity markets, respectively.
Given the lack of supply of private capital, the private equity investment opportunity in the region appears promising, particularly as Latin America is dominated by small family companies that could benefit from the professionalization that comes with private equity ownership. The industry also continues to mature as more institutional-quality private equity managers form. For most international investors, however, historical absolute average returns calculated on a USD basis have been uninspiring and recent performance has been dramatically impacted by the severe currency devaluation of Latin American currencies versus the US dollar since 2011. However, there are important bright spots: Latin American private equity pooled returns have largely outperformed Latin America’s public markets over the last ten years, and top-quartile managers have generated solid returns in US dollars.
Today’s low currency valuations, which are at or near 20-year lows, as well as historically attractive entry multiples, could portend more attractive investment opportunities, and for investors seeking regional diversification and differentiated exposure to emerging markets, the region is worth a closer look. Of course, investors must carefully consider their tolerance for exchange rate uncertainty given the length of time private investments are outstanding and the inability to cost effectively currency hedge such exposures.
Let’s Talk Private(ly)
Comparing Latin America’s private market to its public market, the strikingly different sector exposure on offer becomes apparent (Figure 1).[1]Country exposure can also differ, but less so. The MSCI Emerging Markets Latin America Index includes the equities of just five countries: Brazil, Chile, Colombia, Mexico, and Peru. Private exposure … Continue reading Latin American private equity managers are investing 55% of capital in the consumer discretionary (including subsectors such as education, media, and retail), industrial, and health care sectors versus just 15% in the public index. Just over 70% of public market capitalization is represented by the financial, consumer staples, and natural resources (energy and materials) sectors; private investors invested only 39% of capital in these sectors. Differences also exist in company size. Latin American public markets include primarily only large companies—Brazil, the largest and most diversified economy in Latin America, has 358 listed companies with an average market capitalization of $1.3 billion. In contrast, the average transaction size for private equity and venture capital in the region was just $21 million in 2015 according to LAVCA.
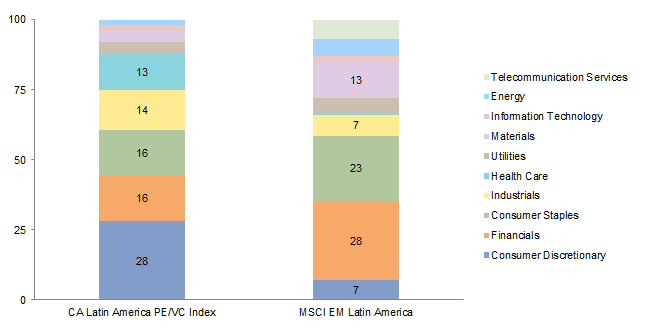
Figure 1. Comparing Private and Public Market Sector Weights in Latin America
As of December 31, 2015 • Percent (%)
Sources: Cambridge Associates LLC, FactSet Research Systems, and MSCI Inc. MSCI data provided “as is” without any express or implied warranties.
Notes: The CA Latin America PE/VC Index sector allocations are based on company data compiled from Latin American and Caribbean private equity funds (buyout, growth equity, private equity energy, and mezzanine funds) and venture capital funds, including fully liquidated partnerships. Excludes dedicated infrastructure and real estate funds.
Give the People What They Want. The rate of private investment into the consumer discretionary, health care, and industrial sectors, as well as technology, which is less represented in CA’s private investments database due to the more recent emergence of venture capital in the region, is driven by favorable secular growth dynamics across the region’s largest markets—Brazil, Mexico, and Colombia—fueled by a fast-growing middle class with increasing income demanding higher-quality products and services. According to the World Bank, since the beginning of the 2000s, more than 50 million Latin Americans have joined the middle class, which now accounts for 30% of the region’s 600 million population. This trend is not expected to slow down, and by 2030 the middle class in the region could reach 300 million, representing 40% of the population. In addition, 80% of Latin Americans live in an urban center—similar to the 82% in the United States and 74% in Europe, and much higher than the 48% in Asia—contributing to better and more efficient resource-sharing due to scalability and lower logistical costs, quicker matching of products and services, and also innovation. The smaller companies targeted by private investments can also more nimbly pivot to offer customers goods and services that meet current needs. Two of the sectors that present particularly interesting dynamics are health care and technology.
Health Care. Even though per capita spending on health care almost doubled to $714 from 2006 to 2014, overall health care spending across Latin America lags significantly behind more developed countries such as the United States and the United Kingdom, which spend over $9,000 and $3,500 per capita, respectively (Figure 2). In a 2013 World Health Organization study of overall health system performance, Chile and Colombia were the only two Latin American countries that ranked in the top 50 worldwide, while Brazil and Peru ranked 125th and 129th on the list of 191 countries.

Figure 2. Health Care Expenditures per Capita
2014 • US Dollars
Sources: The World Bank Group and World Health Organization – Global Health Expenditures.
Note: Data for 2014 last updated on July 8, 2016.
The public sector is starting to encourage private investment in health care, shown in Brazil’s 2015 legislation authorizing international private investors to acquire and operate health care facilities in the country. The higher-income demographic has largely migrated to private health care providers—in Brazil an estimated 25% of the population is enrolled in private health plans—and they, together with the emerging middle class, will continue to seek out better health care, supporting investment opportunities in the sector.
The increase in health care investments across the region has been noteworthy. According to LAVCA, in 2015 health care attracted $995 million of private equity investment, second only to oil & gas, where a small number of very large deals were completed in Mexico following the privatization of local energy markets. Just two years prior, in 2013, under $300 million was invested in health care. In Brazil alone, 28% of all capital invested in 2015 was in the health care space, the most of any sector.
Technology. By 2012, 98% of the Latin American population had a mobile signal, and mobile phone users are expected to reach 400 million this year, of which more than 150 million will be smartphone users. Smartphone users are expected to grow to 245 million by 2019, supporting online retail spending, online ad spending, and social media activity. Retail ecommerce sales rose 23% in 2015 to just over $40 billion, and by 2019, sales are estimated to double to $80 billion. One would expect these growth levels to persist in the long term as the percentage of retail ecommerce relative to total retail sales remains low at around 2%. This number is expected to grow to 3.5% by 2019, which would still offer robust growth opportunities given the 10.5% penetration levels in the United States in 2015.
The size of the total addressable market for online goods and services in Latin America has resulted in an increase in venture capital activity in startups across the region. According to LAVCA, just under $600 million was deployed across 182 venture deals in 2015 alone, of which 149 took place in Brazil and Mexico. By comparison, a mere $63 million was deployed in 2010. Propelled primarily by the maturity of the Brazilian ecosystem, later-stage investment rounds more than doubled from 29 in 2014 to 64 in 2015, with numerous companies attracting capital from international venture capital investors. Given the region’s potential for technological and efficiency improvements, limited partners could benefit from venture capital investing. Yet, investors should note that among private investment strategies, dispersion of returns is highest for venture capital, and a venture capital strategy is suitable only for institutions with truly long-term horizons, and the ability to absorb an extended J-curve as well as the slower return of capital.
Small and Medium Enterprises Dominate Latin American Business. Private equity managers typically acquire control of, or provide expansion capital to, privately held lower-middle-market companies, and Latin America has these in spades. Brazil alone has nearly 75,000 small-cap and mid-market companies with 50–250 employees (Figure 3), 80%–90% of which consisted of family- or founder-owned companies. Similarly, Mexico has more than 40,000 lower-middle-market companies with revenues between $2 million and $45 million. There are easily over 130,000 of these companies in Latin America, composing more than 80% of private sector economic activity and responsible for 60% of Latin American GDP.
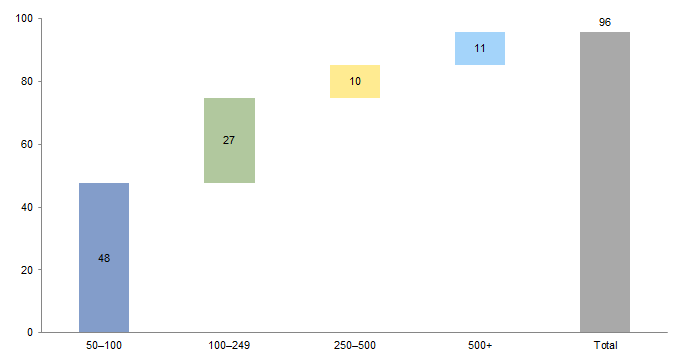
Figure 3. Number of Companies in Brazil by Total Employees
2013 • Thousands
Source: Brazilian Institute of Statistics (IBGE).
Note: Data exclude companies with less than 50 employees.
Against this backdrop, 2015 saw just 124 growth equity and buyout investments in the region according to LAVCA, implying that the sizable Latin American lower middle market offers a significant supply of investment opportunities for private equity managers, even if many of these companies are not “for sale.” Consequently, it is not surprising that over 75% of private equity activity in Latin America has been concentrated in investments below $50 million in equity (Figure 4).

Figure 4. Investments in Latin America by Equity Invested
As of Third Quarter 2015 • Investments as a Percentage of Total Deals Completed (%)
Source: Cambridge Associates LLC.
Notes: Based on company data compiled from 455 local and non-local Latin American and Caribbean private equity funds (buyout, growth equity, private equity energy, and mezzanine funds) and venture capital funds, including fully liquidated partnerships, formed between first quarter 2000 and third quarter 2015. Excludes dedicated infrastructure and real estate funds. Investments completed by non-local funds in Bermuda, all of which were in the insurance sector, have been excluded for this analysis.
Valuations Almost Quaint. Unlike the United States or Europe, where acquisition EBITDA purchase multiples have reached all-time highs—in fact, over the past 11 years the long-term average US entry multiple is 0.8 turns higher than in Latin America—Latin American entry multiple valuations are low, at just 6.6 times in 2014 and 7.1 times in 2015, over three turns lower than their peak of 10.7 times in 2012, as estimated by CA’s private investments database (Figure 5). These valuations suggest an opportune time to invest, particularly for investors with global co-investment programs that have the ability to build a highly customized portfolio.

Figure 5. Average EBITDA Purchase Price Multiples: Latin American PE vs US PE
Calendar Years 2005–15 • Enterprise Value/EBITDA
Sources: Cambridge Associates LLC, FactSet Research Systems, and Standard & Poor’s LCD.
Notes: Data for Latin America are based on 187 portfolio companies. Latin America data were collected directly from investment managers and have not been independently verified. Outliers, as well as negative multiples, were identified and excluded. US data are as of March 2016.
The historical volatility in Latin American private equity purchase multiples can partly be explained by managers investing in more growth-oriented assets that commanded higher multiples in years of strong economic performance (see 2012). However, the higher purchase multiples have also been driven by investments that were completed by “fly-in” private equity funds—global firms without a dedicated Latin American team or fund—and were most active during years of strong macroeconomic growth. For example, the average entry valuation for “local” private equity firms ( those with Latin America–dedicated funds) between 2010 and 2012 was 8.2 times EBITDA, compared to 11.0 times for investments completed by international “fly-in” firms.
Steady Exit Environment. The main exit route for private equity firms seeking realizations in Latin America—also globally—has been via mergers & acquisitions (M&A). Despite the macroeconomic slowdown, which has had some impact on the overall M&A market, private equity firms have been able to continue exiting their investments. According to LAVCA, Latin American private equity and venture capital funds in 2015 generated 52 exits in 2015, consistent with the annual average of 54 since 2008.
Performance: Do the Returns Go the Distance?
Overall, private equity and venture capital returns in Latin America have outperformed public comparables on a USD basis consistently across one-, three-, five-, and ten-year horizons (Figure 6). The 15- and 20-year horizon returns, on the other hand, underperformed the public index, though in the 20-year period funds in the top two quartiles were able to best the public market return.
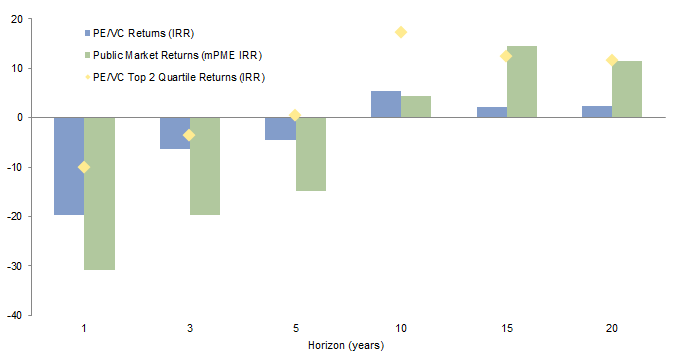
Figure 6. Latin American PE/VC Returns vs Public Market Comparables
As of December 31, 2015 • USD Terms • Percent (%)
Sources: Cambridge Associates LLC, MSCI Inc., and Thomson Reuters Datastream. MSCI data provided “as is” without any express or implied warranties.
Notes: The CA Latin America PE/VC Index is a horizon calculation based on data compiled from Latin American and Caribbean private equity funds (buyout, growth equity, private equity energy, and mezzanine funds) and venture capital funds, including fully liquidated partnerships. IRRs are pooled horizon returns, net of fees, expenses, and carried interest. The CA Modified Public Market Equivalent (mPME) replicates private investment performance under public market conditions. The public index’s shares are purchased and sold according to the private fund cash flow schedule, with distributions calculated in the same proportion as the private fund, and mPME NAV is a function of mPME cash flows and public index returns. Public index data represented by the MSCI Emerging Markets Latin America Index.
Since 2011, all major Latin American currencies have depreciated at least 25% against the US dollar, which has led to underwheming performance for Latin American funds on a USD basis. The Brazilian real (BRL) in particular has lost more than half of its value (see Appendix). Such strong devaluations mean that returns calculated in local currency for investments completed across Brazil, Colombia, and Mexico significantly outperformed USD returns (Figure 7).
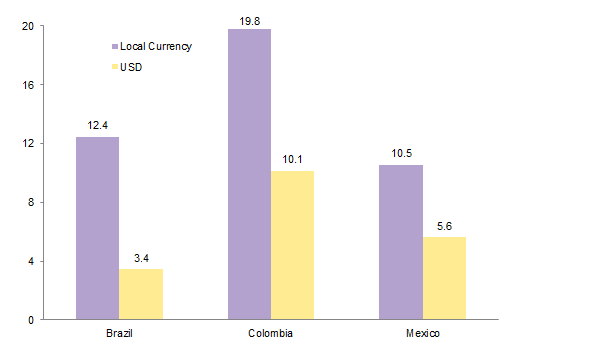
Figure 7. Comparing Latin American PE/VC Returns in Local Currency and US Dollars
Since Inception – Fourth Quarter 2015 • Percent (%)
Source: Cambridge Associates LLC.
Notes: The CA Latin America PE/VC Index is a horizon calculation based on data compiled from Latin American and Caribbean private equity funds (buyout, growth equity, private equity energy, and mezzanine funds) and venture capital funds, including fully liquidated partnerships. Returns are pooled horizon IRRs, gross of fees, expenses, and carried interest. The initial investment dates for Brazil, Colombia, and Mexico are as of second quarter 1987, fourth quarter 1992, and first quarter 1992, respectively.
The “Real” Impact of the FX Effect in Latin America: An Example. To illustrate the impact currency devaluation and appreciation can have (and have actually had) on USD investors in Latin America, we modeled the USD returns of funds with vintage years ranging from 1998 to 2010 that would have generated a constant 20% gross internal rate of return (IRR) on a BRL basis. As shown in Figure 8, the currency impact has been significant for most vintages, with lower USD returns than local currency returns for the 1998 and 1999 funds, as well as those raised after 2007 (six vintages). The impact devaluation has had on the more recent funds in this example is staggering. In contrast, USD investors would have benefited from the currency exchange in seven vintages—funds raised between 2000 and 2006.
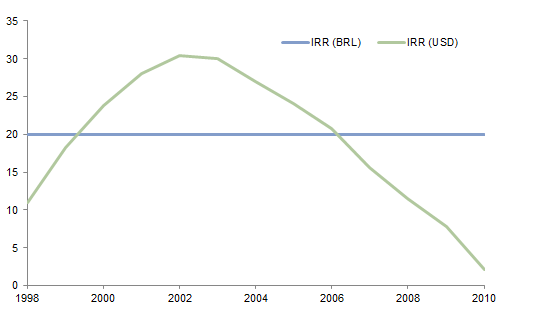
Figure 8. An Illustration of the FX Effect: Returns in BRL vs USD
Vintage Years 1998–2010 • Percent (%)
Sources: Cambridge Associates LLC and Thomson Reuters Datastream.
Notes: Funds were assumed to invest 100% of capital over a four-year period and portfolio companies were exited after a five-year holding period. Capital was assumed to be deployed and realized at one point within the year, and cash flows were calculated using an annual average of exchange rates within that year. For more recent funds with partially realized portfolios, unrealized portfolio companies were assumed to perform at a constant 20% gross IRR, valued as of year-end 2015 (a year in which the BRL experienced its lowest yearly average valuation against the USD since at least 1998).
This analysis exemplifies the importance of time diversification—and portfolio construction—when investors can be impacted by exchange rate movements. Exchange rates are not predictable, and while the performance on a USD basis of vintage year 2009 and 2010 Brazilian funds is likely to be poor, an investor with a time-diversified portfolio could have compensated for the most recent performance with other fund vintages that benefited from currency appreciation. As with all private investment strategies, investors benefit from maintaining exposure consistently rather than pursuing exposure opportunistically.
Investors’ Options—Shop Local or Go Global. More and better local/regional managers are in the market than ever before. Investors can opt for two sets of “local” managers: (1) firms—whether global or Latin American—with funds (and teams) investing specifically in the region, and (2) firms located and investing in one specific Latin American country. On the latter, the landscape of country-focused managers in Brazil, Colombia, Mexico, and Peru continues to grow and institutionalize, having already evolved significantly since the mid-2000s. LAVCA has over 160 members, many of which are local investors, and new strategies such as venture capital and distressed credit are gaining ground while the manager landscape appears to have stabilized.
An alternative to these local managers would be international private equity firms that incorporate Latin America into their investment mandate and invest in the region opportunistically. In recent years—similar to the behavior witnessed in the late 1990s—many of these firms opened offices in the region, largely in São Paulo, to source local investment opportunities. Investors that consider this route should prepare for exposure to large Brazilian companies. According to Cambridge Associates data, since 2005 around 70% of the capital invested by international managers in Latin America—excluding energy—has been deployed in Brazil. Data from CA’s private investments database since 2004 show that 2008 and 2010–12 were the most active calendar years for international private equity managers in Latin America in terms of capital invested and deals completed, a period that attracted higher purchase price multiples and peak exchange rates for local currencies versus the US dollar.
Performance Says Shop Local. Local funds—both regional and country-focused—have demonstrated an ability to outperform their global peers, with realized investments completed by these managers generating outperformance of 0.3 to 0.5 turns of gross multiple of invested capital (Figure 9). Prior to 2000, a period in which private equity activity was nascent in the region, local funds solidly outperformed international funds, returning 1.3x versus 0.8x. Over the 2000–07 period, returns were much stronger for both groups, and local funds outperformed by slightly less. More recently, local funds have posted stronger outperformance but realized returns for both local and fly-ins have been modest at best, with many realizations impacted by the severe devaluation of Latin American currencies, as previously discussed.
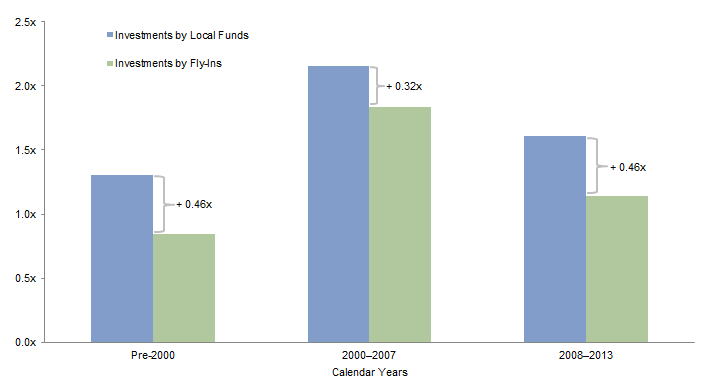
Figure 9. Multiple of Invested Capital for Realized Latin American Investments
As of Third Quarter 2015 • USD Terms
Source: Cambridge Associates LLC.
Notes: Returns are at the company level, gross of fees, expenses, and carried interest. Represents fully realized Latin American investments compiled from Latin American and Caribbean and fly-in private equity funds (buyout, growth equity, private equity energy, and mezzanine funds) and venture capital funds, including fully liquidated partnerships, formed between first quarter 1987 and third quarter 2015. Excludes dedicated infrastructure and real estate funds. Investments completed by fly-in (non–Latin American) managers in Bermuda, all of which were in the insurance sector, have been excluded for the analysis.
Nevertheless . . . Manager Selection Matters. Even within the subset of local funds, returns vary significantly from one manager to another, as is typical within private investment strategies. In US private equity, for example, between 1998 and 2010 top quartile managers outperformed the median by over 710 bps on a net IRR basis and 0.4 turns on a total value to paid-in capital (TVPI) basis. Over the same period, the returns captured by top quartile managers in Latin America outpaced median performance by over 1,000 bps on a net IRR basis and 0.6 turns and 0.7 turns on a TVPI and DPI (distributed to paid-in capital) basis, respectively, demonstrating manager selection in Latin America is particularly important (Figure 10).
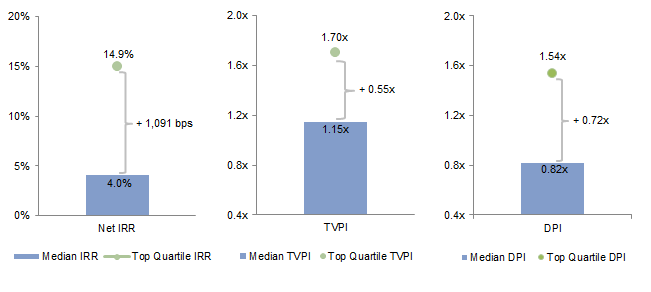
Figure 10. Median and Top Quartile Returns Across Latin America
As of Fourth Quarter 2015 • USD Terms
Source: Cambridge Associates LLC.
Notes: Horizon returns are net of fees, expenses, and carried interest. Based on company data compiled from 33 Latin American and Caribbean private equity funds (buyout, growth equity, private equity energy, and mezzanine funds) and venture capital funds, including fully liquidated partnerships, formed between 1998 and 2010 in the CA Latin America PE/VC Index.
Conclusion
Investors looking for diversification and exposure to emerging markets should keep an eye on Latin American private equity and venture capital. The region’s private markets are investing in sectors demonstrating strong secular growth dynamics and that remain largely unavailable to investors via public markets, such as health care and technology. Moreover, the industry’s continued maturation offers investors greater options to invest in private equity than ever before, with a distinguished set of experienced managers at the country, regional, and international level. The recent macroeconomic slowdown, coupled with the devaluation of Latin American currencies, has had an impact on USD returns, yet these recent challenges—as well as historically low valuations—could also provide for attractive investment opportunities, the ultimate impact of foreign exchange rates notwithstanding.
Appendix: Currency Matters
Currency volatility is not a new development in Latin America, as all major Latin American currencies have experienced significant movements versus the US dollar over the past 18 years. Devaluation has been particularly significant since 2011, a period during which all Latin American currencies have depreciated at least 25% against the US dollar to levels not seen since at least the early 2000s—in particular, the Brazilian real has lost more than half of its value despite a recovery run in the first half of 2016. Consequently, the performance of unrealized funds as of year-end 2015 shown throughout this note has been significantly impacted.

FX Effect: USD vs Major Latin American Currencies
January 31, 1998 – June 30, 2016
Sources: Cambridge Associates LLC and Thomson Reuters Datastream.
Note: Data are monthly.
Index Disclosures
Cambridge Associates Latin America & Caribbean Private Equity & Venture Capital (PE/VC) Index
The Cambridge Associates Latin America & Caribbean PE/VC Index is a subset of the Cambridge Associates Emerging Markets PE/VC Index, which is derived from the financial information contained in CA’s proprietary database of global ex US private equity and venture capital funds. As of December 31, 2015, the database comprised 52 Latin America and Caribbean venture capital, growth equity, buyout, private equity energy, and mezzanine funds.
MSCI Emerging Markets Latin American Index
The MSCI EM LatAm Index captures large- and mid-cap representation across five emerging markets countries in Latin America. With 140 constituents, the index covers approximately 85% of the free float–adjusted market capitalization in each country.
Andrea Auerbach, Managing Director
Inigo Garcia, Investment Director
Other contributors to this research note include Rich Carson and T.J. Scavone.
Footnotes