New Zealand has arguably fared better during the global pandemic than any other developed country. The economy has rebounded, equity markets have outperformed, and the currency remains strong. While 2021 should see the New Zealand economy continue to fare well, complacency is the biggest risk, both in regards to COVID-19 and global growth, but also in relation to sky-high equity valuations, both at home and abroad. The global economy should continue to recover in 2021; however, last year’s winners may end up being this year’s laggards.
Macro
The New Zealand economy demonstrated a V-shaped recovery, with third quarter 2020 real GDP growth rebounding to 3.9% on a year-over-year basis. The country’s early closure of international borders and stringent lockdown measures have aided virus containment efforts and allowed for a quicker pace of economic recovery as compared to most global peers. A main driver was the early recovery in consumer confidence, which may continue to serve as a tailwind for the New Zealand economy in 2021. Retail sales had recovered sharply from their trough in second quarter 2020 and grew by 8.2% year-over-year in third quarter 2020, while a sustained rise in house prices should help to create a positive wealth effect and boost domestic spending (Figure 1).
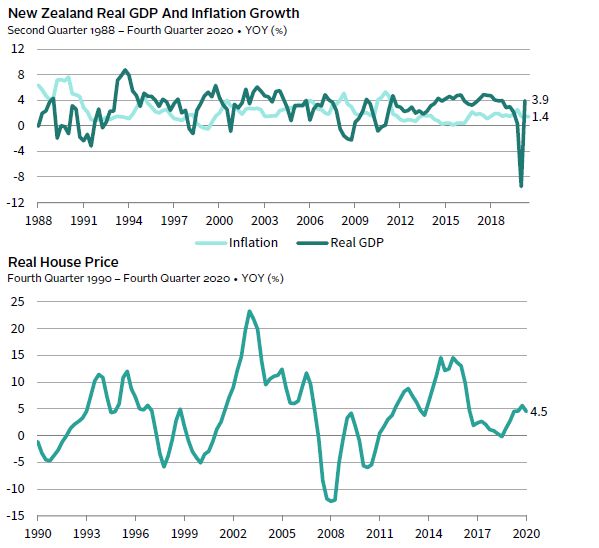
FIGURE 1 NEW ZEALAND ECONOMIC INDICATORS SHOW V-SHAPED RECOVERY
Sources: Oxford Economics, Statistics New Zealand, and Thomson Reuters Datstream.
Note: Real GDP data are as of 30 September 2020.
In the meantime, government support to affected households and businesses has also been substantial. Based on Goldman Sachs’ estimates, discretionary fiscal spending in 2020, which included income relief to those who lost their jobs or were impacted by self-isolation measures, amounted to 9.8% of New Zealand’s GDP. Lower costs of borrowing and government incentives to boost business investments should also help to support the economy, with the Reserve Bank of New Zealand’s (RBNZ) NZ$100 billion asset purchase program supplementing its cuts in the RBNZ cash rate.
Despite New Zealand’s head start in normalizing the economy, there remains potential for its growth to outpace that of global peers’ in 2021. Consensus forecasts see New Zealand’s real GDP expanding by 4.5% year-over-year in 2021, as compared to 4.1% in the United States and 3.7% in Australia. Key risks to New Zealand’s growth include a slower-than-expected normalization of the global economy, which will put a drag on the country’s tourism income and net exports. However, the momentum of New Zealand’s domestic economic recovery is likely to remain strong as compared to countries where resurgent COVID-19 cases have dampened consumer and business confidence. New Zealand’s free vaccination program, which is scheduled to begin in second quarter 2021, should also help the process, with a survey by the World Economic Forum showing that the majority of residents are open to receiving vaccinations. Yet despite the positive growth outlook, inflation is expected to remain muted at 1.3% for 2021, relatively unchanged from current levels.
Equities
The S&P/NZX 50 Index returned 13.9% in 2020, outperforming most equity markets in local currency terms and unhedged terms since the New Zealand dollar strengthened over the period. Aside from the country’s early containment of the virus and normalization of the economy, New Zealand equities also benefitted from their larger exposure to defensive and high-yield stocks, which had demonstrated resilience during the COVID-19 crisis amid investor risk aversion and a collapse in global bond yields (Figure 2). The market is also underweight the energy and financials sectors; both have been amongst the hardest hit sectors during the COVID-19 outbreak. However, idiosyncratic risks remain high in the New Zealand equity market. Based on our calculations, a single underlying stock—Fisher & Paykel Healthcare Corporation—had contributed more than 50% of the S&P/NZX 50 Index’s return over 2020.
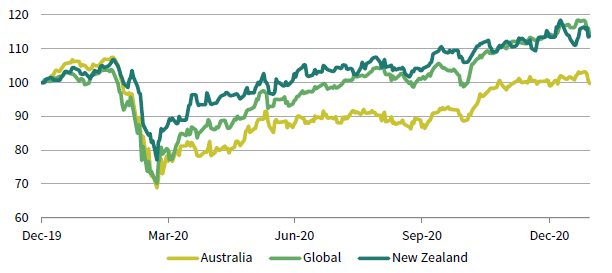
FIGURE 2 NZ EQUITIES OUTPERFORMED FOR MOST OF 2020
31 December 2019 – 31 January 2021 • Local Currency • 31 December 2019 = 100
Sources: MSCI Inc. and Thomson Reuters Datastream. MSCI data provided “as is” without any express or implied warranties.
Notes: Data are daily total return. New Zealand, Australia, and Global equities are represented by the MSCI New Zealand Investable
Market Index, MSCI Australia Index, and MSCI All Country World Index, respectively. Total return data for all MSCI indexes are net of
dividend taxes.
Given the rally in 2020, valuations remain very expensive based on our normalized P/E metrics, with the return-on-equity–adjusted price-earnings (ROE-adjusted P/E) ratio at the 97th percentile of historical observations and the cyclically adjusted price-to–cash earnings (CAPCE) metric at the 100th percentile of historical observations.[1]The CAPCE is based on the ten-year average of cash earnings (or earnings excluding depreciation and amortisation) and excludes banks and insurance companies. The ROE-adjusted P/E includes banks and … Continue reading The run-up in New Zealand equity prices has not been matched by a recovery in earnings, suggesting that the current rally may not be sustainable. Except for US equities, which have been driven up by the rally in technology and growth stocks, New Zealand equity valuations are also elevated compared to global equity markets (Figure 3).
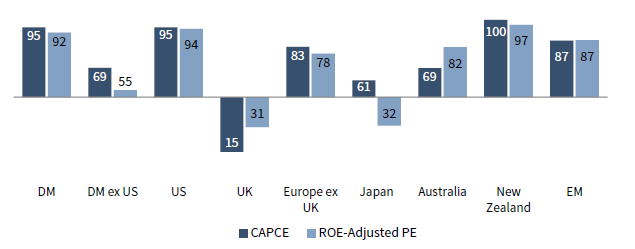
FIGURE 3 NZ EQUITIES ARE EXPENSIVE
As at 31 January 2021 • Percentile (%)
Sources: MSCI Inc. and Thomson Reuters Datastream. MSCI data provided “as is” without any express or implied warranties.
While low cash and bond yields have supported elevated valuations in 2020, New Zealand equities are at risk should an acceleration in post-pandemic global growth lead to rising interest rates and a rotation toward cyclical and value stocks. This is in contrast to markets such as Australia and the United Kingdom, which stand to benefit from the cyclical rotation given their high exposure to financials and energy stocks. Based on our valuation metrics and the outlook for global growth, we favour tilting portfolios toward developed ex US equities, as well as toward value, small-cap, and Asia ex Japan equities.
Fixed Income
New Zealand ten-year government bond yields fell to a record low of 0.44% in September 2020 following a 75 basis point (bp) RBNZ rate cut in March 2020 that took the policy rate to 0.25%. This came as the RBNZ and other global central banks turned to aggressive monetary policy easing in a bid to mitigate the economic fallout arising from the COVID-19 outbreak. While yields have since risen to reach 1.10% as of the end of January 2021 due to positive vaccine developments and the easing of investor risk aversion, New Zealand government bonds remain expensive by historical standards and offer limited return prospects over the medium to long term.
Bond yields in New Zealand no longer offer their historical yield advantage versus US and Australian bonds but remain higher than Japanese and European government bonds. We continue to see the risk/reward trade-off for global bonds as worse than New Zealand bonds, with the FTSE World Government Bond Index now yielding only 0.25% (Figure 4). Additionally, the positive implied carry from hedging back to the New Zealand dollar has been greatly reduced following recent RBNZ rate cuts, with the carry-adjusted yields for most developed markets government bonds now being lower than New Zealand government bond yields.

FIGURE 4 NZ GOVERNMENT BOND YIELDS REMAIN HIGHER THAN GLOBAL YIELDS
30 June 2000 – 31 January 2021 • Percent (%)
Sources: FTSE Fixed Income LLC, Reserve Bank of New Zealand, and Thomson Reuters Datastream.
Note: Data for New Zealand reflect New Zealand ten-year government bonds yields and data for global bonds reflect the FTSE World
Government Bond Index yields.
Currency
The New Zealand dollar experienced a bumpy ride in 2020, falling by 11% against the US dollar in first quarter 2020 before gaining 20.5% to finish the year up 7.3% against the US dollar. In trade-weighted terms, the New Zealand dollar was up 1.8% over 2020. The New Zealand dollar’s rally in the later part of 2020 was in part due to the broad-based weakness of the US dollar, as the US Federal Reserve’s rate cuts reduced the US dollar’s yield advantage and the Fed’s decision to adopt “average inflation targeting” in August 2020 pushed US real yields lower. However, the New Zealand dollar was down 2.4% versus the Australian dollar over 2020, in part due to rising commodities prices that boosted the Australian dollar.
Consensus forecasts see the New Zealand dollar gaining modestly against the US dollar and remaining flat against the Australian dollar in 2021. A key risk to the New Zealand dollar is a dovish RBNZ deciding to take the cash rate lower should inflation remain muted and below the 2% mid-point of the target range. Current forecasts see that the RBNZ will bring the cash rate down to 0.15% in second quarter 2021, as compared to the United States and Australia where rates are estimated to be held steady. However, continued strength in the country’s economic recovery may eliminate the need for further rate cuts. Additionally, a rebound in dairy prices would also help to serve as a tailwind for the New Zealand dollar.
Based on real exchange rate valuations, the New Zealand dollar is elevated in trade-weighted terms, and also against both the US dollar and Australian dollar despite the narrowing of interest rate differentials (Figures 5 and 6). A positive correlation remains between global equities and the New Zealand dollar, implying that unhedged exposure helps to lower volatility. Thus, we still see that NZD-based investors could benefit from being partially unhedged.
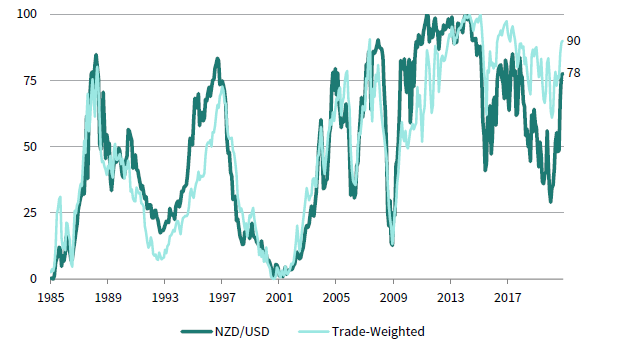
FIGURE 5 REAL EXCHANGE RATE VALUATIONS REMAIN ELEVATED
31 March 1985 – 31 January 2021 • Percentile (%)
Sources: Bank for International Settlements, MSCI Inc., OECD, and Thomson Reuters Datastream. MSCI data provided “as is”
without any express or implied warranties.

FIGURE 6 NZ 10-YR GOVERNMENT BOND SPREADS HAVE NARROWED
30 June 2020 – 31 January 2021 • Basis Points (bps)
Sources: Reserve Bank of New Zealand and Thomson Reuters Datastream.
Conclusion
New Zealand has a head start on the post-pandemic economic recovery, given its early containment of the COVID-19 outbreak. With daily new virus cases remaining low and vaccinations set to be deployed in second quarter, New Zealand has the potential to outpace other countries in terms of economic growth in 2021, backed by strong consumer and business confidence. However, the risk is that past success against the virus results in complacency and a renewed outbreak. The tourism sector may also remain subdued should global vaccination efforts drag on and take longer than expected.
New Zealand equities outperformed in 2020 as investors sought defensive and high-yielding assets and are now vulnerable from a valuations perspective, particularly if interest rates rise and a rotation toward value occurs. As such, we recommend tilting equity portfolios toward developed ex US, value, small-cap, and Asia ex Japan equities, where valuations are less stretched and sectors are poised to benefit from the global economic recovery. Australian equities should also benefit from these trends.
The RBNZ’s rate cuts have greatly reduced the interest rate differentials between New Zealand and broader developed markets and the carry from FX hedging. With carry-adjusted yields for most developed markets government bonds now lower than New Zealand government bonds, we see the risk/reward trade-off to favour New Zealand government bonds.
Finally, the outlook for the New Zealand dollar is mixed, with elevated valuations and reduced support from interest rates offset by the prospect of a recovering economy and a generally weak US dollar. We still recommend that NZD-based investors remain partially unhedged to protect against any downward pressure on the New Zealand dollar and to benefit from reduced volatility on global equity allocations.
Aaron Costello, Managing Director
Vivian Gan, Investment Associate
Figure Notes
Figure 3
ROE-adjusted P/E data begin 31 January 1971, and CAPCE data begin 31 December 1979. New Zealand ROE-adjusted P/E and CAPCE data begin 30 June 1994 and 31 May 2004, respectively. EM ROE-adjusted P/E and CAPCE data begin 30 September 1995 and 31 August 2000, respectively. EM CAPCE data are cyclically adjusted by trailing 5-year real cash earnings.
Index Disclosures
FTSE World Government Bond Index
The FTSE World Government Bond Index measures the performance of fixed-rate, local currency, investment-grade sovereign bonds. The index is a widely used benchmark that currently includes sovereign debt from more than 20 countries, denominated in a variety of currencies, and has more than 30 years of history available. The index provides a broad benchmark for the global sovereign fixed income market. Sub-indexes are available in any combination of currency, maturity, or rating.
MSCI All Country World Index
The MSCI ACWI is a free float–adjusted, market capitalization–weighted index designed to measure the equity market performance of the full opportunity set of large- and mid-cap stocks across 23 developed and 27 emerging markets. It covers more than 3,000 constituents across 11 sectors and approximately 85% of the free float–adjusted market capitalization in each market. The developed markets country indexes included are: Australia, Austria, Belgium, Canada, Denmark, Finland, France, Germany, Hong Kong, Ireland, Israel, Italy, Japan, the Netherlands, New Zealand, Norway, Portugal, Singapore, Spain, Sweden, Switzerland, the United Kingdom, and the United States. The emerging markets country indexes included are: Argentina, Brazil, Chile, China, Colombia, Czech Republic, Egypt, Greece, Hungary, India, Indonesia, Korea, Kuwait, Malaysia, Mexico, Pakistan, Peru, the Philippines, Poland, Qatar, Russia, Saudi Arabia, South Africa, Taiwan, Thailand, Turkey, and the United Arab Emirates.
MSCI Australia Index
The MSCI Australia Index was launched on 31 March 1986 and is designed to measure the performance of the large- and mid-cap segments of the Australia market. With 65 constituents, the index covers approximately 85% of the free float–adjusted market capitalization in Australia.
MSCI New Zealand Investable Market Index
The MSCI New Zealand Investable Market Index was launched on 5 June 2007 and is designed to measure the performance of the large-, mid-, and small-cap segments ofthe New Zealand market. With 25 constituents, the index covers approximately 99% ofthe free float–adjusted market capitalization in New Zealand.
S&P/NZX 50 Index
The S&P/NZX 50 Index is designed to measure the performance of the 50 largest eligible stocks listed on the New Zealand Stock Market by free float–adjusted market capitalization. It covers approximately 90% of New Zealand equity market capitalization.
Footnotes