When evaluating US credit trends over the last two decades, an institutional loan default that occurs within its year of origination has often been an ominous sign
- The idea resembles the closely monitored first payment–default metric that consumer lenders track as a bellweather for loan quality
- A loan default within its year of origination has regularly signaled that vintage year would ultimately have a high cumulative default rate
- Keeping an eye on these types of defaults may be a useful tool to add to an investor’s suite of market indicators
Market commentators regularly point to poor yields and limited covenant protection as risks in today’s credit markets. As monetary policy tightens, concerns are also rising that fixed income returns may weaken and bring new defaults. Economic fundamentals and the recent US fiscal tax stimulus are currently supporting corporate credits, but growing issuance, rising debt levels, and weakening documentation cast a gloomier light on credit’s future.
An obscure metric may provide a clue on vintage credit quality, when looking at US credit defaults over the last 23 years. The metric, which we call origination year defaults (OYD), refers to the number of loan defaults that occur within the year of origination. These are relatively rare—in fact only seven loans have defaulted within their first year based on available data—but in instances when OYD occurs, cumulative default rates have tended to rise to more than 5%. While fixed income valuations remain distorted by global monetary policies and the search for yield, OYDs may foreshadow the next credit cycle downturn.
The Metric’s Record
Standard & Poor’s Leveraged Commentary and Data, which includes 10,850 institutional BB- and B-rated corporate loans from 1995 to 2017, highlight that corporate credit defaults tend to occur in bunches. Though there is no perfect measure to identify turning points in credit cycles, the OYD metric may help investors make better investment decisions.
For purposes of this analysis, we identified three groups of loan vintages spanning the last two default cycles and the periods in between (Figure 1). Group 1 includes the 1997–2001 vintages (average cumulative default rate of 15.95%), and Group 2 includes the 2005–08 vintages (average cumulative default rate of 9.60%). The third group of benign vintages includes those that registered cumulative defaults of less than 5%.
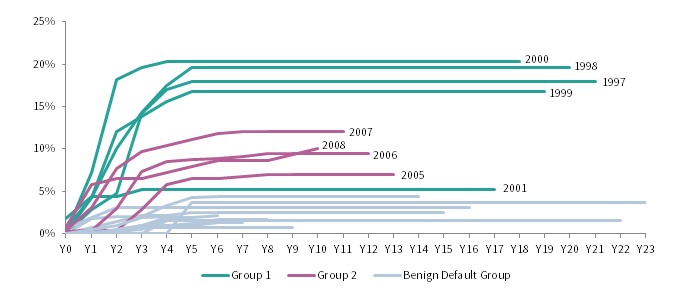
FIGURE 1 CUMULATIVE DEFAULT RATES
Source: Standard & Poor’s LCD, an offering of S&P Global Market Intelligence.
Figure 1 suggests that for vintage years with high cumulative default rates, most of the defaults tend to occur in the first three years after origination. For these vintages, the default rate often peaks around year four or five. Similarly, for vintage years that have low cumulative default rates in the first few years, the ultimate number of defaults tends to remain low. In other words, if things are going to go badly, they tend to go badly early.
OYD may help identify credit trends early (Figure 2). The concept resembles the closely monitored “first payment defaults” that consumer lenders track as a bellweather for loan quality. Over the past 23 years, 16 years have not had an OYD. Of those 16 years, 13 vintages had low default rates. Based on this observation, it seems reasonable to think that a vintage year without an OYD may not see high cumulative default rates. Luckily for us, no recent year has had an OYD default!
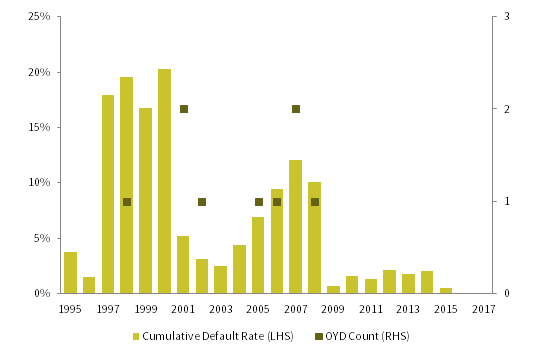
FIGURE 2 CUMULATIVE VINTAGE DEFAULT RATE AND OYD COUNT
Source: Standard & Poor’s LCD, an offering of S&P Global Market Intelligence.
In contrast, vintage years with an OYD tend to fare poorly. In fact, of these seven vintage years, six had cumulative default rates greater than 5%. Moreover, in the last credit cycle downturn each year had at least one OYD.
But the metric has not always worked. The 2002 vintage had an OYD, and yet, the cumulative default rate for that vintage ended up being a benign 3.1%. Moreover, 1997, 1999, and 2000 did not have an OYD, even though all of those vintages years had credit difficulties. However, the 1999 and 2000 vintages were preceded by the 1998 vintage, which had an OYD, and saw cumulative default rate rise quickly, from 0.53% in year one to 10.05% in year three, potentially warning investors about a turn in the credit cycle.
A closer inspection of the 1997 and 1998 vintages also reveals that a loan originated in December 1997 defaulted in August 1998, and a loan originated in December 1998 defaulted in July 1999. While neither of these loans defaulted in their origination calendar year, both loans defaulted within a 12-month period. Though the metric is by no means perfect, it appears to offer some insight on vintage year performance. But remember to watch those December loans!
A Portfolio Tool
OYD, in combination with other more traditional credit metrics, may help investors better position their portfolios. For investors with control over vintage year allocation to performing loan strategies, OYD may be a signal to either halt or decrease capital commitments. For example, investors may reconsider allocations to private credit funds that are fundraising in a year with an OYD, particularly when other credit metrics support that conclusion. Similarly, larger investors with bespoke vehicles and appropriate control over them may use the OYD metric to either halt or slow investment activity. Investors with exposure to leveraged loans—either directly or through collateralized loan obligation liabilities—could track OYD when making buy or sell decisions.
Similarly, investors interested in allocating to distressed strategies could also utilize the OYD metric, as part of a broad review of credit trends. For example, if loan defaults start to accelerate in the first three years following the origination year and OYD is positive, investors could consider allocating to distressed managers. Investors considering delayed investment–distressed vehicles could suggest OYD as one trigger to begin investing rather than relying on manager discretion alone.
Concluding Remarks
Allocating capital through a credit cycle is challenging, and unfortunately, there is no perfect predictor of default likelihood. When looking to the future, we rely on a variety of metrics to help form our view of what’s likely to come. Although the OYD metric has been useful in hindsight, we’ll see if its usefulness will continue. But with all the capital that’s entered the loan market in recent years and rising uncertainty about when the credit cycle will turn, we’re happy to keep track of one more metric.
Tod Trabocco, Managing Director