The risks from rising rates are potentially higher in New Zealand than elsewhere given the overvaluation of equities and the housing market. We advise investors to underweight NZ equities, fixed income in general, and the NZ dollar.
- The positive momentum underpinning the global economy looks set to continue in 2018. However, continued growth may see inflation start to rise back to normal levels across developed markets. This should drive interest rates higher. While rising rates alone will not derail the global economy, they could trigger a rise in market volatility.
- For New Zealand, the risk from rising rates is higher than elsewhere, given the overvaluation of the equity market and housing market. The NZ dollar is also vulnerable if the Reserve Bank of New Zealand (RBNZ) does not follow the US Federal Reserve higher in hiking rates.
- Ultimately, we judge the risks to the global outlook as balanced, and advise investors to remain neutral on global equities and risk levels despite the growing bullishness of the consensus. We advise investors to underweight NZ equities, fixed income in general, and the NZ dollar.
Surprises abounded in 2017. The year began with optimism over the so-called reflation trade spurred on by the election of Donald Trump as president of the United States. The consensus view was that fiscal stimulus in the United States would help boost global growth and inflation, resulting in rising bond yields, a strong US dollar, and the outperformance of value versus growth stocks, both in the United States and globally. At the same time, Europe seemed poised to elect populist anti-EU parties, while emerging markets seemed on a collision course with Trump’s protectionist campaign promises.
In reality, quite the opposite happened; the Trump administration was hamstrung for most of the year, Europe didn’t implode, inflation failed to appear, bond yields moved lower, the US dollar tanked, growth trounced value, and EM assets soared. Global stock markets did post strong returns for the year, but this was driven by evidence of synchronised global growth and low inflation, not reflation.
For 2018, the consensus outlook calls for a continuation of recent trends—synchronised global growth, low inflation, and accommodative central banks will drive another year of equity gains amid USD weakness. If anything, optimism is higher than last year, as the cloud of political risk in Europe and the United States hovered over much of 2017. Today, there are few clouds on the horizon, at least as far as 2018 is concerned. Yes, there are Italian elections scheduled for March, and US mid-term elections in November, but none of these pose systemic risks (for now at least). North Korea remains a risk, but that has always been the case.
However, we may be approaching a tipping point; 2018 may finally see inflation across the developed world start to return to normal, and with it expectations for central bank tightening and rising bond yields. Though markets may take this in stride, rising rates could also serve as the trigger for increased market volatility, setting the stage for a slowdown in global growth in 2019.
New Zealand may in fact be in the vanguard. Domestically, the biggest surprise of 2017 was the outcome of the general election, which resulted in the Labour/NZ First/Green coalition. The change in government has also seen a shift in policy toward migration and government spending that may hasten the emergence of inflation.
Please see our ‘Outlook 2018: Stick Around for Dessert’, Cambridge Associates Research Report, December 2017.
Overall, current conditions suggest the global market rally may continue, however, we warn investors to not become complacent about risk given elevated valuations for many asset classes. We advise investors to remain neutral on equities and risk in general, underweight duration and credit, and look for opportunities in more niche and illiquid strategies.
A Change Is Gonna Come
The positive global backdrop is also reflected in New Zealand. Real GDP growth is expected to rise to 3.00% in 2018, up from an already respectable 2.60% forecast for 2017. Inflation should remain in check, staying at 1.90%, in the middle of the RBNZ’s 1%–3% target band (Figure 1).
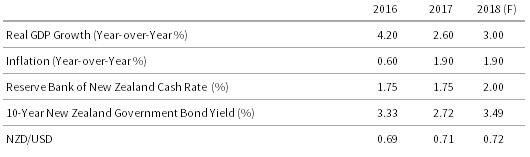
FIGURE 1 NEW ZEALAND ECONOMIC INDICATORS
As at 9 January 2018
Source: Bloomberg L.P.
Note: Real GDP growth and inflation figures for 2017 are forecast, as are all 2018 figures.
However, this positive backdrop is not expected to result in the RBNZ meaningfully tightening monetary policy, with consensus forecasts seeing the cash rate rise from 1.75% to 2.00% (i.e., one hike). This is in contrast to the US Federal Reserve, which has indicated plans to hike rates three times in 2018, bringing the Fed Funds rate to a consensus-estimated 2.20% by year end. If so, this would take policy rates in the United States above those in New Zealand, something not seen since 2000 (Figure 2).

FIGURE 2 CENTRAL BANK POLICY RATES
31 March 1999 – 31 December 2018 • Percent (%)
Sources: Bloomberg L.P., Federal Reserve, Reserve Bank of Australia, Reserve Bank of New Zealand, and Thomson Reuters Datastream.
Note: Dashed lines represent forecasts and are based on the respective Bloomberg consensus.
The reluctance of the RBNZ to follow the Fed higher in 2017 and 2018 stems from concern that rising rates may put upward pressure on the NZ dollar and also rattle the housing market. House price appreciation has been slowing, especially in Auckland (Figure 3). While there remains spirited debate about whether this is temporary due to a lack of oversupply, the anti-immigration policies of the new government certainly reduces one source of demand.
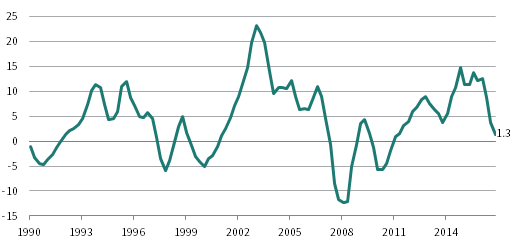
FIGURE 3 NEW ZEALAND REAL HOUSE PRICE
Fourth Quarter 1990 – Third Quarter 2017 • Year-over-Year (%)
Sources: Quotable Value and Thomson Reuters Datastream.
The dovishness of the RBNZ also reflects a concern that the recent rise in inflation to ‘normal’ levels may be transitory. However, the changes in government policy may very well boost inflation. One explanation for why inflation has been so low despite a booming economy has to do with the record levels of net migration. Essentially, the steady increase in the supply of labour has kept a lid on wages and slowed growth in GDP per capita, creating extra slack in the economy. However, this positive-supply shock is set to reverse right when wage pressures are increasing. Indeed, net migration was already slowing ahead of the October election, perhaps due to the improving global growth outlook (and improved labour markets in Australia). At the same time the new government is seeking to limit the new supply of labour, it is also seeking to boost the cost of labour by implementing a 27% increase in the minimum wage by 2020. Add to this an increased level of planned government spending on infrastructure and housing, and the backdrop certainly starts to look inflationary. Yet the RBNZ still projects it will not tighten monetary policy until second quarter 2019 citing uncertainty in the economic outlook, which we interpret to mean housing prices.
A dovish RBNZ in the face of a hawkish Fed does not sound like a supportive environment for the NZ dollar. Yet consensus forecasts see the NZ dollar rising slightly in 2018 versus the USD, following last year’s 2.0% gain (Figure 4). This disconnect may stem from the consensus view of continued broad-based USD weakness in 2018, given that Fed hikes in 2017 did little to support the greenback, and skepticism that the Fed will hike beyond 2018. However, a rebound in the US dollar may be one of the surprises in 2018. Unlike this time last year, the market is bearish and net-short the US dollar. Should the US economy remain resilient—let alone accelerate—in 2018, skepticism over future rate hikes may dissipate, helping drive the greenback higher. US rates moving above NZ rates have historically seen NZ dollar weakness, such as during the 1999–2002 period. Though New Zealand’s terms of trade are much higher today than during that period (suggesting a higher level of the NZD/USD rate is justified), the NZ dollar looks expensive on a real exchange rate basis, adding to its vulnerability. Thus, we continue to advocate investors remain partly unhedged.
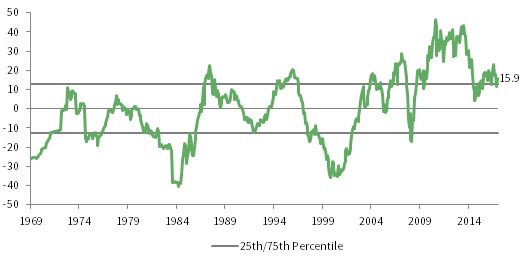
FIGURE 4 NZD/USD REAL EXCHANGE RATE
31 December 1969 – 31 December 2017 • Percent from Median (%)
Sources: MSCI Inc., Statistics New Zealand, Thomson Reuters Datastream, and US Department of Labor – Bureau of Labor Statistics. MSCI data provided ‘as is’ without any express or implied warranties.
Notes: New Zealand inflation data as of 30 September 2017. US inflation data as of 30 November 2017.
And what if the RBNZ decides to turn hawkish and follow the Fed higher? One would assume this would occur because growth conditions in New Zealand are better than expected or inflation accelerates sooner than expected; however, the headwind of rising rates on the housing market might still take the wind out of the sails of the Kiwi, especially given the back drop of slowing dairy prices (Figure 5).

FIGURE 5 ANZ DAIRY PRICE INDEX
31 January 1987 – 30 November 2017 • Year-over-Year Percent (%)
Sources: Australia and New Zealand Banking Group and Thomson Reuters Datastream.
Overall, we find the global economic backdrop as benign for now. At some point, robust growth will translate into inflation rising back toward normal levels, which will in turn prompt continued normalisation of global interest rates. This was expected to be the case last year, but 2018 may very well be the tipping point. However, we judge that rising rates will not pose too much of a headwind for most major economies in 2018, but risks will rise heading into 2019 as monetary policy may become restrictive. This is especially the case for New Zealand as new government policies may prove to be inflationary. In the meantime, the RBNZ will have to choose whether to follow the Fed or not, and if the RBNZ remains dovish in the face of rising global rates, expect the NZ dollar to come under pressure.
Equities: Can New Zealand Three-Peat?
The S&P/NZX50 returned 22.0% in 2017, outperforming most developed markets in local currency terms for the second year in a row. NZ dollar weakness boosted unhedged returns for most markets, except US equities (Figure 6).
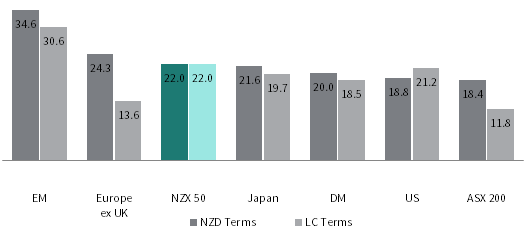
FIGURE 6 PERFORMANCE OF GLOBAL EQUITIES
31 December 2016 – 31 December 2017 • Total Returns • Percent (%)
Sources: MSCI Inc., Standard & Poor’s, and Thomson Reuters Datastream. MSCI data provided ‘as is’ without any express or implied warranties.
Note: Total return data for all MSCI indexes are net of dividend taxes.
Please see Aaron Costello and Han Xu, ‘New Zealand Outlook 2017: As Good As It Gets?‘, Cambridge Associates Research Note, January 2017.
Last year we recommended overweighting non-US developed markets equities and EM equities at the expense of US equities, given valuation concerns for the latter. This only partly worked out; EM equities indeed had a great year, but so did US equities. Arguably, the outperformance of both markets was due in part to stellar returns for technology stocks, with Chinese tech giants Tencent and Alibaba nearly doubling in 2017, and the FAANGs[1]FAANGs refers to Facebook, Amazon, Apple, Netflix, and Google. in the United States still leading the charge.
We also thought NZ equities would underperform, given the momentum of the reflation trade, which hurt NZ equities in fourth quarter 2016. This failed to materialise, as the reflation trade reversed and global bond yields fell, boosting returns for high-yielding sectors and markets, such as New Zealand. At the same time, there were idiosyncratic stock-specific factors in New Zealand. Specifically, the near-300% return for a2 Milk™ contributed 5.6 percentage points to the S&P/NZX 50 Index return, based on our calculations. Absent this stock, NZ equities would have arguably underperformed global equities.
Will NZ equities be able to outperform for a third year in row in 2018? We doubt it, especially if domestic and global bond yields do rise. Even absent rising yields, we are concerned about domestic valuations. Based on our normalised P/E metric, NZ equities are 24% overvalued, and back to valuation levels that preceded the 2016 sell-off (Figure 7). Though the market is far from the very overvalued levels seen in 2007, further market gains will only increase the risk from rising rates. This is especially the case should index-related flows into NZ equities start to reverse.
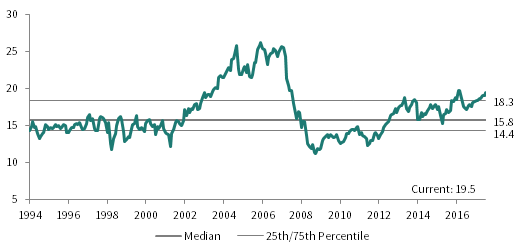
FIGURE 7 MSCI NEW ZEALAND IMI ROE-ADJUSTED P/E
30 June 1994 – 31 December 2017
Sources: MSCI Inc. and Thomson Reuters Datastream. MSCI data provided ‘as is’ without any express or implied warranties.
New Zealand is also expensive in a global context. By our metrics, global equities are 31% overvalued, versus 24% for New Zeland equities (Figure 8). Excluding US equities, developed markets valuations are only 11% above historical median. EM equities also remain attractively priced despite last year’s strong gains (a result of the cheap market and healthy earnings). As a result, we continue to recommend tilting toward non-US and EM equities at the expense of US and NZ equities. This is especially the case because the technology sector in the United States is unlikely to benefit much from recent corporate tax cuts. These companies already pay a below-average tax rate as a result of their offshore earnings, which face a repatriation penalty. Regulatory headwinds are rising for the technology sector, partly because of its high profitability.
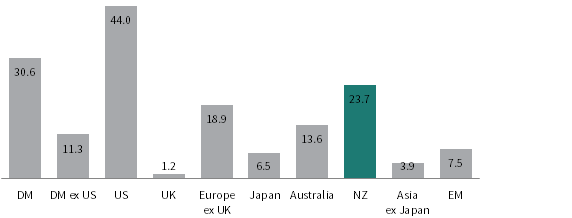
FIGURE 8 MSCI ROE-ADJUSTED P/E % DEVIATION FROM HISTORICAL MEDIAN
As at 31 December 2017
Sources: MSCI Inc. and Thomson Reuters Datastream. MSCI data provided “as is” without any express or implied warranties.
Note: DM valuation is the weighted average of US, UK, Europe ex UK, Japan, Australia, Singapore, Hong Kong, Canada, Israel, and New Zealand valuations. DM ex US valuation is the weighted average of UK, Europe ex UK, Japan, Australia, Singapore, Hong Kong, Canada, Israel, and New Zealand valuations.
We also expect value strategies to come back into favour. Though the timing of this is uncertain (and perhaps does not occur until after the next recession), we still think investors should begin to position for a change in equity market leadership.
In general, we expect the global equity rally to lose steam in 2018. A correction is inevitable, and rising rates may be the catalyst. With that said, rising earnings should be able to offset any multiple contraction, with the net result of modest equity gains. Of course, any number of shocks could hit markets and disturb the unusually low level of volatility seen last year. The odds of a bear market unfolding in 2018 seem low, but rise heading into 2019.
Fixed Income: Return to Normal?
NZ government bonds returned 5.43% in 2017, outperforming bank bills (Figure 9). Yields fell for much of the year after surging in late 2016. Falling yields were a global trend, but NZ bonds outperformed due to their yield advantage. This was the case even after accounting for the positive carry from FX hedging.
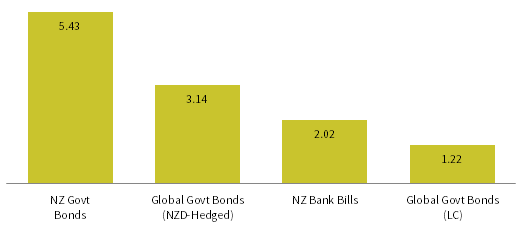
FIGURE 9 PERFORMANCE OF GLOBAL BONDS
31 December 2016 – 31 December 2017 • Total Returns • Percent (%)
Sources: Bloomberg L.P., Citigroup Global Markets, Standard & Poor’s, and Thomson Reuters Datastream.
Current yields still seem out of line with an economy growing 5% in nominal terms, as historically nominal bond yields have followed nominal GDP growth. The divergence of yields in recent years from what domestic fundamentals suggest reflects the low level of yields globally and the anchoring of cash yields at 1.75% by the RBNZ (Figure 10). To the extent we have indeed reached a tipping point for global growth and inflation, then bond yields in New Zealand remain at risk given their recent correlation with global yields. We continue to advise investors to be underweight duration by holding a mix of bonds and cash. Because of the risks facing the NZ economy from the housing market, holding some fixed income remains prudent.

FIGURE 10 GLOBAL GOVERNMENT BOND YIELDS
31 December 2006 – 31 December 2017 • Percent (%)
Sources: Bloomberg L.P., Citigroup Global Markets, Reserve Bank of New Zealand, and Thomson Reuters Datastream.
We find global fixed income even more unattractive, with the Citigroup World Government Bond Index yielding a measly 1.20%. While hedging adds a modest level of extra yield, we see the risk-reward trade-off for global bonds as worse than NZ bonds, especially with the higher duration of European and Japanese bonds today given near-zero yields.
In general, we find most global fixed income segments unattractive. Credit spreads are below historical median for most sectors. Some relative value can be found in leveraged loans and structured credit funds in the United States. Private credit strategies have seen an influx of capital, and are also starting to appear frothy in the United States and Europe. While higher risk, private credit/special situation funds in Asia still offer compelling opportunities for those willing to take liquidity risk. There are also select opportunities in Australia to providing private credit to real estate–related investments, as a result of the recent restrictions placed on domestic banks by the RBA.
Conclusion
The positive momentum underpinning the global economy looks set to continue in 2018. However, unlike last year, continued growth may see inflation start to rise back to normal levels across developed markets. This should drive both policy rates and bond yields higher. Although rising rates alone will not derail the global economy, they could trigger a rise in market volatility.
For New Zealand, the risk from rising rates is potentially higher than elsewhere, as new government policies may be more inflationary than expected, with rising rates putting an overvalued housing market under extra pressure right when foreign demand is being restricted.
Ultimately, we judge the risks to the outlook as balanced, and advise investors to remain neutral despite the growing bullishness of the consensus. Indeed, an alternative narrative of a ‘melt-up’ in global equities is circulating. This sees the long-awaited rotation from bonds into equities as investor pessimism finally gives way to optimism. Such an outcome is possible, however, we advise investors not to blindly chase markets higher.
We remain neutral on equities, favouring non-US and EM over US and NZ equities. We suggest remaining underweight duration and credit in fixed income portfolios given the risk of rising rates, while exploring select opportunities in more illiquid strategies. Finally, we suggest investors remain partially unhedged to protect against downward pressure on the NZ dollar.
Aaron Costello, Managing Director
Han Xu, Investment Associate
Index Disclosures
ANZ Commodity Price Index – Dairy Products
The ANZ Commodity Price Index – Dairy Products is a component index of the ANZ Commodity Price Index, which is a monthly report that tracks the movement in the prices received for New Zealand’s main export categories, in both world prices and NZ dollars.
Bloomberg NZBond Government 0+Y Index
The Bloomberg NZBond Govt 0+ Yr Index is engineered to measure the market of securities issued by the New Zealand government. It is a rules-based, market value weighted index which includes bonds maturing in 0+ years.
Citigroup World Government Bond Index
The Citigroup World Government Bond Index is composed of issues of the government bond markets of the United States, Japan, Germany, France, the United Kingdom, Canada, Italy, Australia, Belgium, Denmark, the Netherlands, Spain, Sweden, and Austria, and measures total return performance for government bond markets with a remaining maturity of at least one year.
MSCI AC (All Country) Asia ex Japan Index
The MSCI AC (All Country) Asia ex Japan Index is a free float–adjusted, market capitalisation–weighted index that is designed to measure the equity market performance of Asia, excluding Japan. The MSCI AC Asia ex Japan Index consists of the following ten developed and emerging markets country indexes: China, Hong Kong, India, Indonesia, Korea, Malaysia, Philippines, Singapore, Taiwan, and Thailand. It covers approximately 85% of the free float–adjusted market capitalisation in each country.
MSCI Australia Index
The MSCI Australia Index is a free float–adjusted, market capitalisation–weighted index designed to measure large- and mid-cap equity market performance of Australia. The index covers approximately 85% of the free float–adjusted market capitalisation in Australia.
MSCI Emerging Markets Index
The MSCI Emerging Markets Index is a free float–adjusted, market capitalisation–weighted index designed to measure large and mid-cap equity market performance of emerging markets. As of January 2016, the index includes 23 emerging markets country indexes: Brazil, Chile, China, Colombia, Czech Republic, Egypt, Greece, Hungary, India, Indonesia, Korea, Malaysia, Mexico, Peru, the Philippines, Poland, Qatar, Russia, South Africa, Taiwan, Thailand, Turkey, and the United Arab Emirates. The index covers approximately 85% of the free float–adjusted market capitalisation in each country.
MSCI Europe ex UK Index
The MSCI Europe ex UK Index captures large- and mid-cap equity market performance across 14 developed markets countries in Europe. The country indexes included are: Austria, Belgium, Denmark, Finland, France, Germany, Ireland, Italy, the Netherlands, Norway, Portugal, Spain, Sweden, and Switzerland. The index covers approximately 85% of the free float–adjusted market capitalisation of European developed markets, excluding the United Kingdom.
MSCI Japan Index
The MSCI Japan Index is a free float–adjusted, market capitalisation–weighted index that is designed to measure the large- and mid-cap equity market performance of Japan. The index covers 85% of the free float–adjusted market capitalisation in Japan.
MSCI New Zealand IMI Index
The MSCI New Zealand Investable Market Index (IMI) is designed to measure the performance of the large-, mid-, and small-cap segments of the New Zealand market. The index covers approximately 99% of the free float–adjusted market capitalisation in New Zealand.
MSCI UK Index
The MSCI UK Index is a free float–adjusted, market capitalisation–weighted index that is designed to measure the large- and mid-cap equity market performance of the United Kingdom; the index covers 85% of the free float–adjusted market capitalisation in the United Kingdom.
MSCI US Index
The MSCI US Index is a free float–adjusted, market capitalisation–weighted index that is designed to measure the large- and mid-cap equity market performance of the United States. The index covers approximately 85% of the free float–adjusted market capitalisation in the United States.
MSCI World Index
The MSCI World Index represents a free float–adjusted, market capitalisation–weighted index that is designed to measure the performance of the large- and mid-cap segments of developed markets. As of December 2017, it includes 23 developed market country indexes: Australia, Austria, Belgium, Canada, Denmark, Finland, France, Germany, Hong Kong, Ireland, Israel, Italy, Japan, Netherlands, New Zealand, Norway, Portugal, Singapore, Spain, Sweden, Switzerland, the United Kingdom, and the United States. The index covers approximately 85% of the free float-adjusted market capitalisation in each country.
RBNZ QV Quarterly House Price Index
The RBNZ QV Quarterly House Price Index measures the movement in house prices for local council areas throughout New Zealand, providing an indicator of capital growth and how prices are trending in an area.
S&P/ASX 200 Index
The S&P/ASX 200 Index is a free float–adjusted, market capitalisation–weighted equity index that covers 80% of market capitalisation in Australia available to domestic investors.
S&P/NZX Bank Bills 90-Day Index
The S&P/NZX Bank Bills 90-Day Index is designed to measure the performance of a portfolio of bank bills with a maturity of 31 to 90 days.
S&P/NZX 50 Gross Index
The S&P/NZX 50 Gross Index is designed to measure the performance of the 50 largest, eligible stocks listed on the Main Board (NZSX) of the NZX by float-adjusted market capitalisation, covering approximately 90% of NZ equity market capitalisation.
Footnotes