Investors should be prepared for 2016 to look similar to 2015, with high volatility and poor returns for global risk assets
- Risks to the global economy are rising, but the New Zealand economy is relatively well placed compared to others, with many of the risks external in nature. The Reserve Bank of New Zealand has communicated its preference to use a weak NZ dollar to support the economy, while volatility in global markets and lingering overvaluation keep us negative on the currency versus the US dollar.
- We are neutral on NZ equities on an absolute and relative basis. The market is generally defensive, but NZ equities look relatively expensive and will lag global markets when the cycle turns. With respect to equity allocations outside of New Zealand, we uphold our advice to overweight Eurozone and Japanese equities and hold a small overweight to Asia ex Japan equities.
- Continuing to hold some NZ government bonds makes sense. Although they are slightly overvalued, domestic yields are more attractive than other developed markets, and inflation risks are low.
Markets were volatile in 2015, dominated by themes of a strong US dollar, weak commodity prices, nervousness over China, and anxiety over when the US Federal Reserve would raise rates. This year seems to be more of the same—market action in the first weeks of 2016 is eerily similar to that of mid-August when weakness in Chinese equities and the renminbi shook global markets, and the price of oil continues to plummet.
See Aaron Costello and Jason Widjaja, “New Zealand Outlook 2015: Can the Divergence Last?,” Cambridge Associates Research Note, February 2015.
The generally positive domestic outlook for New Zealand stands in contrast to the fraught global outlook and partly explains the relative outperformance of NZ assets last year. We expect 2016 to be similar to 2015, with global markets buffeted by macro concerns, resulting in lackluster returns for investors amid rising volatility and weak global growth. Given that our base case is not for a full-fledged crisis in China or a recession in the United States, we discourage investors from drastically de-risking portfolios and instead advise remaining levelheaded. We expect the NZ dollar to continue to weaken, bond and cash yields to remain low, and doubt NZ equities can repeat last year’s outperformance—yet New Zealand should continue to weather rising global risks relatively well. All in all, our views are little changed from last year.
Markets remain in flux, and depending on how sharp drawdowns are in 2016, attractive buying opportunities for global equities may present themselves, especially distressed assets in the global commodity and energy space. Until then, NZ investors should hold steady and be prepared for another volatile year.
Macro: Risks Are Rising
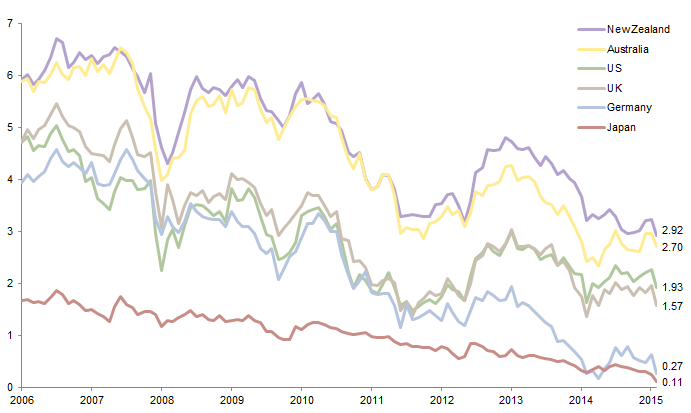
The slowdown in the NZ economy over 2015 was somewhat expected given global headwinds and weak dairy prices. However, recent economic data have surprised to the upside, with the net result that consensus forecasts in January expect GDP growth to accelerate from 2.0% to 2.5% in 2016 and inflation to rise modestly from 0.1% to 1.4%. The consensus also expects the Reserve Bank of New Zealand (RBNZ) to continue on hold and bond yields to remain at 3.6% (Figure 1). While ongoing market turmoil means all of these forecasts are being revised, the basic narrative still holds that domestic conditions in New Zealand are positive; global factors are what will weigh most heavily on the economy.
Source: Bloomberg L.P.
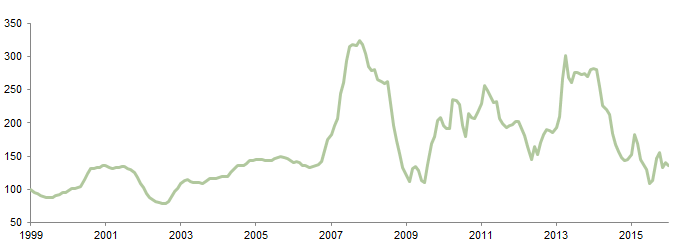
Even so, some domestic issues are worth watching. The first issue is the agriculture sector, which has been hit by the continued fall in dairy prices, and has also been faced with the risk of drought conditions from El Niño. While the latter risk seems to have subsided for now, the former remains, with dairy prices falling at recent auctions (Figure 2). A pull-back in dairy and agriculture production is already underway and will result in further reductions in farm incomes. Still, strong tourist numbers (boosted by the fall in the NZ dollar), improving labor markets, ongoing net immigration, and continued construction spending are offsetting these headwinds.
Sources: Global Dairy Trade and Thomson Reuters Datastream.
The second issue is the housing market, which the RBNZ has flagged several times recently as a risk to “macro stability.” Real house prices rose 14.6% year-over-year in third quarter 2015 (Figure 3), and while recent data indicate that prices in Auckland have moderated, the real estate market remains frothy. This complicates monetary policy, as the RBNZ will be reluctant to cut interest rates and potentially reignite the market and increase household leverage. Yet raising rates at this juncture to cool the market might weigh heavily on the economy and consumers at a time when the agriculture sector is under pressure. This implies the RBNZ will continue to use “macro-prudential measures,” such as tightening loan-to-value restrictions, to cool the housing market. For now the RBNZ is likely to remain on hold, signaling that despite concerns about the global outlook, domestic conditions in New Zealand do not require lower rates. At the same time, with various measures of inflation below the 1%–3% target range, there is no need to hike rates in the intermediate term.
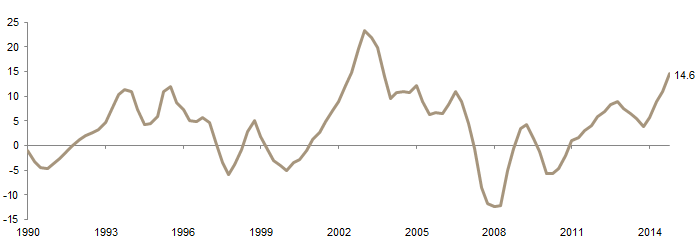
Figure 3. New Zealand Real House Prices
Fourth Quarter 1990 – Third Quarter 2015 • Year-over-Year Percent (%) Change
Source: Thomson Reuters Datastream.
For more on China’s currency and the choices facing the PBOC, please see Aaron Costello, “RMB Risks,” Cambridge Associates Research Brief, February 5, 2016.
Meanwhile, the global backdrop is challenging. In our view, China is already experiencing a “hard landing” on the industrial side of the economy, which only grew 0.9% in nominal terms in 2015, down from 20% as recently as 2011. While the service sector is growing at a relatively robust 10%, this part of the economy will also weaken in 2016, due in part to weak corporate profits, which will feed into lower wages and ultimately lower consumption. Thus, we continue to expect weaker economic data out of China, as well as a weaker renminbi, which may rattle markets. While we anticipate that growth in China will continue to slow, we are not yet of the view that a financial crisis is set to occur, given the semi-closed nature of the banking system and ample room for the People’s Bank of China (PBOC) to lower rates and inject liquidity. However, stemming the flow of capital flight out of China is key for the PBOC, which means increased capital controls are needed. Failure to stem the tide of outflows raises the risk of crisis in China and needs to be watched carefully.
Regarding the US and other major developed economies, underlying economic data allow for cautious optimism. While the manufacturing sector everywhere is taking a hit from weak global trade and falling commodity production, the service sector has held up well and banks appear to be lending again for the first time in many years. The bull case centers around consumers spending the windfall from lower energy prices instead of saving it. This is particularly the case in the United States, as wages are expected to rise amid a tightening labor market, but also applies to other parts of the world, including New Zealand.
That said, household spending and savings decisions are typically driven by consumer confidence. The developed world faces the risk that the rise in financial market uncertainty may cause both businesses and consumers to continue to pull back. A variable worth watching is whether defaults among energy- and commodity-related borrowers cause credit markets to tighten up, further slowing growth.
In some respects, the current turbulence affecting global markets is similar to what struck in 2011, when markets became too complacent about signs of stalling growth momentum and were shocked back into reality by headlines about macro risks from a Eurozone break-up and a US debt downgrade. After a sharp decline of nearly 20%, markets were able to recover, with the help of easy monetary policy from global central banks. Today, substitute China for the Eurozone, and energy companies for the US debt downgrade.
This time around, central banks will be more hesitant to pull the monetary trigger, as they are running low on bullets. But at a minimum, concerns about potential monetary tightening in 2016 are likely off the table. If China can avoid a financial crisis, and trouble in energy doesn’t spill over to broader credit markets, the major developed markets economies should be able to avoid a recession, and global markets should post a recovery in 2016. Much hinges on how quickly investor and consumer confidence is restored.
New Zealand Dollar: More Weakness Ahead
Given this backdrop, we expect continued volatility and weakness in the NZ dollar. The kiwi fell 12% last year versus the US dollar; only the oil-exposed Canadian dollar performed worse among developed markets currencies. The NZ dollar tumbled again in January, reaching NZD/USD 0.64 at one point in the month. Bloomberg consensus estimates are for the currency to end 2016 at 0.62, albeit with a potential range between 0.74 and 0.56 (Figure 4).
Sources: Bloomberg L.P., MSCI Inc., and Thomson Reuters Datastream. MSCI data provided “as is” without any express or implied warranties.
While we do not make explicit currency forecasts, we continue to see more downside for the NZ dollar. First, from a long-term valuation stand-point, the currency is still expensive (Figure 4). Second, we expect continued weakness in the renminbi and lingering China concerns to weigh on the NZ dollar. At the same time, the RBNZ views weakness in the currency as a key shock absorber for the economy, helping to boost tourism and offset the fall in commodity prices. Thus, weakness in the NZ dollar will not pressure the RBNZ to hike rates in the near term.
A large rally in the currency cannot be ruled out should global risk appetite turn positive, which would result in a flat currency this year. However, we are still structurally negative on the NZ dollar, as the currency remains overvalued. Thus, we continue to advise NZD-based investors to remain partially unhedged, especially versus the US dollar. Trying to time currency markets almost always increases risks to port-folios, and investors should resist the temptation to abandon currency hedges altogether.
Please see Jason Widjaja and Aaron Costello, “Australia Outlook 2016: Déjà Vu All Over Again . . . ,” Cambridge Associates Research Note, January 2016.
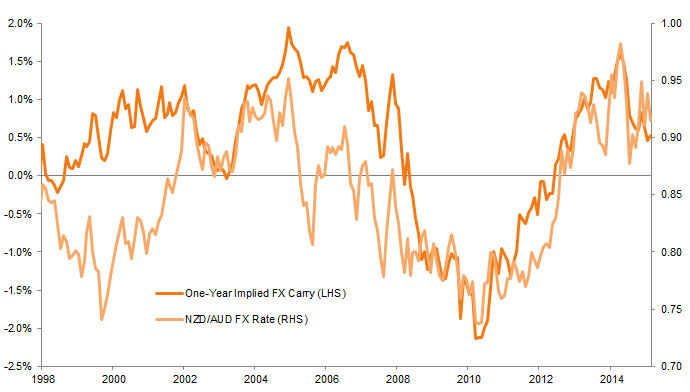
What about the NZD/AUD exchange rate? In last year’s outlook, we speculated that the NZ dollar would reach parity with the Australian dollar at some point given the stronger headwinds facing Australia. Parity nearly happened in early April 2015, but proved fleeting as the NZ dollar fell to 0.88 at one point in 2015 before rebounding to 0.94 to end the year (Figure 5). In the first weeks of 2016, the NZ dollar has been weak versus the Australian dollar. Relative interest rates tend to drive the NZD/AUD rate, with last year’s rise to near-parity driven by a view that the RBNZ would continue to hike, while the Reserve Bank of Australia (RBA) would cut. In the end, both banks cut rates, which drove the reversal in the NZ dollar. With a slim yield spread for the NZ dollar over the Australian dollar and the RBNZ unlikely to hike rates, we expect the NZD/AUD to stay within its current range. The NZ dollar will only weaken sharply versus the Australian dollar if the RBA begins hiking rates ahead of the RBNZ, which we consider unlikely in the near term, given the greater risks to the Australian economy today.
Source: Thomson Reuters Datastream.
New Zealand Equities: Will the Outperformance Continue?
NZ equities performed well in 2015, with the NZX 50 up 8.5% in price terms and returning 13.6% thanks to a 4%+ dividend yield. This return meant NZ equities outperformed all other major developed markets in local currency terms (Figure 6).

Figure 6. New Zealand and Global Equity Performance: Calendar Year 2015
Total Return (%) • Local Currency Terms
Sources: Australian Stock Exchange, MSCI Inc., New Zealand Exchange, Standard and Poor’s, and Thomson Reuters Datastream. MSCI data provided “as is” without any express or implied warranties.
Note: Total returns are gross of dividend taxes.
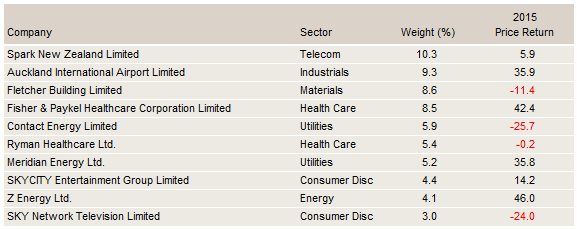
Gains were concentrated in the final quarter of the year and seemed to be driven by company-specific factors. For instance, the best performer among the top ten stocks by market-cap weight in the NZX50 was Z Energy, up 46% in price terms (Figure 7), as the petrol distributor acquired rival Caltrex (and perhaps lower petrol prices will boost demand). Fisher & Paykel Healthcare performed second best of the top ten, with a 42% price return, yet fellow health care top ten stock Ryman was flat. Among utilities in the top ten stocks, Meridian Energy rose 36%, but Contact Energy fell 26%. Sky City Entertainment gained 14%, while Sky TV fell 24%. The largest NZ-listed company, telecom Spark New Zealand Limited, had a more prosaic 6% rise.
Sources: FactSet Research Systems and MSCI Inc. MSCI data provided “as is” without any express or implied warranties.
Notes: Constituents are as of 31 December 2015; top ten determined by market cap weighting.
Every year sees winners and losers in the market, but this disparate performance makes it hard to identify a clear theme for NZ equities in 2015. The ongoing outperformance of NZ equities relative to global peers may be because the NZ stock market is light on commodity producers (which have suffered globally) and is titled toward higher-yielding stocks, such as utilities and infrastructure, which have been popular and benefit from low interest rates. The market is also light on financial stocks, which have lagged globally as well. Given the weakness in the NZ dollar, companies with offshore revenue (like Fisher & Paykel) have also done well.
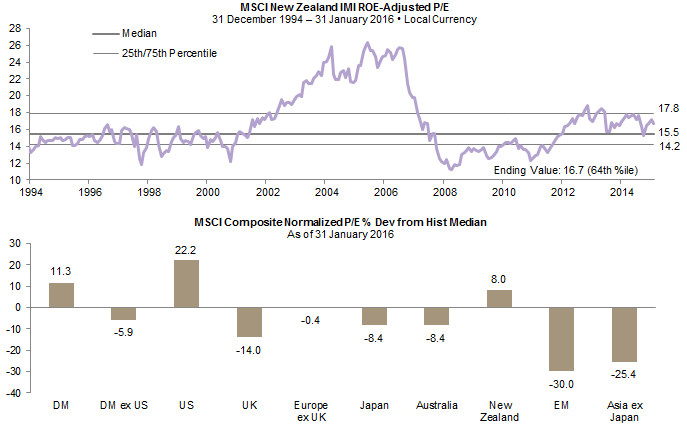
As a result of strong performance, New Zealand is now one of the most expensive markets globally relative to its own history. While we still view NZ equities as fairly valued in absolute terms, with the return on equity–adjusted price-earnings ratio only 8.0% above its historical median, every other market we track, save US and broad developed markets equities, trades at below-average valuations (Figure 8).
Sources: MSCI Inc. and Thomson Reuters Datastream. MSCI data provided “as is” without any express or implied warranties.
Notes: The composite normalized price-earnings (P/E) ratio is calculated by dividing the inflation-adjusted index price by the simple average of three normalized earnings metrics: ten-year average real earnings (i.e., Shiller earnings), trend-line earnings, and return on equity–adjusted earnings. All data are monthly.
Last year, we recommended New Zealand investors remain neutral on NZ equities, while tilting global allocations away from Australia and the United States and toward Eurozone and Japan. We further advised considering modest overweights to emerging markets equities, with a preference for Asia ex Japan equities. These tilts largely paid off, especially underweighting Australian and US equities in favor of Eurozone and Japanese equities. Although emerging markets equity exposure was a drag, Asian equities did outperform broader emerging markets, especially once adjusted for currency movements.[1]In NZD terms, emerging markets equities returned -2.5% compared to 4.0% for the Asia ex Japan index.
Please see Sean McLaughlin and Wade O’Brien, “Outlook 2016: Do You Know Where Your Risk Tolerance Is?,” Cambridge Associates Research Report, December 2015.
For 2016, we retain these views. We remain neutral on NZ equities, recognizing that the market’s high dividend yield and sector composition will keep the market defensive in the current environment. However, these same factors will also cause NZ equities to underperform global markets when the cycle turns. Furthermore, holding non-NZ equities provides diversification, particularly on a partially unhedged basis. Rebalancing may be in order, especially with respect to Australian equities. Outside of New Zealand, modestly underweighting US equities in favor of non-US equities is attractive on valuation grounds, as are emerging markets equities, although such an exposure may not pay off in the near term.
New Zealand Government Bonds: Still One of the Best Yields on Offer
NZ government bonds returned 5.5% in 2015, outperforming global government bonds (1.3%) in local currency terms, thanks to 3%+ yields at the start of 2015. Government bond yields rallied in 2015 as the RBNZ cut rates by 100 bps to 2.5%, while low inflation and market turmoil in early 2016 have driven yields lower so far in 2016 (Figure 9).
Source: Thomson Reuters Datastream.
Although NZ government bonds look slightly overvalued at current levels, we think investors should maintain allocations. First, given macro risks, yields certainly have scope to move lower. As noted, a number of factors make it unlikely the RBNZ will raise rates this year, and the consensus sees the Fed holding this year as well. Even amid rising US rates, NZ bond yields could move lower should economic conditions warrant; in the late 1990s/early 2000s, NZ government bonds had only a 50 bp spread over US Treasuries compared to today’s spread of 100 bps.
NZ bonds could sell off sharply when negative investor sentiment reverses, an outcome that should see equities rally and thus overall portfolio return turn positive. In short, we are not concerned about bonds, and we would keep some mixture of cash and long-duration government bonds in the portfolio given our views on the macro environment and attractive yields relative to global bonds.
Conclusion
Rising macro risks make it hard to have conviction in the outlook for 2016. We suggest investors remain calm and be prepared to ride out another volatile year. The reality is that investors can neither know in real time whether a recession is at hand, nor necessarily profit from knowing so, if markets have already priced in the negative impacts.
The good news amid the early 2016 turmoil is that markets are increasingly priced for bad outcomes. The price of oil has fallen below US$30, while yields on US energy-related, high-yield bonds have reached 19.41%, effectively pricing in potential defaults to come. Global equities as a whole have fallen nearly 20% from their 2015 highs. While there may be further downside in asset prices in the near term, the quicker asset markets price in negative outcomes, the faster markets can recover should the worst-case scenario not unfold.
The NZ economy is relatively well placed compared to others, with many of the risks external in nature. The RBNZ has communicated its preference to use a weak NZ dollar to support the economy, while volatility in global markets and lingering overvaluation keep us negative on the currency versus the US dollar. However, investors should remain partially hedged to reduce behavioral currency risks.
We are neutral on NZ equities on an absolute and relative basis. The market is generally defensive, but NZ equities look relatively expensive and will lag global markets when the cycle turns. With respect to equity allocations outside of New Zealand, we uphold our advice to overweight Eurozone and Japanese equities and hold a small overweight to Asia ex Japan equities.
Continuing to hold some NZ government bonds makes sense. Although they are slightly overvalued, domestic yields are more attractive than other developed markets, and inflation risks are low.
Aaron Costello, Managing Director
Jason Widjaja, Associate Investment Director
Index Disclosures
Cambridge Associates does not provide stock selection recommendations, and any reference to specific companies is not to be interpreted as a recommendation of that company as an investment option.
Bloomberg 10-Year New Zealand Govt Bond Index
The Bloomberg 10-Year New Zealand Government Bond Index is part of Bloomberg’s AusBond and NZBond indexes family of benchmarks for the Australian and New Zealand debt markets. Rates for this index are composed of generic New Zealand government bonds. The yields are based on the mid side of the market and are updated at the end of day.
Global Dairy Trade Price Index
The Global Dairy Trade Price Index uses a weighted-average of the percentage changes in prices. GDT price indexes are used to avoid the bias of a simple weighted average price, and to give a more accurate reflection of the price movements between trading events.
MSCI All Country Asia ex Japan Index
The MSCI All Country (AC) Asia ex Japan Index is a free float–adjusted, market capitalization–weighted index that is designed to measure the equity market performance of Asia, excluding Japan. The MSCI AC Asia ex Japan Index consists of the following ten developed and emerging market country indexes: China, Hong Kong, India, Indonesia, Korea, Malaysia, the Philippines, Singapore, Taiwan, and Thailand.
MSCI Australia Index
The MSCI Australia Index is a free float–adjusted, market capitalization–weighted index that is designed to measure the equity market performance of Australia.
MSCI EASEA Index (also known as MSCI EAFE ex Japan)
The MSCI EASEA Index (also known as the MSCI EAFE ex Japan Index) is an equity index that captures large- and mid-cap representation across developed markets countries across the world, excluding Canada, Japan, and the United States. Developed markets countries include: Australia, Austria, Belgium, Denmark, Finland, France, Germany, Hong Kong, Ireland, Israel, Italy, the Netherlands, New Zealand, Norway, Portugal, Singapore, Spain, Sweden, Switzerland, and the United Kingdom.
MSCI Emerging Markets Index
The MSCI Emerging Markets Index represents a free float–adjusted, market-capitalization index that is designed to measure equity market performance of emerging markets. As of January 2016, the index includes 23 emerging markets country indexes: Brazil, Chile, China, Colombia, Czech Republic, Egypt, Greece, Hungary, India, Indonesia, Korea, Malaysia, Mexico, Peru, the Philippines, Poland, Russia, Qatar, South Africa, Taiwan, Thailand, Turkey, and United Arab Emirates.
MSCI Europe ex UK Index
The MSCI Europe ex UK Index captures large- and mid-cap representation across 14 developed markets countries in Europe. With 330 constituents, the index covers approximately 85% of the free float–adjusted market capitalization across European developed markets excluding the United Kingdom.
MSCI Japan Index
The MSCI Japan Index is a free float–adjusted, market capitalization–weighted index that is designed to measure the equity market performance of Japan.
MSCI New Zealand IMI Index
The MSCI New Zealand Investable Market Index (IMI) is designed to measure the performance of the large-, mid-, and small-cap segments of the New Zealand market. With 29 constituents, the index covers approximately 99% of the free float–adjusted market capitalization in New Zealand.
MSCI UK Index
The MSCI UK Index is designed to measure the performance of the large- and mid-cap segments of the UK market.
MSCI US Index
The MSCI US Index is designed to measure the performance of the large- and mid-cap segments of the US market. With 617 constituents, the index covers approximately 85% of the free float–adjusted market capitalization in the United States.
MSCI World Index
The MSCI World Index captures large- and mid-cap representation across 23 developed markets countries: Australia, Austria, Belgium, Canada, Denmark, Finland, France, Germany, Hong Kong, Ireland, Israel, Italy, Japan, the Netherlands, New Zealand, Norway, Portugal, Singapore, Spain, Sweden, Switzerland, the United Kingdom, and the United States.
MSCI World ex Japan Index (also known as the MSCI Kokusai Index)
The MSCI World ex Japan Index captures large- and mid-cap representation across 22 of 23 developed markets countries (excluding Japan). The developed markets countries in the index include: Australia, Austria, Belgium, Canada, Denmark, Finland, France, Germany, Hong Kong, Ireland, Israel, Italy, the Netherlands, New Zealand, Norway, Portugal, Singapore, Spain, Sweden, Switzerland, the United Kingdom, and the United States.
S&P/ASX 200 Index
The S&P/ASX 200 is recognized as the institutional investable benchmark in Australia. The index covers approximately 80% of Australian equity market capitalization. Index constituents are drawn from eligible companies listed on the Australian Securities Exchange. The S&P/ASX 200 is a highly liquid and investible index, designed to address investment managers’ needs to benchmark against a portfolio characterized by sufficient size and liquidity.
S&P/ASX 50 Index
The S&P/ASX 50 represents the large cap universe for the Australian equity market, and is comprised of the 50 largest stocks by float-adjusted market capitalization. The S&P/ASX 50 represents approximately 63% of Australian equity market capitalization.
Footnotes

