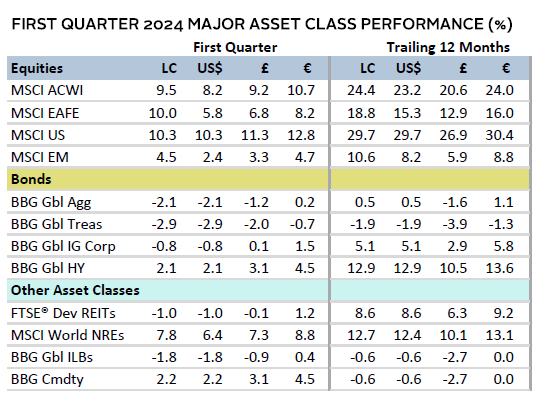
Equity markets posted strong returns in Q1. Developed markets (DM) outperformed emerging markets (EM), led by Japanese and US equities hitting new all-time highs. Europe ex UK equities posted robust returns as well, while UK equities lagged. Growth stocks yet again outpaced value, and large caps bested small caps. Fixed income assets mostly faltered as investors repriced the pace of central bank policy rate cuts, causing yields to inflect higher. Within bonds, high-yield (HY) corporates outperformed, posting positive returns. Commodities generally gained, with supply/demand dynamics supporting a recovery in oil and industrial metals prices. The US dollar and UK sterling broadly gained, the euro was mixed, and the yen hit a multi-decade low.
Sources: Bloomberg Index Services Limited, Bloomberg L.P., EPRA, FTSE International Limited, MSCI Inc., National Association of Real Estate Investment Trusts, and Thomson Reuters Datastream. MSCI data provided “as is” without any express or implied warranties.
Note: Local currency returns for the Bloomberg fixed income indexes, the Bloomberg Commodity Index, and the FTSE® Developed REITs are in USD terms.
The Macro Picture
Q1 was marked by investors tempering their aggressive expectations for policy rate cuts in the United States to align with the Federal Reserve’s outlook for three 25-basis point (bp) cuts in 2024. Better-than-expected Q4 GDP growth and higher-than-anticipated inflation informed this repricing. As a result, yields moved higher in most DMs. The equity rally was fueled by Fed commentary that inflation was likely on trend to its target rate and by AI-related updates from mega-cap technology corporates.
Meanwhile, investors became more constructive on the Eurozone, which narrowly avoided a technical recession in 2023, and data confirmed that policy transmission had been effective in taming inflation down to 2.6% year-over-year (YOY). While the European Central Bank (ECB) is expected to remain data-dependent on policy pivots, expectations have firmed for a rate cut in June. Encouragingly, composite PMIs reached a nine-month high in March. While both the United Kingdom and Japan saw weak GDP growth in Q4 2023, their central bank policy responses were different. The Bank of England (BOE) was encouraged by the progress on inflation, with market expectations of a rate cut later this year. The Bank of Japan (BOJ), however, marked the end of an era—it raised its policy rate to 0.1% from -0.1% as inflation trended higher, signs of stronger wage growth emerged, and the yen continued to depreciate.
In China, industrial production recovered, tourism spending during the Lunar New Year exceeded expectations, and modest stimulus efforts by the government to support the property sector helped fuel a nascent recovery in equities. Premier Li Qiang called for “pragmatic and forceful” action to boost investor confidence, while authorities set an ambitious growth target for 2024, suggesting additional policy support on the horizon.
Equities
US equities outperformed broad DM equities and hit new all-time highs during the quarter. Growth and large-cap stocks outperformed their value and small-cap counterparts overall but lagged during March. Quarterly gains were enjoyed more broadly across the index than in Q4 2023, with five of the top ten contributors to return representing sectors other than information technology and communication services. In fact, even as Nvidia’s share price advanced by 82% in Q1, three of the Magnificent Seven stocks underperformed the broader US index. Sector level performance reflected this change in leadership as energy and utilities outperformed in March, after having lagged much of the quarter.
Investors became optimistic that a soft landing was achievable, given a slew of robust economic updates. Q4 2023 GDP growth beat expectations and was revised higher during Q1. Composite PMI remained in expansionary territory as manufacturing rebounded to a 19-month high in February, while preliminary data suggested services hit a three-month low in March. The labor market saw some cooling over the quarter, with wage growth slowing and the unemployment rate increasing to the highest since January 2022. Hotter-than-expected inflation led investors to lower expectations for the magnitude of rate cuts in 2024, driving yields higher. Despite the stronger data, the Fed left its policy rate unchanged, and commentary reinforced the odds for a rate cut in June. Chairman Jerome Powell added that the Fed’s policy has put downward pressure on economic activity and inflation, and its policy rate was likely at its peak for this tightening cycle. Still, the Fed raised its real GDP growth projections for the next three years and inflation expectations for 2024 in its latest Summary of Economic Projections (SEP).
European equities lagged broader DM equities as UK equities underperformed. Europe ex UK stocks were nearly on par with broader DM counterparts.
Europe ex UK equities posted robust gains in Q1 as investors assessed that the worst of the recently weak economic environment was behind them. Having seen solid progress on taming inflation, the ECB lowered its inflation rate outlook for 2024 by 40 bps to 2.3%. While the central bank has held its policy rate steady this year, market expectations suggest a rate cut in June. Equities rallied on a more dovish tone from the central bank, a better-than-expected earnings season, and signs that the economy may be bottoming out. The latest flash PMI data signaling a stabilization in business activity supported this view. Consumer discretionary was among the leading sectors this quarter, but some luxury brands suffered in March as earnings reports revealed poor demand from China. Expectations of lower rates also boosted the real estate sector in March. Elsewhere in Europe, Switzerland surprised markets as the first major developed economy to cut rates, while Sweden signaled a cut may be nearing.
Despite the lackluster quarterly performance, UK equities gained momentum in March with inflation slowing materially below 4%. As a result, in its latest policy update, more hawkish members of the BOE no longer voted to hike rates further. However, the BOE commented that policy could remain restrictive even as it cuts rates, increasing odds that a rate cut could come sooner than August. While the economy entered a technical recession in Q4 2023, January GDP expanded by 0.2% month-over-month (MOM) and PMI data suggested a continuing expansion of the services sector alongside stabilization in manufacturing, all of which improved investor sentiment.
Japanese equities outperformed DM equities in both local currency and USD terms, reaching new all-time highs for the first time in 34 years. Q4 2023 GDP growth was revised higher, revealing the economy narrowly avoided a technical recession. PMI data became expansionary, driven by services activity rising to a ten-month high. The quarter was punctuated by the BOJ abandoning its era of negative policy rates after eight years, raising it to 0.1%. It concurrently halted its policy of unconventional asset purchases. Stronger-than-expected results from wage negotiations helped inform the BOJ’s policy pivot, as it added support to the thesis that inflation could remain sustainably around its target levels. Subsequently, data revealed inflation reaccelerated to 2.8% YOY in February, leading some market participants to anticipate further rate hikes. However, Governor Kazuo Ueda stated that conditions would remain accommodative, pushing the yen lower. The currency depreciated to levels not seen since 1990; levels at which the government has previously intervened.
Pacific ex Japan equities lagged broader DM equities in Q1. Australian equities led, while Hong Kong lagged materially. The latter was unable to extend February’s rally on news of government support for the ailing Chinese property sector. Australia’s central bank held its policy rate steady, citing that inflation remained high despite recent cooling. It highlighted concerns about the tight labor market and persistent excess demand. However, February’s inflation rate came in below expectations, easing concerns on the prospect of future rate hikes. The Reserve Bank of New Zealand lowered its 2024 inflation and GDP growth forecasts, while keeping rates steady at 5.5% in February as Q4 GDP data revealed that the economy had entered a technical recession for the second time in the last year.
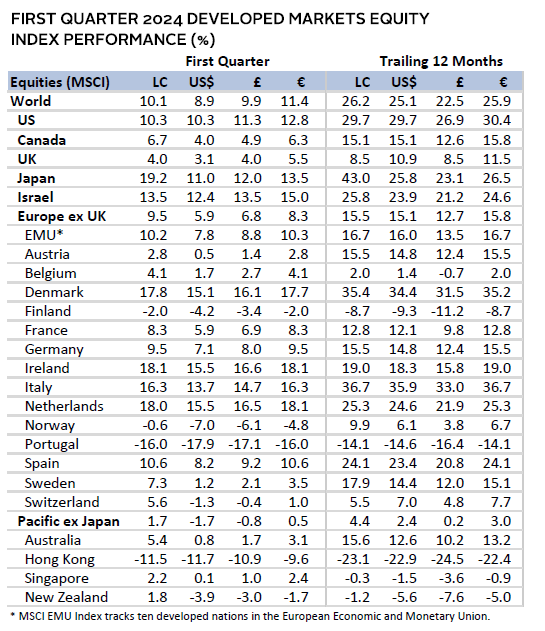
Sources: MSCI Inc. and Thomson Reuters Datastream. MSCI data provided “as is” without any express or implied warranties.
Emerging markets equities lagged DM equities. EM Asia led among major regions, while Latin American equities lagged the most. Semiconductor-heavy Taiwan and Korea outperformed within Asia, even as the Taiwanese central bank surprised markets with a policy rate hike and said it did not see room for rate cuts soon. Meanwhile, Korean exports climbed throughout Q1 due to a sharp increase in semiconductor demand; however, business sentiment remained deeply negative. The Indian economy posted the fastest growth in six quarters, as Q4 2023 GDP expanded by 8.4%, above expectations. Its central bank is expected to hold rates steady, cautious of cutting too soon as inflation remained steady in February at 5.1% YOY. In Latin America, Brazil’s central bank cut its policy rate by a further 50 bps, while raising its 2024 growth outlook. Banco de México made its first rate cut since 2021 but said it would remain data-dependent to determine the pace of easing.
Chinese equities could not hold the positive price momentum from February into March and lagged broad EM markets in Q1. The government introduced a series of modest stimulus packages to support the property sector, stabilize the stock market, and instill confidence in the economy’s ability to grow at the stated target of around 5%. Economic data trended positive, with industrial output increasing by 7% and industrial profits up by 10% in the first two months of 2024. Exports and retail sales also posted strong growth over the same period. March’s manufacturing PMI data suggested that activity expanded for the first time in six months, exceeding expectations, and reaching the fastest pace of expansion in 12 months. Investors were encouraged as domestic tourism jumped 19% from 2019 levels during the Lunar New Year holiday.
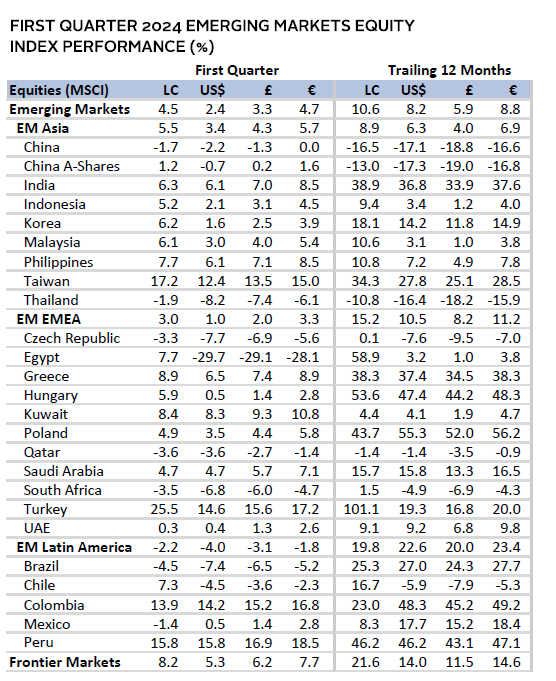
Sources: MSCI Inc. and Thomson Reuters Datastream. MSCI data provided “as is” without any express or implied warranties.
Fixed Income
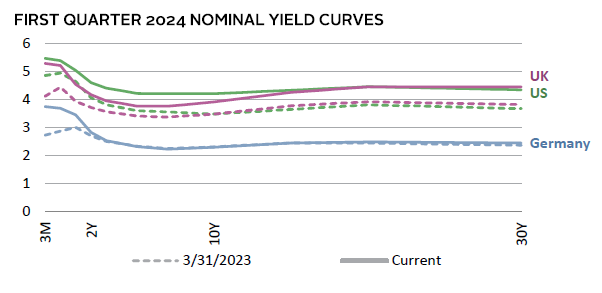
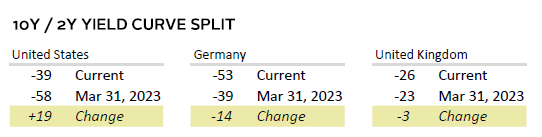
US fixed income assets mostly declined, reversing course from the stellar Q4 returns. Investors repriced the timing and magnitude of policy rate cuts to align with the Fed’s guidance on stronger-than-expected inflation. Market expectations converged near the Fed’s latest forecast of 75 bps of cuts in 2024. Yields were higher across the curve, and with the two-year yield rising slightly more than the ten-year, the curve moderately inverted further. Lower duration HY corporate bonds outperformed their investment-grade (IG) counterparts. Spreads for HY bonds declined by 156 bps YOY, whereas yields for IG corporate bonds slightly expanded by 13 bps.
European government bonds also faltered, but corporate IG and HY bonds were positive, with the latter outperforming. The German yield curve inverted further with the two-year bund yields rising more than the ten-year, reflecting investor concerns about the country’s weakening economic backdrop. UK fixed income assets were mixed, with corporate IG and HY bonds leading. Investors drove yields higher despite news of the economy entering a technical recession in Q4 2023 and core inflation coming in lower than expected. Although yields fell toward the end of the quarter, reflecting optimism from the BOE on the inflation outlook, the gilt yield curve became more inverted in Q1.
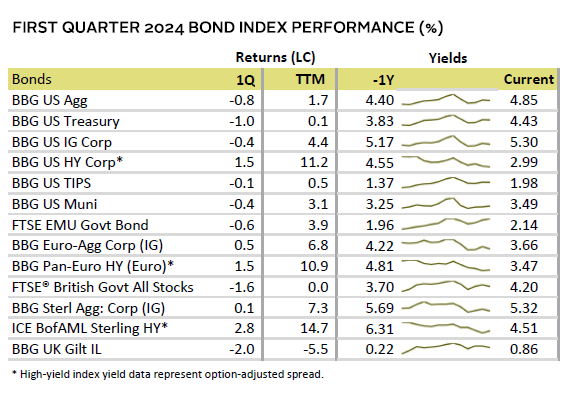
Sources: Bank of England, Bloomberg Index Services Limited, Federal Reserve, FTSE Fixed Income LLC, FTSE International Limited, Intercontinental Exchange, Inc., and Thomson Reuters Datastream.
Real Assets
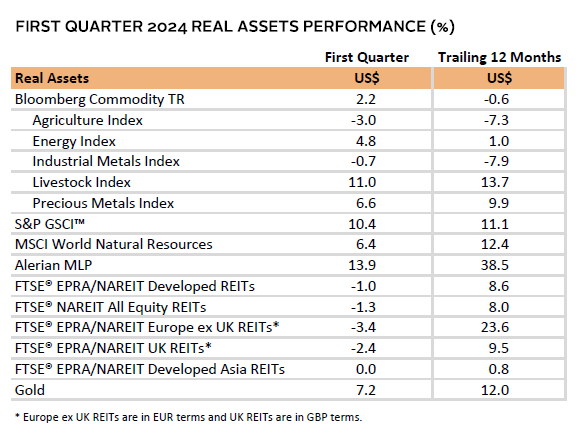
Real assets performance was mostly positive in Q1, as markets became constructive on the energy and metals supply/demand outlook. Metals prices were boosted by stronger-than-expected Chinese industrial production late in Q1. This, combined with higher oil prices, helped commodity futures advance.
Oil prices ($87.48 for Brent and $83.17 for WTI) recovered in Q1 with Brent prices staying above $80/barrel since early February. Shipping disruptions in the Red Sea and an Arctic freeze impacting production facilities in North America curbed supply, while improving economic data boosted demand expectations. The International Energy Agency changed its outlook to reflect prolonged production cuts by OPEC+, which could result in a supply deficit later in 2024.
Global natural resources equities performance was softer than broader equity markets but inflected positive late in Q1. Investor concerns about disappointing growth highlighted in the Q4 2023 earnings cycle were replaced by optimism vis-à-vis a more supportive supply/demand outlook.
REITs performance was weak, taking a breather from the stellar returns in late 2023. Bond yields pushed higher as investors pared down expectations of policy rate cuts in DMs, weighing on the interest rate–sensitive sector.
Gold prices ($2,214.30) shrugged off concerns from higher bond yields and posted another positive quarterly return, hitting new all-time highs in nominal terms. Prices were boosted by the outlook for rate cuts in most major DMs, ongoing geopolitical tensions, and increased buying from central banks, notably from China.
Sources: Alerian, Bloomberg L.P., EPRA, FTSE International Limited, Intercontinental Exchange, Inc., MSCI Inc., National Association of Real Estate Investment Trusts, Standard & Poor’s, and Thomson Reuters Datastream. MSCI data provided “as is” without any express or implied warranties.
Note: Gold performance based on spot price return.
USD-Based Investors
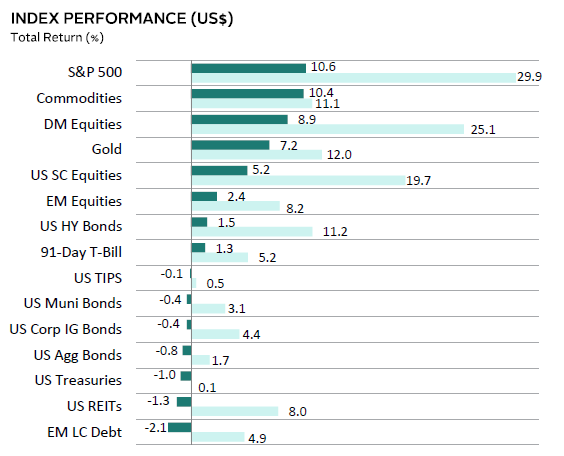
Risk assets were mixed in Q1. US equities led, touching new all-time highs on stronger-than-expected economic data and earnings, and continued AI-related enthusiasm. DM equities bested EM stocks, with China weighing on returns. Gold prices gained on strong central bank demand and ongoing geopolitical tensions. Commodities rebounded on improved supply/demand dynamics, driving prices for energy and metals higher. Yields expanded as investors delayed rate cut expectations on elevated inflation, resulting in fixed income assets and REITs lagging. Still, lower duration cash and HY bonds gained.
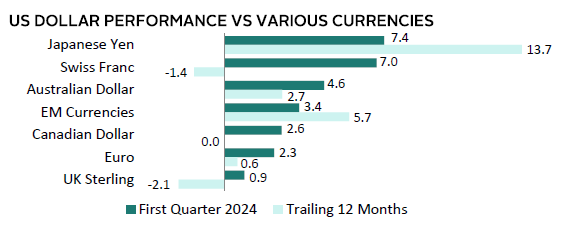
The US dollar broadly advanced as investors yet again delayed expectations for interest rate cuts by the Fed. This pushed yields higher, improving the interest rate differential to favor the US dollar. The greenback gained most versus the Japanese yen and Swiss franc among the major global currencies we track. Over the last 12 months, it only declined versus the Swiss franc and UK sterling.
Q4 2023 GDP growth beat expectations and was revised higher during Q1. Composite PMI remained in expansionary territory as manufacturing rebounded to a 19-month high in February, while data suggested services hit a three-month low in March. The labor market saw wage growth slowing and the unemployment rate increasing to the highest since January 2022. Hotter-than-expected inflation led investors to lower expectations for the magnitude of rate cuts in 2024, driving yields higher. Despite the stronger data, the Fed left its policy rate unchanged, and commentary reinforced the odds for a rate cut in June. Chairman Powell added that the Fed’s policy has put downward pressure on economic activity and inflation, and its policy rate was likely at its peak for this tightening cycle. Still, the Fed raised its real GDP growth projections for the next three years and inflation expectations for 2024 in its latest SEP.
Sources: Bloomberg Index Services Limited, FTSE International Limited, Frank Russell Company, Intercontinental Exchange, Inc., J.P. Morgan Securities, Inc., MSCI Inc., National Association of Real Estate Investment Trusts, Standard & Poor’s, and Thomson Reuters Datastream. MSCI data provided “as is” without any express or implied warranties.
EUR-Based Investors
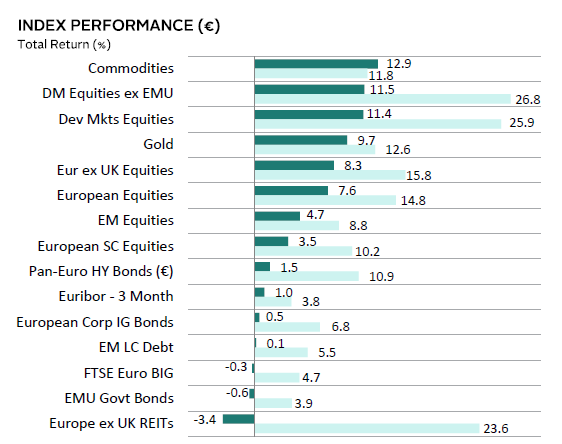
Risk assets were mostly positive in Q1. Commodities led as supply/demand dynamics became more supportive of higher prices for energy and metals. DM equities outperformed EM, led by strong performance from Japanese and US stocks. EM equities lagged due to poor relative returns in China. European equities rallied on the ECB’s more dovish tone, better-than-expected earnings season, and signs that the economy may be bottoming out. Gold gained on strong central bank demand and ongoing geopolitical tensions. Yields expanded as investors delayed rate cut expectations, resulting in fixed income assets and REITs lagging. Still, lower duration cash and HY bonds gained.
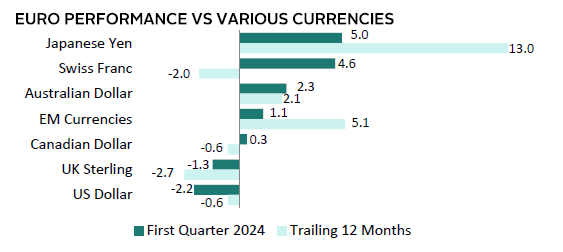
The euro was mixed, gaining the most versus the Japanese yen and Swiss franc, and declining vis-à-vis the US dollar and UK sterling among the major global currencies we track. Over the last 12 months, the euro was mixed as well, declining the most relative to the UK sterling.
The Eurozone economy avoided a recession in Q4, which surprised markets, given the bloc’s largest economy (Germany) had declined in Q4. The region was buoyed by growth from Spain and Italy. Having seen solid progress on taming inflation, the ECB lowered its inflation rate outlook for 2024 by 40 bps to 2.3%. This was particularly encouraging, since Europe is especially vulnerable to recent shipping disruptions in the Red Sea, as it relies heavily on the route for access to Asian imports and Middle Eastern oil. While the central bank has held its policy rate steady this year, market expectations suggest a rate cut in June. The latest flash PMI data signaling a stabilization in business activity supported this view. Elsewhere in Europe, Switzerland surprised markets as the first major developed economy to cut rates, while Sweden signaled a cut may be nearing.
Sources: Bloomberg Index Services Limited, EPRA, European Banking Federation, FTSE Fixed Income LLC, FTSE International Limited, Intercontinental Exchange, Inc., J.P. Morgan Securities, Inc., MSCI Inc., National Association of Real Estate Investment Trusts, Standard & Poor’s, and Thomson Reuters Datastream. MSCI data provided “as is” without any express or implied warranties.
GBP-Based Investors
Risk assets were mixed in Q1. Commodities led as supply/demand dynamics became more supportive of higher prices for energy and metals. DM equities outperformed EM, led by strong performance from Japanese and US stocks. EM equities lagged due to poor relative returns in China. UK equities lagged Europe ex UK counterparts, having entered a technical recession in Q4 2023. Gold gained on strong central bank demand and ongoing geopolitical tensions. Yields expanded as investors delayed rate cut expectations and UK inflation remained elevated relative to other DM regions, resulting in fixed income assets and REITs lagging. Still, lower duration cash and HY bonds gained.
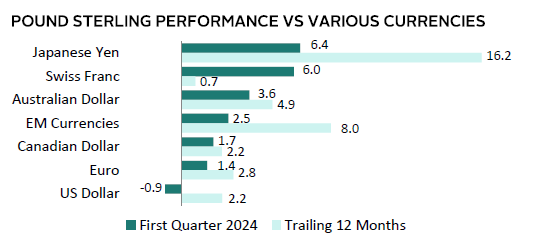
UK sterling was mostly positive, declining only versus the US dollar among the major global currencies we track. Over the last 12 months, the UK sterling strengthened across the board. Relatively tighter monetary policy has resulted in interest rate differentials supportive of the UK sterling.
Despite higher inflation levels than most DM, investors were encouraged in March when inflation slowed materially below 4%. As a result, more hawkish members of the BOE walked away from voting to hike rates further in its latest policy update. However, the BOE commented that policy could remain restrictive even as it cuts rates, increasing odds that a rate cut could come sooner than August. While the economy entered a technical recession in Q4 2023, January GDP expanded by 0.2% MOM and PMI data suggested a continuing expansion of the services sector alongside stabilization in manufacturing, all of which improved investor sentiment.

Sources: Bloomberg Index Services Limited, EPRA, FTSE International Limited, Intercontinental Exchange, Inc., J.P. Morgan Securities, Inc., MSCI Inc., National Association of Real Estate Investment Trusts, Standard & Poor’s, and Thomson Reuters Datastream. MSCI data provided “as is” without any express or implied warranties.
Performance Exhibits
All data are total returns unless otherwise noted. Total return data for all MSCI indexes are net of dividend taxes.
USD-Based Investors index performance chart includes performance for the Bloomberg US Aggregate Bond, Bloomberg US Corporate Investment Grade, Bloomberg US High Yield Bond, Bloomberg Municipal Bond, Bloomberg US TIPS, Bloomberg US Treasuries, ICE BofAML 91-Day Treasury Bills, FTSE® NAREIT All Equity REITs, J.P. Morgan GBI-EM Global Diversified, LBMA Gold Price, MSCI Emerging Markets, MSCI World, Russell 2000®, S&P 500, and S&P GSCI™ indexes.
EUR-Based Investors index performance chart includes performance for the Bloomberg Euro-Aggregate: Corporate, Bloomberg Pan-Euro High Yield (Euro), EURIBOR 3M, FTSE EMU Govt Bonds, FTSE Euro Broad Investment-Grade Bonds, FTSE® EPRA/NAREIT Europe ex UK RE, J.P. Morgan GBI-EM Global Diversified, LBMA Gold Price AM, MSCI Emerging Markets, MSCI Europe, MSCI Europe ex UK, MSCI Europe Small-Cap, MSCI World ex EMU, MSCI World, and S&P GSCI™ indexes.
GBP-Based Investors index performance chart includes performance for the Bloomberg Sterling Aggregate: Corporate Bond, Bloomberg Sterling Index-Linked Gilts, ICE BofAML Sterling High Yield, FTSE® 250, FTSE® All-Share, FTSE® British Government All Stocks, FTSE® EPRA/NAREIT UK RE, J.P. Morgan GBI-EM Global Diversified, LBMA Gold Price AM, LIBOR 3M GBP, MSCI Emerging Markets, MSCI Europe ex UK, MSCI World, MSCI World ex UK, and S&P GSCI™ indexes.
EM currencies is an equal-weighted basket of 20 emerging markets currencies.
Fixed Income Performance Table
Performance data for US TIPS reflect the Bloomberg US TIPS Index, with yields represented by the Bloomberg Global Inflation Linked Bond Index: US.