We remain negative on high-yield bonds and only slightly more positive on leveraged loans, preferring other credit assets and strategies to help diversify portfolios
- Prices are rising for higher-yielding credit assets; earnings and balance are healing and have some upside from proposed changes to US fiscal policy.
- Despite the improving fundamental and macro backdrop, yields at multi-year lows are likely to curb performance and much of the good news is already priced in.
- If forced to choose between high-yield bonds and leveraged loans, we are more positive on leveraged loans as investors are higher in the capital structure and have some protection if rates rise more rapidly than expected. Looking broadly across credit opportunities, we prefer structured credit and select private credit strategies to help diversify portfolios.
We have been negative on high-yield bonds for several years, preferring other strategies including leveraged loans if forced to choose between only these two credit exposures. See, for example, Wade O’Brien, et al., “US High-Yield Bonds: Our Interest Remains Limited,” Cambridge Associates Research Note, March 2015 and Eric Winig, “Given the Recent Backup in Yields, Should Investors Look to Add High-Yield Exposure?,” CA Answers, November 3, 2015.
Heading into 2016, we and other strategists were unenthusiastic about high-yield bonds and leveraged loans, anticipating little more than modest gains. The uncertain outlook for oil prices and interest rates seemed to counterbalance yields that hovered near historical averages, and the potential for technically driven volatility appeared elevated. Yet, no sooner had the ink dried on cautious outlooks than a curious thing happened: high-yield bond and leveraged loan prices started to swiftly rebound alongside the sharp recovery in oil prices. High-yield bonds returned 19.0% from the end of January through year end, taking their total return for calendar year 2016 to 17.1%; leveraged loans returned 10.7% and 9.9%, for these time frames, respectively.
Although we didn’t anticipate the strong returns of 2016, we are not inclined now to change our view on high-yield bonds or leveraged loans. Strong recent returns obscure the fact that intermediate-term returns have been lackluster. Over the past three years, high-yield bonds have posted an average annualized return of just under 5%, well below the historical average of around 8% annualized. Meanwhile, the 3.8% return for leveraged loans over the past three years has barely surpassed that for investment-grade bonds, suggesting a potential mispricing of risk. Both of these returns are a far cry from the near 10% annualized return for US equities over the past three years and help justify our muted enthusiasm for these assets. Returns have compared favorably to credit-focused hedge fund indexes, though stronger-performing credit hedge funds have fared much better (Figure 1).

Figure 1. Returns for High-Beta Credit
December 31, 2000 – March 31, 2017 • Three-Year Rolling AACRs
Sources: Barclays, Bloomberg, L.P., Credit Suisse, and Hedge Fund Research, Inc.
Notes: High-yield bonds and leveraged loans are represented by the Bloomberg Barclays US Corporate High Yield Index and Credit Suisse Leveraged Loan Index, respectively. Hedge Fund Research data are preliminary for the preceeding five months.
In this research note, we review the outlook for high-yield bonds and leveraged loans, examining fundamentals, macro factors, and technical drivers. Investors should consider what reason they are looking to include credit strategies in their portfolios; in our view, structured credit strategies are a better opportunity in liquid credits, and in private credit we prefer select capital appreciation[1]These managers typically focus on making direct subordinated and senior debt investments in small- and medium-sized companies. and distressed strategies.
Lower Yields Present a Headwind to Future Returns
Yields for both high-yield bonds and leveraged loans (Figure 2) are sitting near multi-year lows, though bond yields rose slightly after the Federal Reserve hiked interest rates in March. Effective yields for leveraged loans, while somewhat unappetizing on an absolute basis, look attractive relative to those for high-yield bonds. Historically, leveraged loan yields have been around 20% lower than those of bonds given their more senior position in the capital structure. Today, they are nearly identical, supporting our view that between just these two assets, leveraged loans are more attractive.

Figure 2. Yields for High-Yield Bonds and Leveraged Loans
December 31, 2000 – March 31, 2017 • Yield
Sources: Barclays, Bloomberg, L.P., and Credit Suisse.
Notes: High-yield bonds and leveraged loans are represented by the Bloomberg Barclays US Corporate High Yield Index and Credit Suisse Leveraged Loan Index, respectively. Yields for high-yield bonds represented by yield to worst. Yields for leveraged loans are represented by three-month Libor plus the three-year discount margin. The three-year discount margin combines the loans’ yield with the price appreciation that would occur if the loans prepay at par in three years, consistent with historical average prepayment levels.
Lower yields on high-yield bonds are likely to weigh on subsequent returns. For investment-grade bonds, starting yields are the best proxy of subsequent returns. For high-yield bonds, the starting yield is not as tightly tied to subsequent returns—in some periods starting yields provide an accurate indication of future returns, while in other periods returns diverge dramatically from starting yields (Figure 3). In other words, risks to investors are somewhat asymmetric. Low yields are virtually guaranteed to limit the medium-term return potential for bonds and may not prevent substantial downside in the event that defaults dramatically increase. Floating-rate leveraged loans offer slightly better prospects if short-term rates continue to rise. The ability of issuers to call these loans if credit spreads compress is an offsetting headwind, as would be sharply rising rates that threaten credit fundamentals.
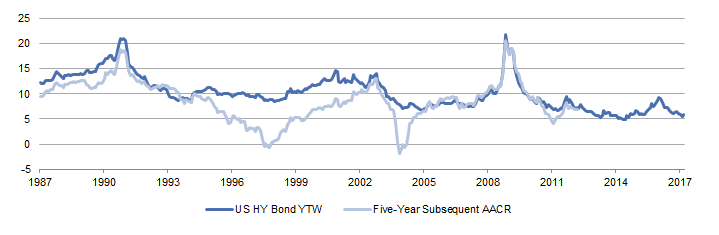
Figure 3. Starting Yields on High-Yield Bonds and Subsequent Five-Year Returns
January 31, 1987 – March 31, 2017 • Percent (%)
Sources: Barclays, Bloomberg L.P., and Thomson Reuters Datastream.
Notes: Data are monthly. US high-yield bond represented by the Bloomberg Barclays US Corporate High Yield Index. The last full five-year period was April 1, 2012, to March 31, 2017.
Fundamentals Are Rebounding . . .
Some of the rally in higher-yielding credit over the course of 2016 and into 2017 can be justified based on improving fundamentals. As Figure 4 demonstrates, leverage ratios (debt to EBITDA[2]Earnings before interest, tax, depreciation, and amortization.) for high-yield borrowers soared as profits trailed off during the end of 2015 and early 2016, with much of the blame falling squarely on the shoulders of commodity producers. BofA Merrill Lynch estimates that trailing 12-month EBITDA for energy high-yield companies declined by the end of 2015 to negative $44 billion, a decline of nearly $100 billion from the prior year. By the end of third quarter 2016, the sector was almost back to being cash-flow positive, and sector data now represent a far smaller group of firms. The story was similar for materials firms, where sector EBITDA nearly went to zero at the end of first quarter 2016, and subsequently staged a recovery.
Outside of these sectors, fundamentals have held up fairly well over the past two years; leverage ratios are now testing their long-term average. Trends in interest coverage show a similar story, although the recent history has been flattered by a period of historically low interest rates (Figure 4).
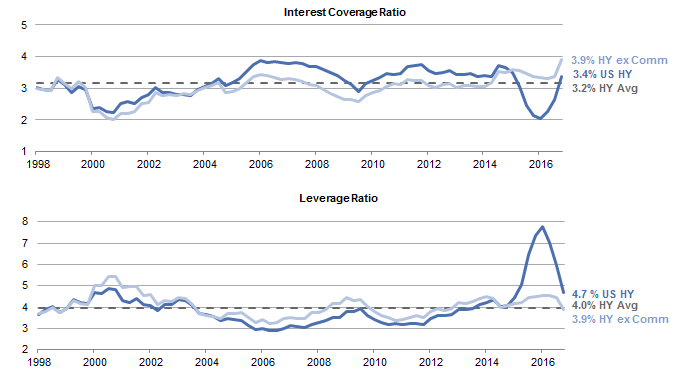
Figure 4. US High-Yield Interest Coverage and Leverage Ratios
First Quarter 1998 – Fourth Quarter 2016
Source: BofA Merrill Lynch.
Notes: Interest coverage ratio calculated as: LTM EBITDA / Net LTM Interest Expense. Leverage ratio calculated as: Net Debt / LTM EBITDA. Fourth quarter 2016 data for high-yield and high-yield ex commodities are based on 62.0% and 64.3% of the reported issuances relative to previous eight-quarter average, respectively.
Default rates for high-yield bonds have followed similar patterns and have rolled over in conjunction with improving fundamentals (Figure 5). The improvement has been gradual (the calculation is based on a trailing 12-month figure), but defaults seem to have peaked last June. Distress in the energy and mining sectors drove most of the increase in defaults; J.P. Morgan reports that over 80% of last year’s defaults came from these two sectors. By the fourth quarter, the trailing 12-month energy sector default rate reached as high as 22%; since that time it has slowly ticked downward. Putting aside the improving fundamentals and what happens in the months ahead, a positive start to 2017 suggests default rates may continue to decline for some time. Last year, around $4.5 billion of high-yield bonds defaulted each month on average; year-to-date in 2017 the pace has been roughly half of this amount.
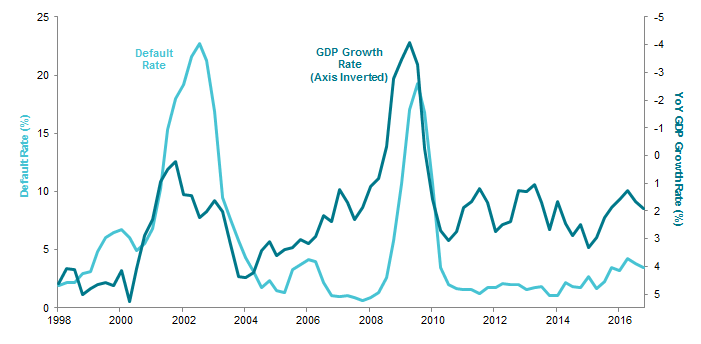
Figure 5. Default Rates and US GDP Growth
First Quarter 1998 – Fourth Quarter 2016
Sources: Deutsche Bank Credit Strategy, Moody’s Investors Service, Thomson Reuters Datastream, and US Bureau of Economic Analysis.
Notes: Defaults rates shown are par-weighted. GDP growth rate data are based on seasonally adjusted real GDP.
. . . But Sector Dynamics, the Fed, and USD Strength Are Wildcards
While improving fundamentals and declining default rates could help support high-yield bond and leveraged loan returns over the remainder of 2017, investors have a number of sector and macro dynamics to consider. Commodity prices are the largest wildcard for high-yield bonds in the months ahead, with energy still the largest sector in most high-yield indexes despite the recent spike in defaults. The combined index weight for commodity-related sectors remains substantial at around 20%, well above the level 15 years ago (Figure 6).[3]Mining is around 5% of the basic industry weight. Most analysts expect that the default picture will steadily improve over the course of 2017; to what extent will depend greatly on underlying commodity prices. For example, J.P. Morgan believes the energy sector default rate could fall to as low as 4% in 2017 if oil averages around $55 per barrel, but could more than double to 10% if the price averages closer to $45 per barrel.
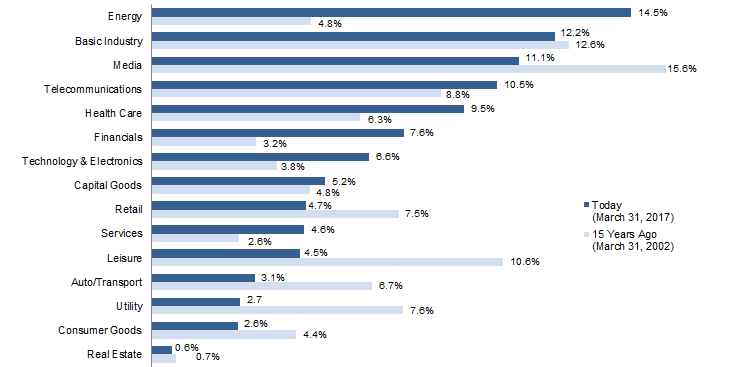
Figure 6. Fundamentals: US High-Yield Sector Weights (Market Value)
Source: BofA Merrill Lynch.
The retail sector has also been under the microscope in recent months, as a number of larger borrowers continue to struggle with the ongoing shift of many consumers to online channels. Roughly 18% of outstanding retail high-yield bonds trade at distressed prices—the highest among sectors—and March brought more headlines about Neiman Marcus and Sears, among others. Analysts have noted that these companies are difficult to kill off[4]Unlike, for example, energy companies whose asset-based lines of credit helped trigger the default wave in the sector. and many have struggled for years, but time seems to be running out and prices suggest debt restructuring for Payless and J. Crew, among others, is imminent. However, retail is less than 5% of the market cap of the high-yield index (and around 7% of the loan index), and current pricing reflects some of these issues.
A more aggressive than expected series of Fed interest rate hikes—perhaps due to an inflation surprise—is a macro threat for highly levered borrowers, as it would eventually result in higher debt servicing costs. Still, it would take a significant rise in short-term rates to materially impact interest coverage ratios. Deutsche Bank recently modeled the impact of 100 basis point (bp) and 200 bp across-the-curve increases in interest rates on interest coverage ratios. Their analysis showed that for roughly 90% of high-yield borrowers across most sectors a 100 bp rise in interest rates would cause borrowing costs to increase by less than 10% of EBITDA, though health care credits would not fare as well.[5]See Oleg Melentyev and Daniel Sorid, “Sensitivity of Issuer Fundamentals to Coupons Reset,” Deutsche Bank Market Research, US Credit Strategy, February 8, 2017. Even for a 200 bp increase, the impact is surprisingly limited, with more heavily levered CCC-rated borrowers estimated to experience the most damage.
For more on this, please see Aaron Costello, “What’s Next for the US Dollar?” CA Answers, March 14, 2017, and “The Final Phase of USD Strength,” Cambridge Associates Chart Book, February 2017.
The strength of the US dollar is a related wildcard, as BofA Merrill Lynch reports almost a quarter of high-yield borrower revenue is earned abroad. While this number is smaller than for some US equity indexes (around one-third of S&P 500 revenue is earned overseas), a further rise in the dollar relative to peers would lower the value of these earnings and put pressure on debt servicing metrics. Among the industries most exposed to currency fluctuations are technology (international revenue is estimated to represent 56% of total) and materials (39%). Some of this currency exposure could be mitigated by incurring expenses offshore—thus, lowering their effective cost as the dollar rises—and currency hedging. Year-to-date the dollar has actually depreciated against peers, but we think the dollar still has more to run in this cycle.
Don’t Overestimate Technical Drivers
Despite the financial media’s close coverage of investor flows and speculation about their impact on assets, we are more circumspect about attributing much long-term significance to flows. According to Barclays, mutual funds and exchange-traded funds only own around 20% of outstanding high-yield bonds, and less than 15% of leveraged loans. Institutional investors such as pensions, insurance companies, and hedge funds are much larger holders of high-yield bonds, and collateralized loan obligation vehicles own over half of outstanding leveraged loans (separately managed accounts are also a key part of the investor landscape). This is not to say that a surge in retail investors’ outflows can’t at the margin cause prices of these assets to drop; rather, it is to suggest that their influence is more muted over the medium term. Conversely, both institutional and retail investor flows into leveraged loan funds have recently been robust, and are part of the reason spreads are compressing.
Trends in issuance quality represent a different technical dynamic that is more relevant for investors. Generally speaking, it seems intuitive that a surge in lower-quality issuance could eventually be associated with increased incidence of default; the same is true for more aggressive use of proceeds like funding leveraged buyouts. Issuance volumes of CCC-rated bonds have increased over the last couple of months, prompting some speculation that investors are becoming less discriminating. However, looking farther back, CCC-rated issuance volumes have steadily declined in recent years (Figure 7), suggesting credit underwriting has been more stringent. Data tracking the use of proceeds tells a similar story; despite the surge in year-to-date acquisition financing, the longer-term trends shows this has been a much smaller part of the market than before the financial crisis.
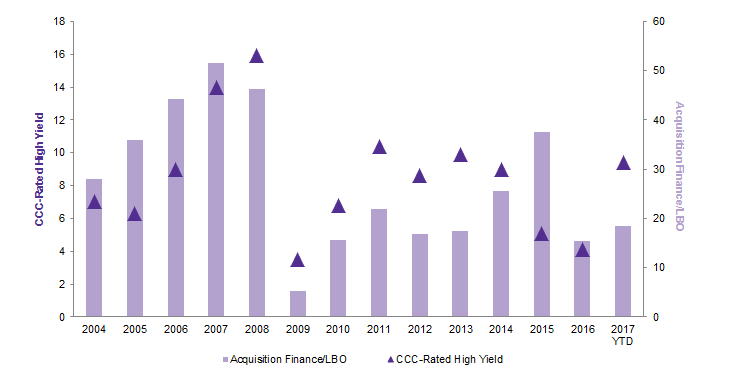
Figure 7. Trends in Riskier High-Yield Issuance
2004–17 • Percent of Total Issuance Volume (%)
Source: J.P. Morgan Securities, Inc.
Note: Year-to-date 2017 data are through March 31.
Other Credit Opportunities Are More Attractive Today
Investors reconsidering existing or evaluating potential credit investments need to think about how the investment will be funded, what role the allocation is intended to serve, and their tolerance for volatility and liquidity. Neither high-yield bonds nor leveraged loans are priced to compete with equities in several possible upside scenarios for growth and inflation; they should cushion portfolios if either of these disappoint. These investments are likely to generate higher returns than investment-grade bonds, which yielded 3.3% at the end of March and have a much longer duration. Rising rates pose more of a threat to high-yield bonds than leveraged loans, though short-duration high-yield funds are available and offer reasonable 4%–5% yields. Some of these short-duration funds have historically generated very consistent returns and protected capital during downdrafts, though they lack the upside potential during large rallies (such as we saw in 2016). Between the two, leveraged loans seem preferable given current relative yields and position in the capital structure. Rising rates could also generate higher income from loans, though would be problematic for some more levered issuers should rates rise much more rapidly than expected.
For more on this, please see Wade O’Brien, et al., “A Supportive Argument for Structured Credit,” Cambridge Associates Research Note, March 2017.
Still, we continue to prefer other assets within liquid credit and, for those investors that can take the illiquidity, private credit or lock-up strategies. On the liquid credit side, structured credit has attractive relative yields and upside potential if rates rise; diversified multi-asset hedge funds are an attractive way to gain access, and these may continue to outperform other types of relative value fixed income hedge funds. While a smaller market, some European bank subordinated debt also remains an attractively priced liquid credit option that could offer high single-digit returns. For investors that can lock up capital and are looking for higher absolute returns, private credit strategies offer a wide variety of options and should outperform both high-yield bonds over the intermediate term, as well as (potentially) some expensive public equity markets. Potential options include capital appreciation and credit opportunity strategies, where managers both originate new debt investments, as well as purchase existing securities. Capital appreciation strategies typically focus on small- and middle-market companies, which lack the typical access to capital markets that larger peers enjoy. Meanwhile, credit opportunity strategies will focus on companies of varying sizes and can involve distressed situations. The corollary to this advice is that the current good health of the high-yield and leveraged loan markets is reducing the opportunity set for traditional distressed investors (at least for now), so strategies that utilize a delayed draw (where capital is only called when needed) may be of interest.
Conclusion
Fundamentals are improving for high-yield and leveraged loan issuers, helped by rising commodity prices and a slowly rebounding US economy. Still, current yields will curb return potential. These assets may provide some ballast to equity portfolios should further volatility ensue, but don’t seem priced to compete with stocks in the intermediate term. If forced to choose between high-yield bonds and leveraged loans, loans seem the better option. Still, looking more broadly across opportunities in credit, we prefer liquid opportunities like structured credit, and private strategies like capital appreciation.
Wade O’Brien, Managing Director
Brandon Smith, Investment Associate
Footnotes