Annual global consumer price inflation (CPI) has averaged 5.3% since 2020—a notable increase from the 1.9% average of the previous decade.[1]Annual global CPI is defined by the 38 OECD member countries. Although inflation has retreated from its post-pandemic peak, it remains above pre-pandemic levels and is expected to rise in some countries due to higher tariffs.
In this piece, we review recent inflation trends, assess the potential impact of higher tariffs—particularly in the United States—and consider the outlook for both inflation and financial markets. Our base case is that inflation will likely settle near, but above, 2%—and possibly closer to 3%—in most major regions over the second half of the decade, rather than fully reverting to pre-pandemic lows. Tariffs represent a near-term, one-off risk, and we expect they will only temporarily interrupt the continued moderation in inflation. Nevertheless, recent years have underscored the need for humility in forecasting inflation’s future path.
While we do not expect inflation to reach the extremes of the late 1960s to early 1980s or 2021–22, we recognize that the risk of such an outcome is higher today than it was in the 2010s. This elevated risk reflects several factors, including tariffs, more frequent supply-side disruptions, rising geopolitical tensions and protectionism, and other ongoing structural changes. Despite this, many investors have reduced allocations to inflation-sensitive real assets, potentially increasing portfolio vulnerability to bouts of extreme inflation. While equities can offer protection against inflation over time, investors who are particularly sensitive to inflation spikes—or whose portfolios have become overly concentrated in equities—may wish to re-evaluate their portfolios and enhance diversification.
Recent Inflation Trends (2020 – Present)
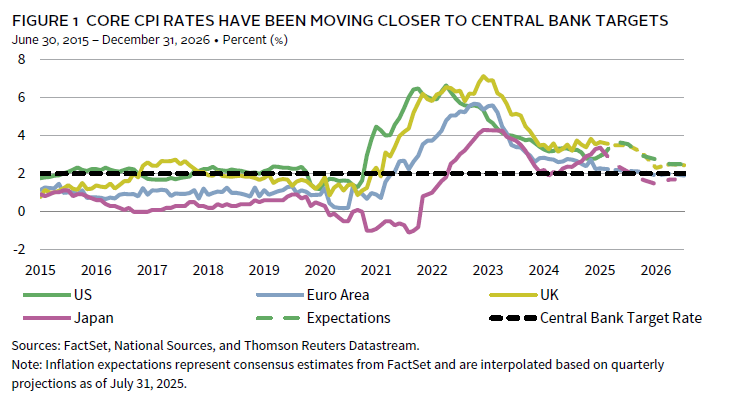
In the aftermath of the pandemic, a combination of supply chain disruptions, pent-up demand, and unprecedented policy stimulus—further exacerbated by Russia’s invasion of Ukraine—drove inflation to its highest level in more than 30 years during 2021–22. Since then, inflation has moderated as supply-demand imbalances have eased. Globally, core CPI stood at 4.5% as of June 2025, down from a peak of 7.8% in October 2022. Although inflation remains above pre-pandemic levels, it has moved closer to central banks’ 2% targets in most major developed markets (Figure 1). While consensus expectations had anticipated a continued disinflationary trend, heightened trade tensions—particularly due to higher-than-expected US tariffs—have recently pushed up near-term inflation expectations in the United States.
Tariffs: A Temporary Boost to Inflation
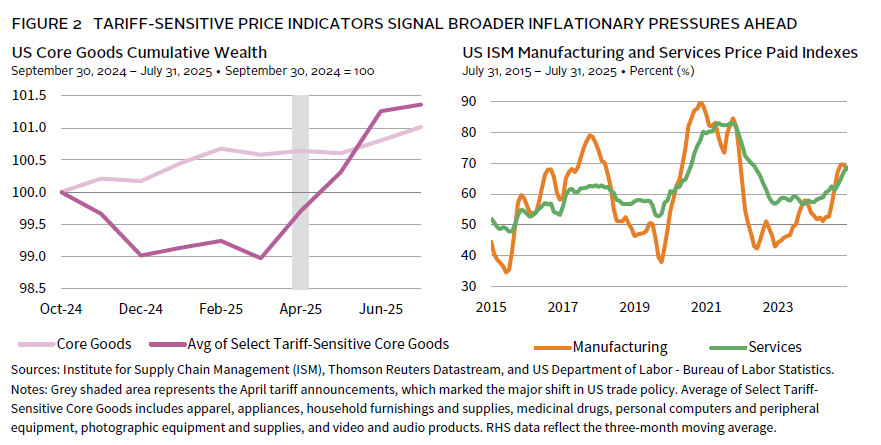
Tariffs on imported goods typically drive domestic prices higher, as businesses often pass increased costs on to consumers, and domestic producers may raise prices amid reduced competition and protectionist policies. However, the latest round of US tariffs has not yet resulted in a significant uptick in inflation (Figure 2). Several factors likely explain this muted response: elevated inventories, transshipment to circumvent tariffs, and a wait-and-see approach by businesses amid policy uncertainty. These dynamics are unlikely to persist. Recent surveys indicate that most US firms plan to pass through the bulk of tariff-related cost increases. Early signs of this shift are emerging in import-dependent core goods categories, and business surveys—such as the ISM Prices Paid Index—are signaling early warnings of broader inflationary pressures.
Importantly, we agree with the consensus view that the inflationary impulse from tariffs is likely to be temporary. Much like a value-added tax, tariffs tend to cause a one-off adjustment in price levels that fades over time—a pattern observed during the 2018 US-China trade war. Although the scale of tariff increases in 2025 will far exceed those of 2018, several factors should help contain their overall impact relative to other major price shocks.
First, tariffs are primarily applied to core goods imports, which represent only about 14% of US GDP and a relatively small portion of the CPI basket. Thus, empirical research indicates that a 10-percentage point (ppt) increase in the average effective US tariff rate typically raises US consumer prices by roughly 1%. With tariffs implemented through July 22, 2025, the average effective tariff rate is expected to rise by approximately 15–20 ppts, which could result in a core CPI increase of 1.5%–2.0%, according to the latest Budget Lab at Yale forecast. Second, the US economy has slowed, with a softer labor market and weaker consumer spending, reducing the risk of a demand-driven inflation spiral. Tariffs also function as a tax on consumers, which could further dampen real spending and moderate price pressures. Finally, there is little evidence of widespread supply shortages. Inflation expectations remain a key metric to monitor; so far, they have stayed broadly anchored. However, if businesses and consumers begin to anticipate persistent price increases, tariffs could trigger a larger inflationary impulse. Outside the United States, the inflationary impact should be more limited, as most countries have not matched these tariff hikes and retaliatory measures remain modest and primarily focused on US exports.
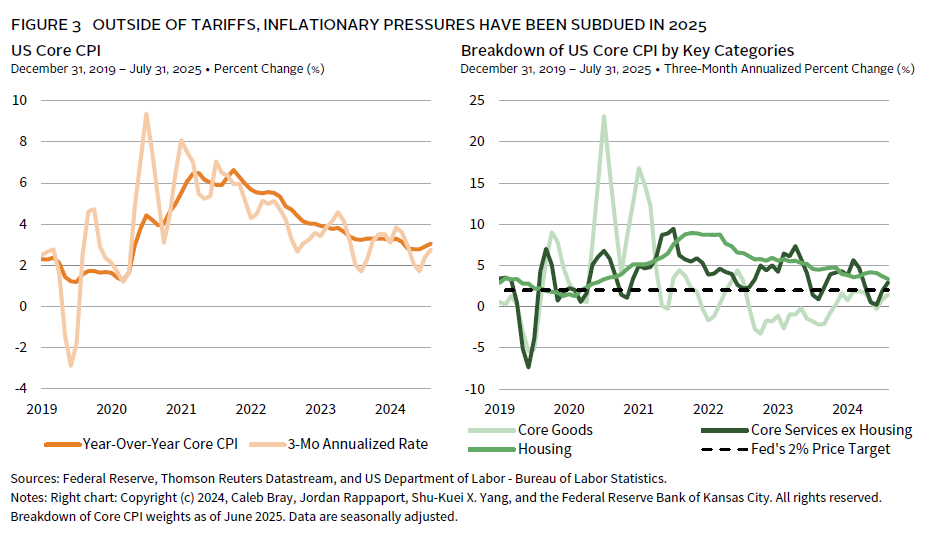
Beyond the effects of tariffs, broader inflationary pressures have remained subdued this year. The combination of a softer labor market and a weak housing market does not support a meaningful acceleration in major price categories outside of tariff-impacted core goods (Figure 3). These other categories represent a much larger share of the CPI basket, which should help anchor overall price levels. Additionally, monetary policy remains restrictive, and while recent fiscal measures are expansionary, they are unlikely to offset the near-term drag from tariffs. Other factors, such as changes in immigration policy or a weaker US dollar, could contribute to inflation, but these may be counterbalanced by lower oil prices. For example, the dollar has declined by roughly 10% so far this year, but WTI crude oil prices have also fallen by 12% due to weaker expected global demand resulting from tariffs. According to the Bloomberg SHOK tool, these offsetting trends should result in only a slight net inflationary effect.[2]SHOK is a Bloomberg forecast model that allows you to explore how shocks from shifts in economic, market, and policy variables impact the outlook for growth, inflation, and central bank policy.
In summary, barring severe supply disruptions or a significant rise in inflation expectations—which appear unlikely—the price impact from tariffs should be temporary and much less severe than other major price shocks, given current cyclical conditions and the negative demand effects of tariffs.
Have We Entered a New Inflation Environment?
While we maintain a relatively optimistic outlook regarding the price impact of tariffs and current cyclical conditions, the risk remains that inflation could be higher—and potentially more volatile—over the remainder of this decade compared to the 2010s.
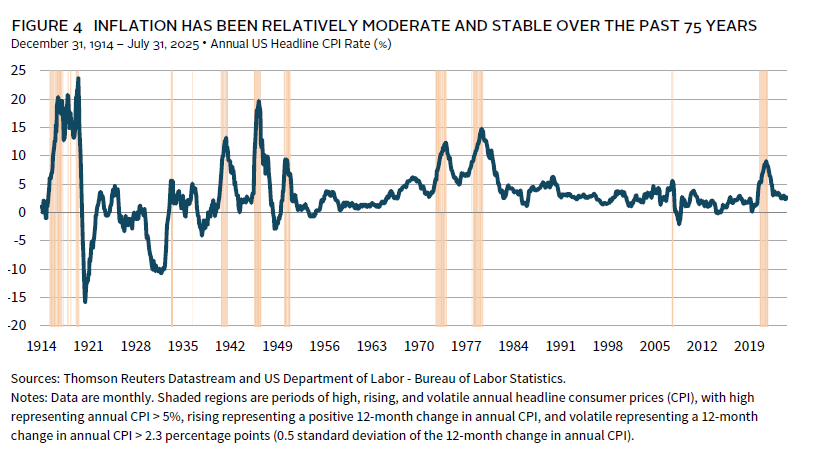
The United States has experienced a range of inflationary environments, each shaped by varying combinations of demand and supply forces (Figure 4). For analytical purposes, inflation can be considered across three dimensions: level (high/low), momentum (rising/falling), and volatility (unstable/stable). Inflation was notably volatile in the first half of the twentieth century before the Treasury-Fed Accord of 1951 established the Federal Reserve’s independence, with frequent episodes of both demand- and supply-driven price shocks. The late 1960s to early 1980s saw a series of severe supply-driven shocks, which resulted in periods of high, rising, and volatile inflation. Outside of that ten- to 15-year window, the United States has generally enjoyed moderate and stable inflation over the past 75 years, until the significant price shock of 2021–22. Although inflation has recently stabilized at a lower rate, risks remain elevated.
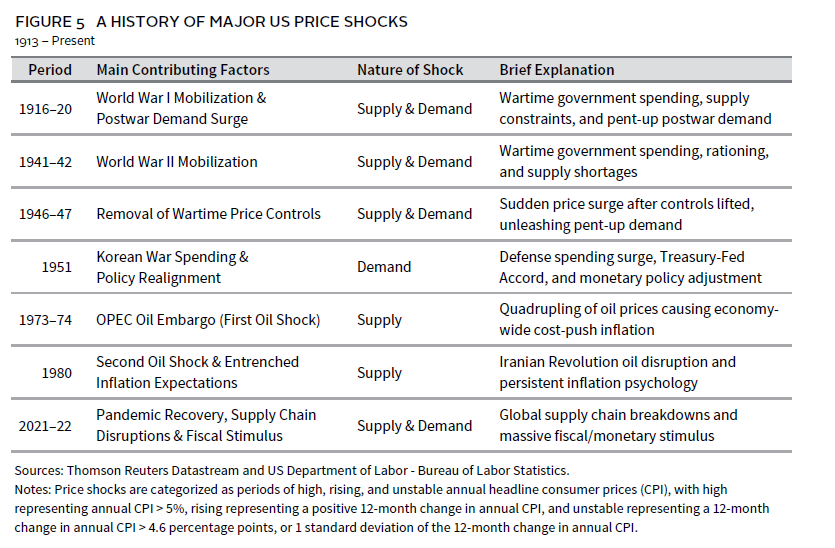
In our assessment, a return to the boom/bust inflation environment of the pre-1950s or the supply-driven shocks of the late 1960s to early 1980s does not appear to be the most likely outcome. Historically, most price shocks have stemmed from a combination of supply/demand pressures (Figure 5). In the current context, tariffs are more likely to suppress demand, and the scale of this supply shock appears limited relative to previous episodes. Nevertheless, US inflation remains above the Fed’s 2% target, and the estimated impact of tariffs could push it close to the 5% threshold associated with high inflation, increasing the probability of entering a high, rising, and volatile inflation environment. Additional supply disruptions, policy missteps, or structural changes—such as deglobalization, demographic shifts, rising populism, fiscal deficits and debt, evolving Fed independence, climate change, the energy transition, and advances in artificial intelligence (AI)—could further contribute to inflationary pressures, depending on how these factors interact. While extreme inflation scenarios are unlikely, we caution against excessive confidence in any single outcome, as risks have increased at the margin.
Investment Advice
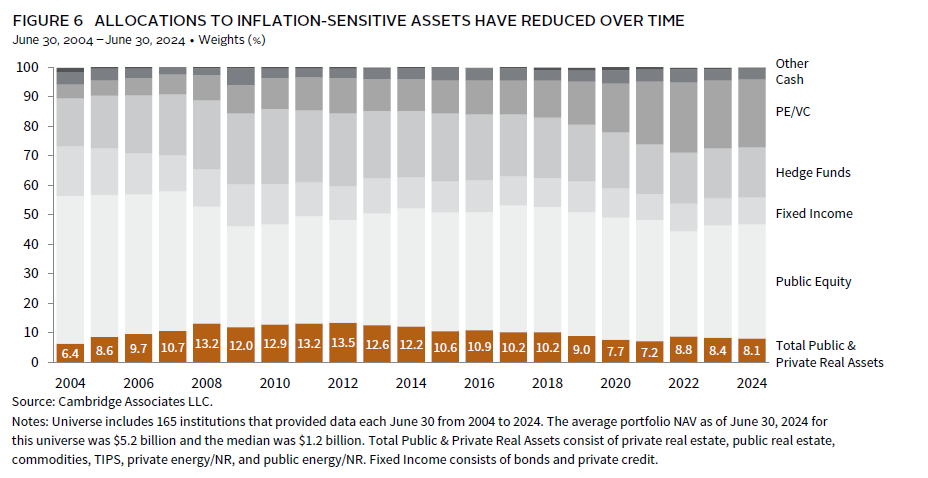
A key challenge for investors is that few strategies provide reliable inflation protection, and those that do often come with opportunity costs that can reduce long-term returns. With inflation largely dormant before 2021–22, many investors reduced allocations to inflation-sensitive real assets, potentially leaving portfolios more exposed to upside inflation surprises (Figure 6). Data from a Cambridge Associates peer group of 165 endowments and foundations show real assets allocations have declined by more than 4 ppts on average in the past decade, now averaging just 8%. Exposure to the highest inflation beta assets—commodities, gold, developed markets resources equities, and TIPS—is less than 2%.
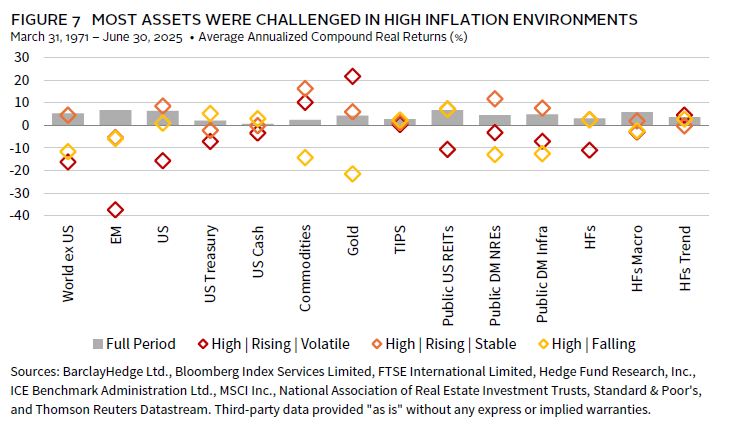
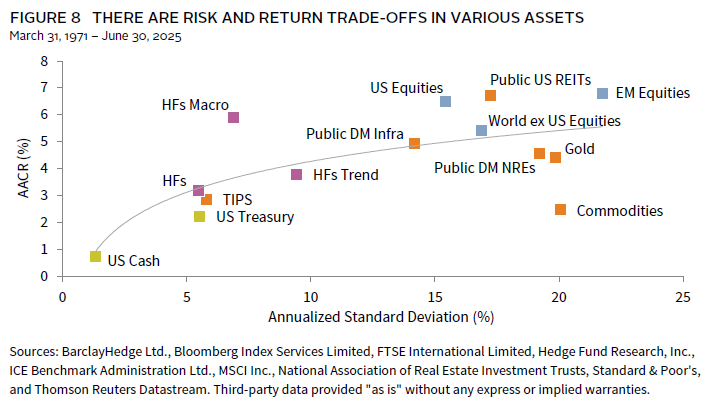
Other assets can offer some inflation protection. Equities and bonds have generally kept pace with inflation over long periods, but episodes of high, rising, and volatile inflation are particularly challenging (Figure 7). While these episodes are rare, with just four since 1971, they typically last longer than the average recession—15 months versus 11 months—and can be particularly damaging, given their impact on both equities and high-quality bonds. During such episodes, US equities and Treasury bonds posted average annualized returns of -16% and -7%, respectively. Even traditional inflation-sensitive assets like public REITs, developed markets resources equities, and infrastructure often delivered negative returns. Commodities and gold performed best, but their returns tend to fall sharply when inflation decelerates, making timing difficult and their long-term track record poor compared with equities. US TIPS and trend-following strategies were the only other assets with positive returns during these periods.[3]Both US TIPS and trend-following have a limited data history. Therefore, while in theory both asset classes may benefit in an inflationary environment, investors should be cautious about drawing too … Continue reading Assets with inflation-adjusted revenue streams, such as TIPS or infrastructure, can help during periods of high inflation, but may be less effective than commodities or gold during volatile shocks if price adjustments lag (Figure 8). Less traditional hedges—like trend-following or high-quality floating rate debt—may also offer some protection, but their track records are less certain, given limited data histories.
In today’s environment, building resilient portfolios is essential. Inflation risks are elevated and macroeconomic uncertainty is high. Allocating capital to hedge macro risks may reduce returns, so investors should carefully consider risk tolerance, objectives, and spending needs. Robust scenario analysis can clarify portfolio implications under different outcomes. Investors whose finances are more exposed to inflation risk should reassess their allocations to inflation-sensitive assets, recognizing that every inflation environment is different and that no single asset is a perfect hedge. A basket approach—combining multiple inflation-sensitive assets—can provide more stable returns and stronger inflation correlation. For those less concerned about inflation but focused on maintaining well-diversified portfolios capable of navigating a wide range of macroeconomic outcomes, pairing high-quality nominal government bonds with a broader mix of assets such as trend-following strategies, TIPS, cash, or gold can deliver similar total returns with more consistent downside protection, and potentially provide ballast in more extreme inflation environments.
TJ Scavone, Senior Investment Director, Capital Markets Research
Drew Boyer and Mark Sintetos also contributed to this publication.
Figure Notes
Most Assets Were Challenged in High Inflation Environments
The equity data are total returns of MSCI Indexes. The fixed income data are total returns of Bloomberg Indexes. Other data are total returns represented by the following indexes: US Cash (ICE BofA 0-3 Month US Treasury Bill Index), Commodities (S&P GSCI Commodity Index), Gold (Gold Bullion Spot Price), Public US REITS (FTSE Nareit All Equity REITS Index), Public DM NREs (Blend of Datastream Developed Markets Energy Index and Datastream Developed Markets Basic Resources Index), Public DM Infra (Blend of Datastream World Pipelines Index and Datastream World Gas, Water, and Multi-Utilities), HFs (Hedge Fund Research Fund of Funds Diversified Index), HFs Macro (Hedge Fund Research Macro (Total) Index), and HFs Trend (Barclay BTOP50 Index (Local Currency). Data are monthly. Data for EM begins in January 1988; Public REITS and Infrastructure both in January 1972; Public DM NREs in February 1973; HFs and HFs Macro both in January 1990; and HFs Trend in January 1987. High represents annual CPI > 5%, rising (falling) represents a positive (negative) 12-month change in annual CPI, and volatile (stable) represents a 12-month change in annual CPI greater (less) than 2.3 percentage points (half of one standard deviation of the 12-month change in annual CPI).
There Are Risk and Return Trade-Offs in Various Assets
The equity data are total returns of MSCI Indexes. The fixed income data are total returns of Bloomberg Indexes. Other data are total returns represented by the following indexes: US Cash (ICE BofA 0-3 Month US Treasury Bill Index), Commodities (S&P GSCI Commodity Index), Gold (Gold Bullion Spot Price), Public US REITS (FTSE Nareit All Equity REITS Index), Public DM NREs (Blend of Datastream Developed Markets Energy Index and Datastream Developed Markets Basic Resources Index), Public DM Infra (Blend of Datastream World Pipelines Index and Datastream World Gas, Water, and Multi-Utilities), HFs (Hedge Fund Research Fund of Funds Diversified Index), HFs Macro (Hedge Fund Research Macro (Total) Index), and HFs Trend (Barclay BTOP50 Index (Local Currency). Data for EM begins in January 1988; Public REITS and Infrastructure both in January 1972; Public DM NREs in February 1973; HFs and HFs Macro both in January 1990; and HFs Trend in January 1987.
Footnotes