Summary of policy benchmarking approaches
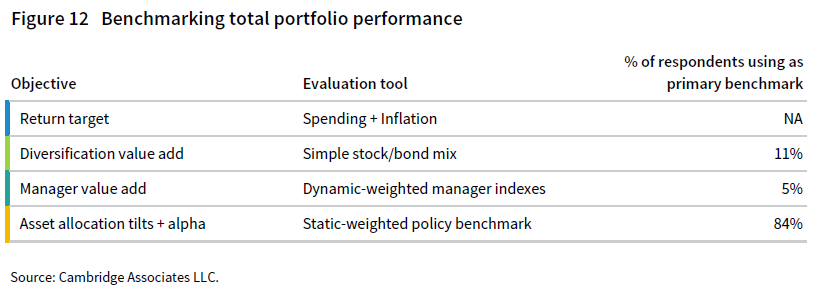
Benchmarking investment performance is an essential piece of an endowment’s well-functioning governance process. When selecting a benchmark, it is important for institutions to understand what types of questions they are seeking to answer (Figure 12). There is no single benchmark that can assess every single aspect of portfolio management. Consequently, it is not uncommon for institutions to use multiple benchmarks in their performance evaluation process. In our survey, we asked respondents to provide both the real return objective for the endowment and the primary benchmark used to evaluate investment performance at the total portfolio level.
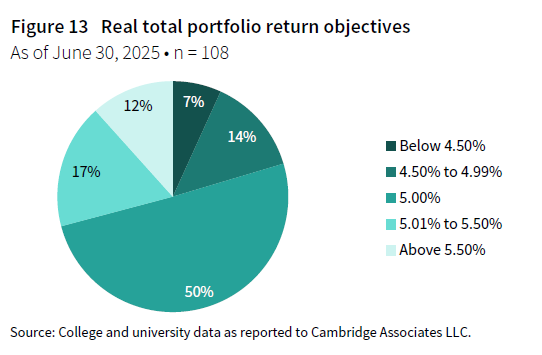
A fundamental part of an endowment’s investment policy is the return objective. Most endowments use a spending policy that is connected in some way to an annual spending rate. That percentage rate serves as the basis for establishing a minimum return target that endowments aim to earn over the long term. If an endowment can generate an investment return that exceeds the sum of its spending rate and inflation, it can maintain or grow the purchasing power of its assets over time. The most common real (i.e., inflation-adjusted) return objective among endowments continues to be 5% (Figure 13).
In the Investment Portfolio Returns section, we cited the performance of a blended index weighted 70% to the MSCI ACWI and 30% to the Bloomberg Aggregate Bond Index. For endowments that are diversified across alternative asset classes, a benchmark such as this helps to evaluate whether the decision to diversify the portfolio added value. Our comparisons of median endowment performance versus the 70/30 benchmark show how the peer universe in general measured up to a simple, passive investment option.
In practice, just 11% of respondents (15 of 138) reported that a simple blended index was the primary benchmark used for their total portfolio return. The most common approach among this subgroup was to use a blend weighted 70% to an equity component and 30% to a bond component. However, there were other endowments that used higher weightings for the equity index—85% was the highest reported—while there was one respondent that reported a weighting as low as 60%. The most appropriate weightings for this type of benchmark would be a blend that aligns with the targeted risk profile of the portfolio. In fact, three of the 15 institutions in this cohort also use only two categories in their target asset allocation policy, and the weightings of the equity and bond indexes matched their policy targets to the equity/growth and bond categories in their policy structure.
The remaining peers in the universe use a policy benchmark that had three or more components. The vast majority (84%) use a blend of indexes with static weightings that align exactly or closely with the asset classes and target percentages specified in their asset allocation policies. This type of benchmark helps an institution evaluate how its endowment performed relative to the blended index that represents its default or normative position. A handful of respondents (5%) use a blend of manager-specific indexes, where the weightings update frequently (e.g., monthly) to match each manager’s allocation in the total portfolio. This type of benchmark is intended to focus on manager selection decisions and neutralizes the effects of over/underweights of the actual asset allocation versus policy targets. The figures that follow provide more detail on benchmarks for the endowments that use a dynamic-weighted or static-weighted policy benchmark.
Components of policy portfolio benchmarks
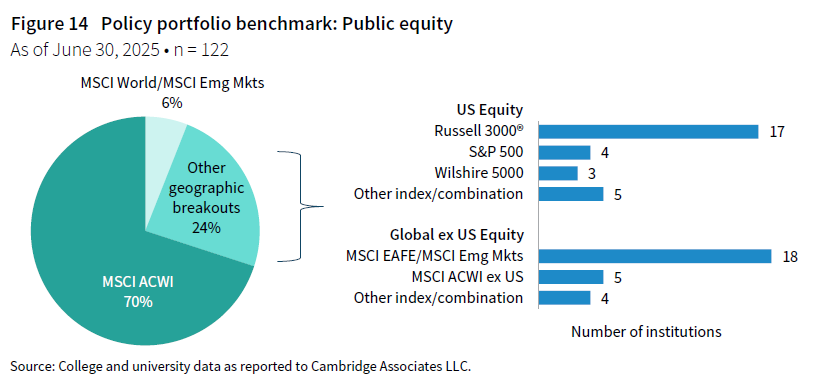
The MSCI ACWI continues to be the most common measure for benchmarking public equities. In fiscal year 2025, 70% of the respondent group used this index to represent their entire public equity allocation in the policy portfolio benchmark (Figure 14). This was up slightly from the 66% of institutions that cited the index in last year’s study. The remaining respondents use a combination of indexes that are more geographically defined. For those that use a US-focused benchmark, the Russell 3000® Index was by far the most prevalent. For global ex US equities, a combination of the MSCI EAFE Index and the MSCI Emerging Markets Index was cited most often.
When evaluating PE/VC in the policy benchmark, a majority of the overall universe (64%) uses a public index (Figure 15). The MSCI ACWI was also the preferred choice in this area, as it was cited by 65 of 77 respondents using a public index to benchmark PE/VC. The rationale for using a public index is that the public equity bucket in the portfolio was the funding source for private equity allocations. And if the portfolio did not invest in private equity, that capital would have remained with the public equity allocation. The use of a public index primarily evaluates whether the decision to invest in private markets paid off for the portfolio.
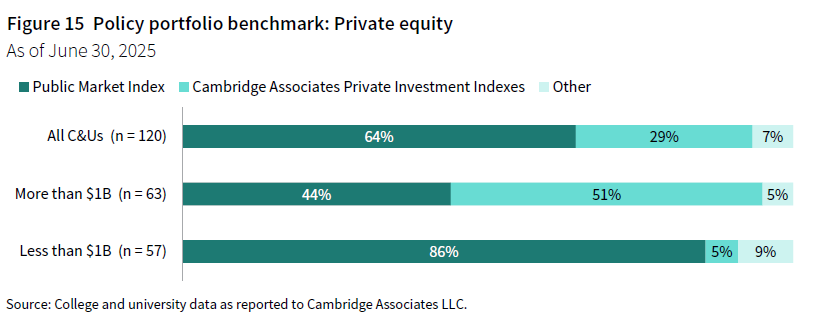
There are some shortcomings to using a public index to benchmark private equities. Most notably, the public stock market is not a universe of securities that is representative of private equity investments. Consequently, in periods where there are large differentials between public equity and private equity performance, the spread between the portfolio return and the benchmark return can be more reflective of those market dynamics than of how well the management team implemented the private portion of the portfolio. A little more than one-quarter of endowments (29%) instead use the CA private investment indexes to represent private equity in the policy benchmark. These indexes do not meet the ideal properties of benchmark as they are not transparent or investable. However, they are a universe of institutional-quality private investment funds that are more representative of the asset class compared to a public index.
The survey responses from fiscal year 2025 look almost identical to the year prior. There continues to be a stark difference in practices between smaller and larger endowments. For endowments less than $1 billion, a public index was by far the most common practice. In contrast, approaches were more mixed among endowments more than $1 billion, with the CA private investment indexes being cited by a little more than half of respondents. The private investment indexes can be custom weighted by vintage year and exposure across different strategies, which helps to evaluate fund selection. It is likely for this reason that the approach continues to be prevalent among larger endowments, of which many have performance-based incentive compensation programs for their investment staff.
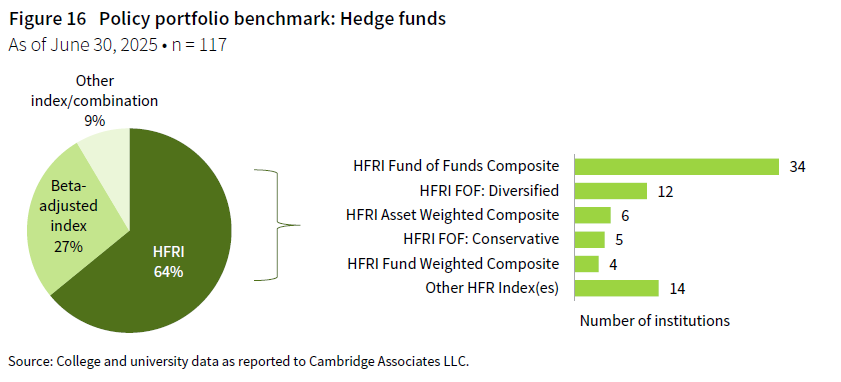
Endowments also face similar challenges of selecting an appropriate index when accounting for hedge fund allocations in the policy benchmark. Most respondents continue to use one or more indexes produced by Hedge Fund Research® (HFR), which tracks hedge fund managers that report to their database (Figure 16). Within this family of indexes, the HFRI Fund of Funds Composite was most often cited. Other approaches include a beta-adjusted benchmark, although the exact method varies across a few different options. Most respondents using this type of benchmark use either a blended public equity/bond index or a blended public equity/91-Day T-Bill return stream. In both instances, the MSCI ACWI with a 0.3 beta is the most common approach.
Benchmarking practices tend to be even more unique across the respondent group in other strategies. When it comes to bonds, the Bloomberg Aggregate Bond Index was used by 42% of institutions. The remaining participants choose benchmarks more specific to sector, maturity range, and/or geographic exposures. Benchmark combinations for real assets are even more unique across the respondent group due to the variety of strategies and exposures across those categories. Finally, while a majority of the universe has allocations to private credit strategies, only a small percentage of those endowments have a dedicated benchmark to private credit in their policy benchmark.
The choice of PE/VC benchmark has had a significant impact on performance evaluation recent years
A majority (64%) of responding endowments fell short of their policy portfolio benchmark in 2025. When considering the spread between the portfolio return and the benchmark, the median across the respondent group was -70 bps for the fiscal year. Outcomes varied widely across endowments, ranging from 290 bps of outperformance at the top 5th percentile mark of the universe to underperformance of 410 bps at the bottom 5th percentile (Figure 17).
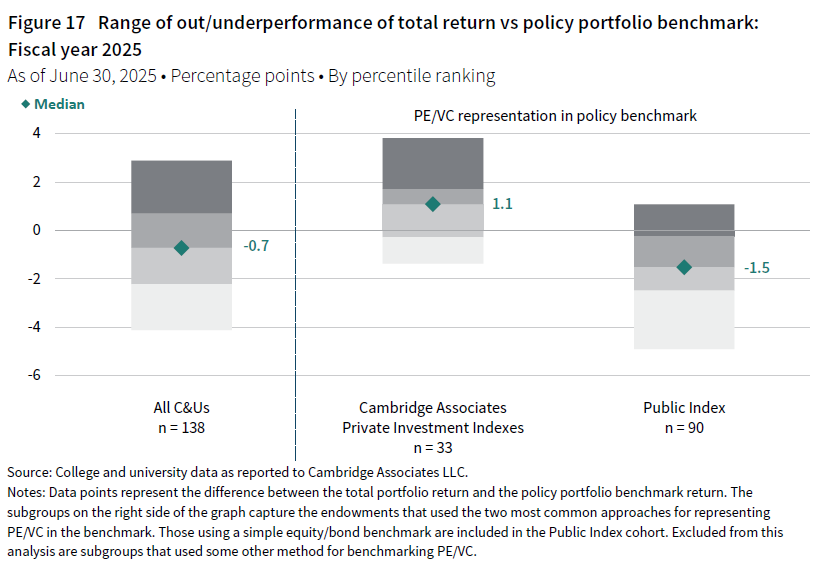
When breaking the peer universe down further, it is clear that the type of benchmark used for PE/VC was a big factor in how well an endowment performed versus its overall policy benchmark in 2025. For endowments that used the CA private investment indexes, the median value add was positive at 110 bps. More than two-thirds (23 of 33) of the institutions in this cohort actually outperformed their policy benchmark over the past year. In contrast, the median value add for endowments using a public index was significantly lower at -150 bps. Just 20% (18 of 90) of endowments in this subgroup outperformed their policy benchmark in 2025.
The different experiences of these two subgroups tie back to the relationship between public equity and private equity index returns in 2025. The one-year horizon IRR of the CA Private Equity and Venture Capital Index was considerably lower than the mPME version of the MSCI ACWI (10% versus 16%). Therefore, an endowment using a public market index would calculate a higher benchmark return than it would if using a private equity–specific index. With most endowments in the peer universe having 25% or more of their portfolios invested in PE/VC, the index choice is quite consequential in the policy benchmark calculation.
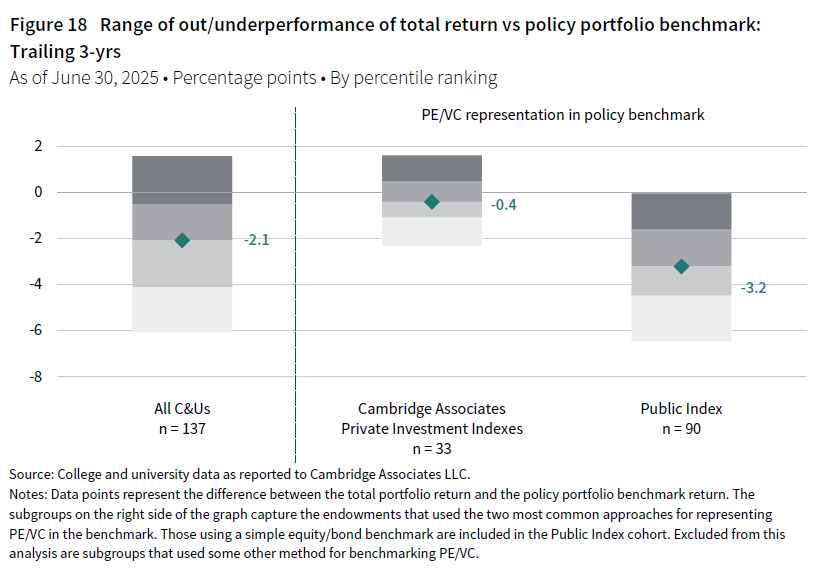
Endowments using the public index for PE/VC also have worse relative performance against their policy benchmark over the trailing three-year period (Figure 18). This was not a surprise, given that it was the third straight year where private equity trailed public equity market performance. However, the task of beating the benchmark was even more challenging than it was in 2025 for all endowments regardless of the choice of benchmark, with the median value add being negative for both cohorts. The median value add for the overall universe, at -210 bps, was the lowest trailing three-year figure we have ever calculated in the decade-plus timeframe that we have been collecting this data. Further, just 4% of the public index group and 30% of the CA index group outperformed their policy benchmark for this period.
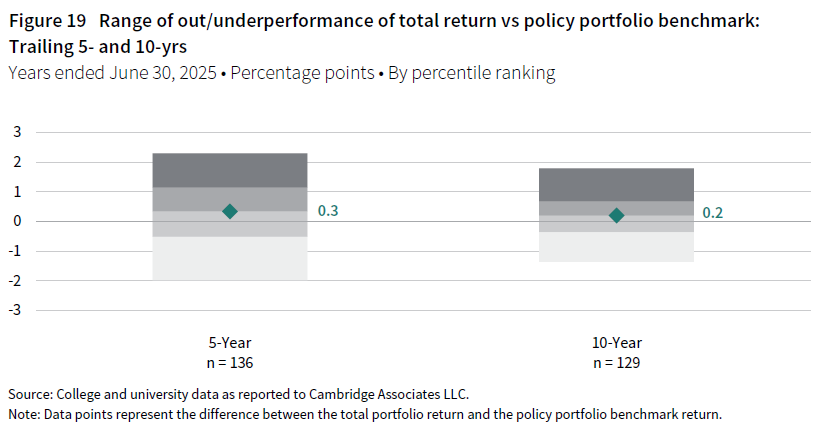
The differences in benchmarking approaches were less impactful on the value-add statistics for the trailing five- and ten-year periods (Figure 19). The distribution of value adds across peers was similar for both subgroups and a majority of both cohorts outperformed their benchmark over these timeframes. For the overall respondent group, the median spread between the portfolio return and the benchmark return was 30 bps for the five-year period and 20 bps for the ten-year period.