The strong headwinds facing the commodity sector limit our conviction that current prices will translate into reasonable total returns
- Commodities’ incredible descent since 2008 has sent benchmarks back to levels not seen in more than a dozen years and brought prices for many below long-term inflation-adjusted levels.
- Potential waning global growth, excess commodity supplies, and US dollar appreciation are among the risks currently casting long shadows across the sector, while collateral and roll yields offer negligible or negative support to returns.
- Investors should wait for clear signposts suggesting the sector is likely to be undersupplied before adding to or initiating an allocation.
Please see Sean McLaughlin et al., “Commodities: Sitting Out the Next Round?” Cambridge Associates Global Market Commentary, February 2012.
Four years ago, we suggested that elevated spot prices, a negligible cash collateral yield, and an ongoing contango drag were a recipe for disappointing commodity futures returns. We questioned whether the diversification benefits and inflation-hedging attributes commonly associated with the asset class were worth the opportunity costs of an allocation. In the years since we outlined this view, markets have indeed shown poor performance—the benchmarks Bloomberg Commodity Index and S&P GSCI™ have returned -48.6% and -61.9%, respectively, from March 2012 to February 2016.
Such a dramatic sell-off in commodities gives us reason to consider whether things have changed. Is now an attractive opening for investors? In short, not yet. While many spot prices are below long-term inflation-adjusted levels, which suggests the asset class may have less downside risk relative to years past, we lack conviction that lowered prices will translate into reasonable total returns, particularly considering commodity futures continue to face a net negative hindrance from collateral and roll yields.
For our views on total portfolio allocations, please see the first quarter 2016 edition of VantagePoint (a quarterly publication from Cambridge Associates’ Chief Investment Strategist), published January 15, 2016. On MLPs, see Kevin Rosenbaum et al., “Energy MLPs: Opportunities in the Pipeline?,” Cambridge Associates Research Note, February 2016. On NREs, see Sean McLaughlin et al., “Value in the Oil Patch, for Investors With a Strong Stomach,” Cambridge Associates Research Note, August 2015.
Risks such as potential waning global growth, excess commodity supplies, and US dollar appreciation currently cast long shadows across the sector. Until those shadows recede, investors evaluating listed real asset options would benefit from considering master limited partnerships (MLPs), natural resources equities (NREs), or gold, depending on portfolio needs. In this research note, we review the drivers of commodity futures performance, discuss potential headwinds, and highlight how the asset class’s role as a diversifier may have faded from years past.
In the Doldrums
Since the beginning of the decade, benchmark index performance has received little support from spot price changes, cash collateral yields, and roll yields, commodity futures’ three potential sources of returns (Figure 1). The change in spot prices—discussed further in the next section—has been the largest detractor in recent years. Owing to market imbalances, the declines this decade followed dramatic spot price gains in the 2000s, where nearly every commodity benefited from rapid demand growth emanating from China and other emerging markets countries.

Figure 1. Building Blocks of Commodity Futures Returns by Decade
January 1, 1970 – February 29, 2016 • AACR (%)
Sources: Bloomberg L.P., Standard & Poor’s, and Thomson Reuters Datastream.
Notes: Represents components of the S&P GSCI™ and Bloomberg Commodity indexes. Collateral return is the return from investing futures collateral in cash instruments. Roll return is the premium gained (paid) from rolling futures contracts to the next month when a commodity is in backwardation (contango). Spot return is the nominal change in spot price of the index’s commodities. The Bloomberg Commodity Index begins December 31, 1990.
The cash collateral yield, which is the interest earned on the cash that fully collateralizes the futures, has been the only positive contributor to total returns this decade, but it hasn’t exactly been thrilling. Often invested in just three-month Treasury bills, the yield has done very little for investors since the Federal Reserve adopted its zero interest rate policy in late 2008. As noted in Figure 1, the cash collateral yield has been the only consistent positive contributor to total returns and, frequently, the most essential component.
The roll yield, or the return earned as the price of a futures contract converges on the commodity’s spot price, has also been lackluster due to the number of commodities in contango. In a contango market, when a futures price is greater than its spot price, the futures price will roll down the term structure as it approaches expiration, resulting in a negative yield. Since the GSCI’s launch in 1991, close to 70% of monthly roll yields have been negative, versus 50% for the same index’s pre-launch back-tested data covering the period of 1970 to 1990 (Figure 2). While term structures are unstable, the current high levels of inventories weighing down the front-ends of futures curves don’t suggest any near-term change.
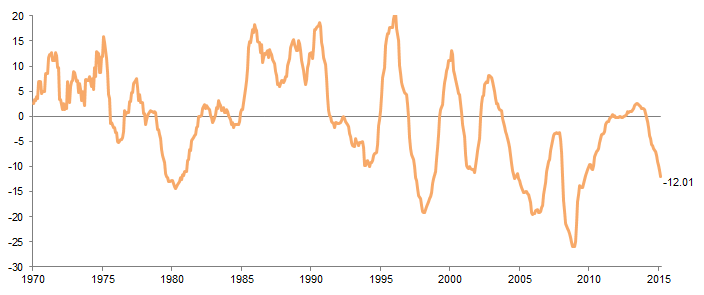
Figure 2. Commodity Futures Trailing 12-Month Roll Yield
January 31, 1970 – February 29, 2016 • AACR (%)
Source: Thomson Reuters Datastream.
Note: Data are monthly and represent the trailing 12-month roll yield of the S&P GSCI™.
The net result of the negative performance has been a mass exodus from the sector, with pervasive levels of negative sentiment. Since the end of 2012, $130 billion has left the asset class, dropping commodity assets to just $160 billion, according to Barclays, and money managers in recent weeks have held their combined net-bearish position across 18 commodities near its largest amount since data began in 2006 (Figure 3). Both flows and sentiment have improved recently, but modestly and from low levels, and many of the issues that have dogged commodities for several years remain sources of concern.
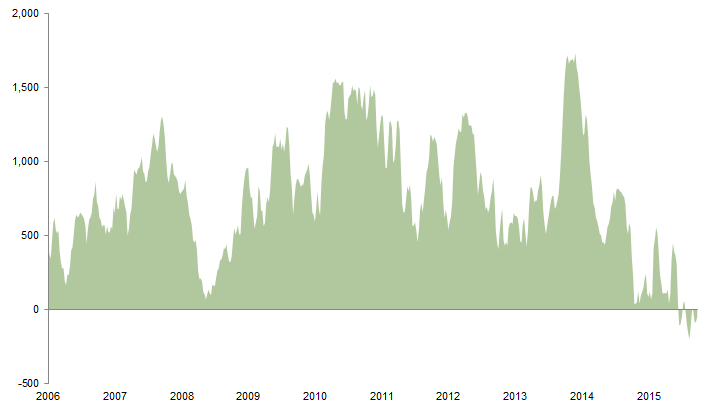
Figure 3. Money Managers’ Combined Position Across Commodities
June 16, 2006 – February 29, 2016 • Thousands of Contracts
Source: Bloomberg L.P.
Note: Data are weekly and represent money managers’ combined net position across 18 commodities.
Market Imbalances
The steep price declines in commodities have roots in the late 1990s. From then through the late 2000s, commodity demand appeared to be unquenchable, as global GDP boomed. The rapid industrialization of China demanded increasingly larger shares of global commodities, as its billion-plus population moved in droves from rural inland areas to the coast in search of economic advancement. In the ten-year period to each commodity’s respective peak (ranging from 2007 to 2009), real prices grew at a staggering clip—by our count, 15 of the 22 commodities we track experienced annual growth rates in the double digits.
The rapid growth in demand incented commodity producers to invest in new wells, mines, and acreage to capture what seemed to be healthy returns, particularly considering many markets had suffered from a long period of under-investment leading into the late 1990s. But because of the long lead time between new investments by many commodity producers to production—mines and deep sea–exploration projects can easily take years to come online—producers overestimated the supply needed. As China’s economic growth rate peaked, new levels of supply were still hitting commodity markets.
Commodity markets have tanked since 2008 (Figure 4), and neither bloodletting nor snake oils have been able to save them, in part because market imbalances are not easily resolved. Many commodity producers have a low ratio of ongoing costs relative to upfront fixed costs. When a commodity price drop makes a producer unprofitable, the producer may have little choice but to keep producing, as it may still be generating positive cash flows. Declining commodity prices have also coincided with historically low interest rates and, more recently, cost deflation, both of which have exacerbated supply problems by pushing a producer’s shut-in point lower.
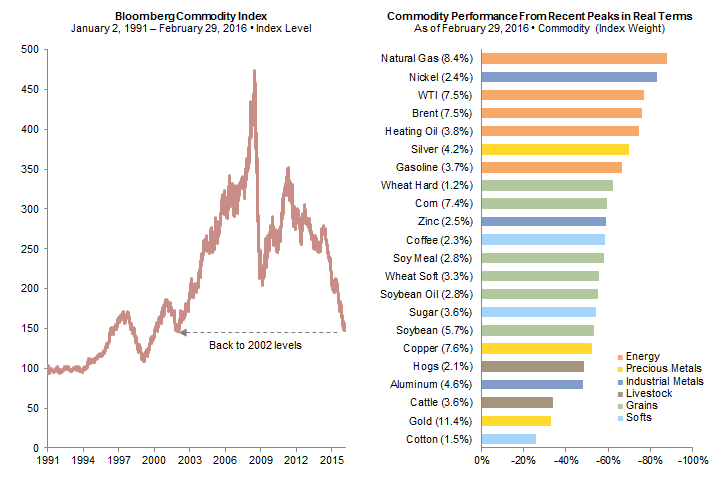
Figure 4. Commodity Performance
Sources: Bloomberg L.P., MSCI Inc., and Thomson Reuters Datastream. MSCI data provided “as is” without any express or implied warranties.
Notes: Bloomberg Commodity Index levels are based on the total return index. Percentages in parenthesis represent the Bloomberg Commodity Index 2016 target weight. Color coding on graph represents commodity groups. Losses for commodities to February 29, 2016, are based on individual peak dates ranging from December 31, 2006, to November 30, 2014.
These facts have contributed to the lengthy duration of what some refer to as the commodity “super-cycle.” Standing at nearly 20 years from the beginning of the upswing to present, researchers Bilge Erten of the United Nations and José Antonio Ocampo of Columbia University argue the duration can be even longer. Of the three non-oil super-cycles they identify since 1894, excluding the present, cycles have ranged from 28 to 39 years.[1]Bilge Erten and José Antonio Ocampo,“Super-cycles of commodity prices since the mid-nineteenth century,” (United Nations Department of Economic and Social Affairs working paper, February 2012), … Continue reading While this cycle’s downturn has been the most severe, that doesn’t preclude prices from falling further. But perhaps more importantly, a bottoming in commodity prices doesn’t imply that a new cycle, with the heady initial gains associated with the last, will commence.
Headwinds Remain
Broadly across commodities, producers have cut production, deferred projects, and slashed capital budgets, and with many commodities priced below long-term inflation-adjusted levels, conditions have improved relative to just a few years ago. But most markets continue to appear over-supplied, and many of the recent production actions, such as project deferrals, have lagged impacts on supply. While structural forces are currently correcting many market imbalances, we lack conviction to think that the glut in supplies will not continue to weigh on prices in the near term.
Consider copper markets. According to the most recently released data from the International Copper Study Group, world mine production is estimated to have increased by around 3.5% in 2015, despite significant mine closures. With global demand estimated to have remained essentially flat during the same period, this year’s rally in copper probably is connected more to the pause in the US dollar’s rally and oil’s rebound than market fundamentals.
Or natural gas markets. The most recently released data from the US Energy Information Administration show natural gas inventories are expected to end the winter heating season this year at a level 54% higher than the same time last year. Natural gas prices are forecast to remain low due to the warmer-than-normal temperatures to start the year, record inventory levels, and sustained levels of production, despite declining rig counts.
Or grain markets. Wheat and coarse grain production may send global stocks for 2015/16 to new multi-decade highs, according to the most recently released data from the US Department of Agriculture and the International Grains Council. Farm yields have increased in recent years as seed technology to fight drought, bugs, and disease have improved, but in agriculture markets, much depends on global weather.
Many commodity futures’ prospects are also inextricably linked to China. Although markets are hopeful that China’s expansionary monetary and fiscal policies will support commodity demand, recent data are less than comforting. China’s factory activity, freight traffic, and exports are all slowing, not to mention its GDP (Figure 5). Even if China continues to grow at a reasonable pace, growth is likely to increasingly come from services and consumption, rather than manufacturing and investment, reducing demand growth for many commodities, particularly base metals.
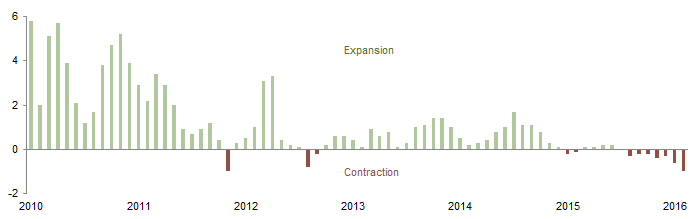
Figure 5. China’s Factory Activity
January 1, 2010 – February 29, 2016 • Index Values
Source: FactSet Research Systems.
Notes: Data are monthly and represent the official manufacturing purchasing manager’s index (PMI) less 50. A score below 0 indicates a contraction in the sector, while one above 0 indicates expansion.
Please see Aaron Costello and Jason Widjaja, “What’s Next for the US Dollar?,” Cambridge Associates Chart Book, October 2015, and Aaron Costello, “Is the Strong-Dollar Cycle Over?,” CA Answers, February 23, 2016.
Regardless of the pace of the global economic growth, commodity futures may face US dollar headwinds. With many commodities priced in dollars, the currency’s appreciation may dampen demand through higher prices for non-dollar consumers (Figure 6). While it’s unclear how long the strong dollar cycle will last, we expect it is not yet over, even as the dollar appears to be in a period of consolidation.
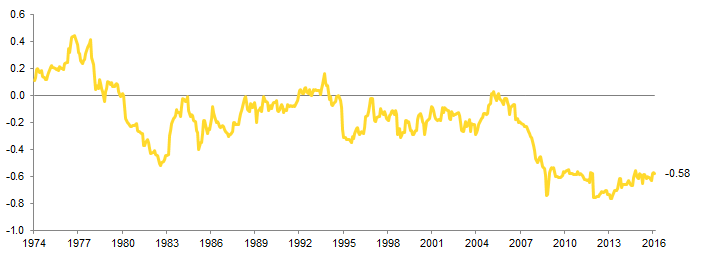
Figure 6. Correlation Between Commodities and US Dollar
December 31, 1974 – February 29, 2016
Sources: Standard & Poor’s and Thomson Reuters Datastream.
Note: Data are monthly and represent the rolling three-year correlation between the S&P GSCI™ Spot Index and the US Dollar DXY Index.
Portfolio Context
Please see Eric Winig and Meagan Nichols, “Time to Get Real About Real Assets,” Cambridge Associates Research Report, 2014.
Investors often allocate to commodity futures for reasons beyond return prospects, including the asset class’s inflation-hedging potential and role as a diversifier. Investors do need to consider how a sharp, unanticipated, and sustained spike in inflation, à la the 1970s in the United States and the United Kingdom or the late 1980s and early 1990s in Brazil, could impact their portfolios. But, as we noted in a recent publication, investors should continue to factor in return prospects in making an allocation decision.
Because commodity prices make up a substantial percentage of most consumer price indexes, commodities are an obvious choice to hedge inflation risk. But even if commodity prices are likely to rise along with consumer prices, they may not deliver significant real returns to a portfolio. For instance, in the 1970s, the S&P GSCI™ Spot Index held up well with inflation, delivering a 9% annual return. But after adjusting for inflation, the real annual return falls to a measly 1.6%.
Still, the S&P GSCI’s measly real spot price return easily outstripped US equities—the MSCI US price index fell 6.5% annually during the decade. While that outperformance is significant, commodity futures underperformance in the years following is also relevant. From 1980 to present, the same commodity benchmark’s real spot price lost 2.4% annually, while the equity index gained 4.9% annually. Considering the period from 1980 to present includes just over 36 years, a consistent allocation would have been quite the toll to pay to protect against an inflationary spike.
Investors should also scrutinize commodity futures’ role as a portfolio diversifier. In the years since the global financial crisis, correlations between commodities and US equities have been consistently positive and elevated relative to the prior period (Figure 7). In addition to higher correlations between commodities and equities, commodities have also become more correlated to each other (Figure 8). While correlations do shift through time, as these charts show, investors holding a commodity futures allocation should consider how its diversification potential may have changed and whether the allocation can deliver the desired diversification going forward.
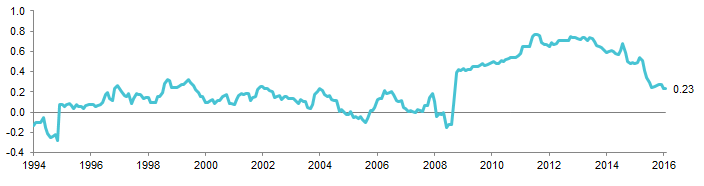
Figure 7. Correlation Between Commodities and US Equities
January 31, 1994 – February 29, 2016
Source: Bloomberg L.P. and Thomson Reuters Datastream.
Note: Data are monthly and represent the rolling 36-month correlation between the Bloomberg Commodity Spot Index and the S&P 500 Price Index.
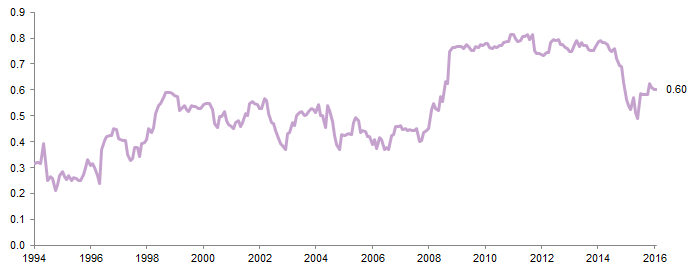
Figure 8. Correlation Among Commodities
January 31, 1994 – February 29, 2016
Sources: Bloomberg L.P. and Thomson Reuters Datastream.
Note: Data are monthly and represent the rolling median 36-month correlation between the Bloomberg Commodity Spot Subindexes and the Bloomberg Commodity Spot Index.
Signposts of Change
Deciding to allocate to commodity futures is not an easy task—it requires a close scrutiny of fundamentals across multiple markets. Even with a careful review, valuation techniques are limited by the fact the asset class doesn’t generate cash flows like traditional companies. These realities reinforce our position that investors should be cautious in making an allocation decision, waiting instead for clear signposts suggesting the sector is likely to be undersupplied.
As discussed, market forces are currently correcting imbalances in many commodity markets through production cuts, project deferrals, and capital budget reductions, and while this is a positive sign suggesting markets are healing, it doesn’t necessarily suggest commodity markets will be undersupplied. When global commodity demand does outstrip supply levels, investors are likely to see inventory levels fall and production utilization rates rise, both of which should set the stage for spot price increases and a moderation in the roll-yield drag.
At that stage, investors wanting to allocate to commodity futures should consider active management and dynamic indexes, in addition to the broadly followed benchmarks. Active management often attempts to outperform a benchmark through the dynamic weight of a sector or commodity based on views of its attractiveness. Dynamic indexes, like many active managers, seek to add value by selecting futures contracts on the futures curve, rather than simply using the most liquid nearby contracts, and employing momentum indicators to select and weight futures contracts. While active managers and dynamic indexes tend to deliver better risk-adjusted returns, the more dissimilar a strategy looks from its benchmark, the greater the tracking error.
Concluding Comments
Commodities’ incredible descent since 2008 has sent benchmarks back to levels not seen in years and brought prices for many below long-term inflation-adjusted levels. Still, strong headwinds face the sector, including multiple oversupplied commodity markets, possible waning global demand, and a potential strengthening in the US dollar. These headwinds limit our conviction level that spot returns will generate healthy returns, particularly if those returns would have to compensate for a net negative drag from collateral and roll yields. The prudent investor would benefit from patience, waiting for stronger indications to enter the sector or rebalance.
Kevin Rosenbaum, Investment Director
Joe Comras, Investment Associate
Footnotes