Though the risk from rising rates is potentially higher in Australia than elsewhere given household debt levels and the state of the housing market, we judge the risks and outlook as balanced and advise investors to remain neutral on equities and risk.
- The positive momentum underpinning the global economy looks set to continue in 2018. However, continued growth may see inflation start to rise back to normal levels across developed markets. This should drive interest rates higher. Although rising rates alone will not derail the global economy, they could trigger a rise in market volatility.
- For Australia, the risk from rising rates is higher than elsewhere given household debt levels and the state of the housing market. Indeed, we may be at the tipping point, with the Reserve Bank of Australia (RBA) facing the choice to stay put or follow US rates higher.
- Ultimately, we judge the risks to the outlook as balanced, and advise investors to remain neutral on equities and risk despite the growing bullishness of the consensus.
Surprises abounded in 2017. The year began with optimism over the so-called reflation trade spurred on by the election of Donald Trump as president of the United States. The consensus view was that fiscal stimulus in the United States would help boost global growth and inflation, resulting in rising bond yields, a strong US dollar, and the outperformance of value versus growth stocks, both in the United States and globally. At the same time, Europe seemed poised to elect populist anti-EU parties, while emerging markets appeared on a collision course with Trump’s protectionist campaign promises.
In reality, quite the opposite happened; the Trump administration was hamstrung for most of the year, Europe didn’t implode, inflation failed to appear, bond yields moved lower, the US dollar tanked, growth trounced value, and EM assets soared. Global stock markets did post strong returns for the year, but this was driven by evidence of synchronised global growth and low inflation, not reflation.
For 2018, the consensus outlook calls for a continuation of recent trends—synchronised global growth, low inflation, and accommodative central banks will drive another year of equity gains amid USD weakness. If anything, optimism is higher than last year, as the cloud of political risks in Europe and the United States hovered over much of 2017. Today, there are few clouds on the horizon, at least as far as 2018 is concerned. Yes, there are Italian elections scheduled for March, and US mid-term elections in November (and perhaps Australian elections at some point), but none of these pose systemic risks (for now at least). North Korea remains a risk, but that has always been the case.
However, we may be approaching a tipping point; 2018 may finally see inflation across the developed world start to return to normal, and with it expectations for central bank tightening and rising bond yields. Though markets may take this in stride, rising rates could also serve as the trigger for increased market volatility, setting the stage for a slowdown in global growth in 2019.
Please see our ‘Outlook 2018: Stick Around for Dessert’, Cambridge Associates Research Report, December 2017.
Overall, current conditions suggest the global market rally may continue, however, we warn investors to not become complacent about risk given elevated valuations for many asset classes. We advise investors to remain neutral on equities and risk in general, underweight duration and credit, and look for opportunities in more niche and illiquid strategies.
The RBA and the Property Market
The positive global backdrop is also reflected in Australia. Real GDP growth is expected to rise to 2.8% in 2018, up from an already respectable 2.30% forecast for 2017. This is driven in part by expectations that the rebound in business investment will offset the drag from falling housing investment, and that consumption will remain supported by an improving labour market and firming wages.
Inflation is expected to remain in check, rising to 2.2% from the current 2.0% (Figure 1). This would keep inflation inside the RBA’s target range of between 2% and 3%. However, this return to target is not expected to result in the RBA meaningfully tightening monetary policy, with consensus forecasts seeing the cash rate rise from 1.50% to 1.70% (i.e., one hike).
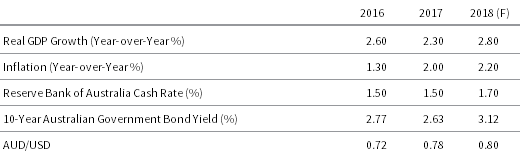
FIGURE 1 AUSTRALIA ECONOMIC INDICATORS
As at 9 January 2018
Source: Bloomberg L.P.
Note: Real GDP growth and inflation figures for 2017 are forecast, as are all 2018 figures.
This is in contrast to the US Federal Reserve, which has indicated plans to hike rates three times in 2018, bringing the Fed Funds rate to a consensus-estimated 2.20% by year end. If so, this would take policy rates in the United States 50 basis points above those in Australia, something not seen since 2000 (Figure 2).
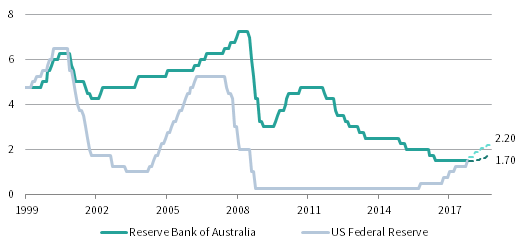
FIGURE 2 CENTRAL BANK POLICY RATES
31 March 1999 – 31 December 2018 • Percent (%)
Sources: Bloomberg L.P., Federal Reserve, Reserve Bank of Australia, and Thomson Reuters Datastream.
Note: Dashed lines represent forecasts and are based on the weighted average Bloomberg consensus estimates.
The reluctance of the RBA to follow the Fed higher in 2017 and 2018 stems from the fact that although the US economy may be firing on all cylinders and will receive a boost from recently passed tax cuts; Australia looks likely to lose one of its engines in the form of contracting housing investment; and a property market that may have peaked. Official data from September 2017 show a weakening in house prices in Sydney and nationally (albeit the former largely driving the latter) (Figure 3). Property-related activity has been key to helping offset the impact to the economy from the slowdown in mining-related investment and weaker commodity prices. While there are other bright spots in the non-mining economy, rising mortgage payments would put additional pressure on a household sector that is still dealing with lackluster wage growth. Some of the weakness in the housing market is related to the RBA’s macro-prudential measures, which have tightened lending to this sector without the need to hike policy rates. But overvaluation and growing signs of oversupply in Sydney and Melbourne leave the housing market very vulnerable, which certainly influences the RBA’s outlook.

FIGURE 3 AUSTRALIA REAL HOUSE PRICE INDEX
31 March 2003 – 30 September 2017 • 31 December 2011 = 100
Sources: Australian Bureau of Statistics and Thomson Reuters Datastream.
Notes: The Australia National House Price Index is calculated as the weighted average of the eight capital cities, namely Adelaide, Brisbane, Canberra, Darwin, Hobart, Melbourne, Perth, and Sydney.
A dovish RBA in the face of a hawkish Fed does not sound like a supportive environment for the Australian dollar. Yet, consensus forecasts see the Australian dollar rising slightly in 2018 versus the US dollar, following last year’s 8.0% gain (Figure 4). This disconnect may stem from the consensus view of continued broad-based USD weakness in 2018, given that Fed hikes in 2017 did little to support the greenback, and skepticism that the Fed will hike beyond 2018. However, a rebound in the US dollar may be one of the surprises in 2018. Unlike this time last year, the market is bearish and net-short the US dollar. Should the US economy remain resilient—let alone accelerate—in 2018, skepticism over future rate hikes may dissipate, helping drive the greenback higher. US rates moving above AU rates has historically seen Australian dollar weakness, such as during the 1999–2002 period. Though Australia’s terms of trade are much higher today than during that period (suggesting a higher level of the AUD/USD rate is justified), the Australian dollar looks slightly expensive on a real exchange rate basis, adding to its vulnerability. Thus, we continue to advocate investors remain partly unhedged.
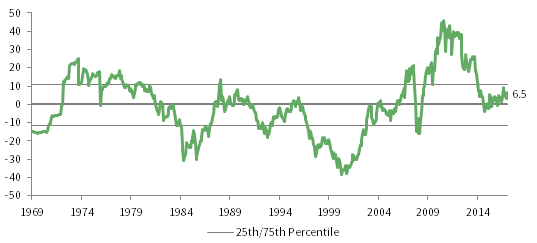
FIGURE 4 AUD/USD REAL EXCHANGE RATE
31 December 1969 – 31 December 2017 • Percent from Median (%)
Sources: Australian Bureau of Statistics, MSCI Inc., Thomson Reuters Datastream, US Department of Labor – Bureau of Labor Statistics. MSCI data provided ‘as is’ without any express or implied warranties.
Notes: Australia inflation data as of 30 September 2017. US inflation data as of 30 November 2017.
And what if the RBA decides to turn hawkish and follow the Fed higher? One would assume this would occur because growth conditions in Australia are better than expected, however, the headwind of rising rates on the housing market and consumer spending might still take the wind out of the sails of the Aussie dollar. The case for Australian dollar strength is therefore more reliant on commodity prices (Figure 5).

FIGURE 5 RBA INDEX OF COMMODITY PRICES
31 December 1983 – 31 December 2017 • Year-over-Year Percent (%)
Sources: Reserve Bank of Australia and Thomson Reuters Datastream.
Please see Aaron Costello and Han Xu, ‘Australia Outlook 2017: Reflation to the Rescue‘, Cambridge Associates Research Note, January 2017.
Last year’s better-than-expected growth in China helped support commodity prices and the rally in emerging markets asset classes. In last year’s outlook, we noted that the Australian dollar had uncharacteristically not followed the rise in the RBA’s index of Australia commodity prices, which meant a rebound might be in store. The picture is reversed this year, with the Australian dollar rising despite a decline in the RBA index. While this could be a temporary disconnect, as global growth could drive commodity prices higher, China has once again put the brakes on its economy by tightening monetary policy and implementing other measures to cool property markets in major cities. Thus, Chinese demand for raw materials may not be as robust this year, another factor being watched by the RBA.
Overall, we find the global economic backdrop as benign for now. At some point, robust growth will translate into inflation rising back toward normal levels, which will prompt continued normalisation of global interest rates. This was expected to be the case last year, but 2018 may very well be the tipping point. However, we judge that rising rates will not pose too much of a headwind for most major economies in 2018, but risks will rise heading into 2019 as monetary policy may become restrictive. This is especially the case for Australia, given the vulnerability of the housing market. The RBA will have to choose whether to follow the Fed or not, and if the RBA remains dovish in the face of rising global rates, expect the Australian dollar to come under pressure.
Equities: Can Australia Catch up?
The S&P/ASX 200 returned 11.8% in 2017. Yet, returns could have been much better; lackluster gains for the financials (4%) and real estate (4%) sectors and losses in the telecom sector (-21%) offset stronger gains in other sectors. This resulted in Australian equities underperforming global equities last year, both in local currency and AUD terms, despite the rally in the Aussie dollar (Figure 6).
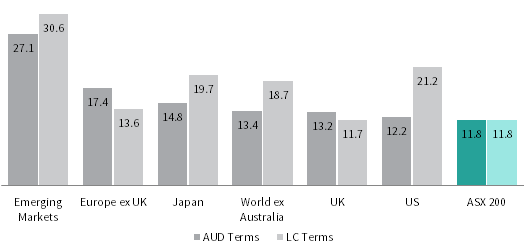
FIGURE 6 PERFORMANCE OF GLOBAL EQUITIES
31 December 2016 – 31 December 2017 • Percent (%)
Sources: MSCI Inc., Standard & Poor’s, and Thomson Reuters Datastream. MSCI data provided ‘as is’ without any express or implied warranties.
Note: Total return data for all MSCI indexes are net of dividend taxes.
Last year we recommended overweighting non-US developed markets equities and EM equities at the expense of the US equities, given valuation concerns for the latter. This only partly worked out; EM equities indeed had a great year, but so did US equities. Arguably the outperformance of both markets was due in part to stellar returns for technology stocks, with Chinese tech giants Tencent and Alibaba nearly doubling in 2017, and the FAANGs[1]FAANGs refers to Facebook, Amazon, Apple, Netflix, and Google. in the United States still leading the charge.
We also thought Australian equities were poised for outperformance given the momentum of the reflation trade. This failed to materialise, although the S&P/ASX Resources 200 Index generated a 26% return in 2017, following on 2016’s 42% return. Indeed, while resources stocks have staged a comeback, the poor performance of the major banks has overshadowed returns elsewhere in the market and has kept the S&P/ASX 200 below its 2007 peak.
Will 2018 be a break-out year for Australian equities? No, unfortunately. Concerns over the housing market will continue to weigh on the banks, making it difficult for Australia to outperform. Valuations are also starting to become a concern. At 18.2, our normalised P/E metric has risen near the edge of our overvaluation range (Figure 7). A move above 18.5 would put valuations above the 75th percentile and near the previous market peaks in 2010 and 2015. Though the market is far from the very overvalued levels seen in 2007, it is hard to see it going back to such levels without a massive re-rating of the major banks, something we see as unlikely.
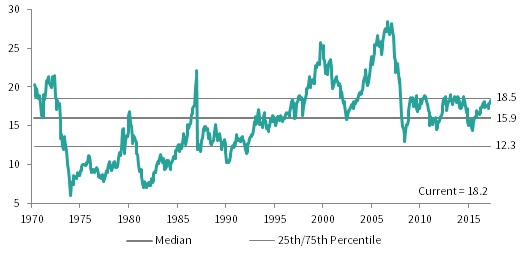
FIGURE 7 MSCI AUSTRALIA ROE-ADJUSTED P/E
31 December 1970 – 31 December 2017
Sources: MSCI Inc. and Thomson Reuters Datastream. MSCI data provided ‘as is’ without any express or implied warranties.
Still, in a global context AU equities are reasonably priced and we are neutral on the market. By our metrics, global equities are 30% overvalued, versus 14% for Australian equities (Figure 8). Excluding US equities, developed markets valuations are only 11% above historical median. EM equities also remain attractively priced despite last year’s strong gains (a result of the cheap market and healthy earnings). As a result, we continue to recommend tilting toward non-US and EM equities at the expense of US equities. This is especially the case because the technology sector in the United States is unlikely to benefit much from recent corporate tax cuts. These companies already pay a below-average tax rate as a result of their offshore earnings, which face a repatriation penalty. Regulatory headwinds are rising for the technology sector, partly because of its high profitability.
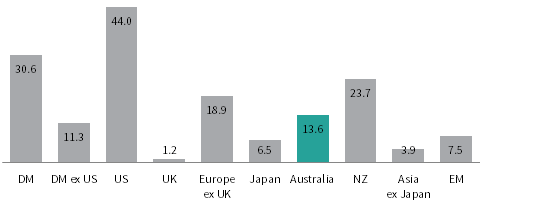
FIGURE 8 MSCI ROE-ADJUSTED P/E % DEVIATION FROM HISTORICAL MEDIAN
As at December 31, 2017
Sources: MSCI Inc. and Thomson Reuters Datastream. MSCI data provided ‘as is’ without any express or implied warranties.
Note: DM valuation is the weighted average of US, UK, Europe ex UK, Japan, Australia, Singapore, Hong Kong, Canada, Israel, and New Zealand valuations. DM ex US valuation is the weighted average of UK, Europe ex UK, Japan, Australia, Singapore, Hong Kong, Canada, Israel, and New Zealand valuations.
We also expect value strategies to come back into favour. Though the timing of this is uncertain (and perhaps does not occur until after the next recession), we still think investors should begin to position for a change in equity market leadership.
In general, we expect the global equity rally to lose steam in 2018. A correction is inevitable, and rising rates may be the catalyst. With that said, rising earnings should offset any multiple contraction, with the net result of modest equity gains. Of course, any number of shocks could hit markets and disturb the unusually low level of volatility seen last year. Still, the odds of a bear market unfolding in 2018 seem low, but rise heading into 2019.
Fixed Income: Return to Normal?
Australian government bonds returned 3.49% in 2017, outperforming bank bills (Figure 9). Yields fell for much of the year after surging in late 2016, however, they began to grind higher in the second half of the year. Falling yields were a global trend, but Australian bonds outperformed global bonds thanks to their yield advantage. This was the case even after accounting for the positive carry from FX hedging.
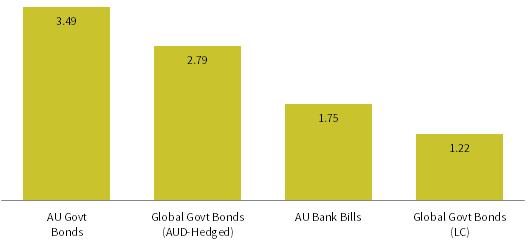
FIGURE 9 PERFORMANCE OF GLOBAL BONDS
31 December 2016 – 31 December 2017 • Total Returns • Percent (%)
Sources: Bloomberg L.P., Citigroup Global Markets, and Thomson Reuters Datastream.
Current yields still seem out of line with an economy growing 5% in nominal terms, as historically nominal bond yields have followed nominal GDP growth. The divergence of yields in recent years from what domestic fundamentals suggest reflects the low level of yields globally and the anchoring of cash yields at 1.50% by the RBA (Figure 10). To the extent we have indeed reached a tipping point for global growth and inflation, bond yields in Australia remain at risk, given their recent correlation with global yields. We continue to advise investors to be underweight duration by holding a mix of bonds and cash. Yet with the risks facing the Australian economy from the housing market, holding some fixed income remains prudent.
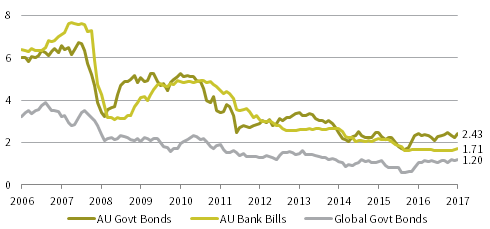
FIGURE 10 GLOBAL GOVERNMENT BOND YIELDS
31 December 2006 – 31 December 2017 • Percent (%)
Sources: Bloomberg L.P., Citigroup Global Markets, and Thomson Reuters Datastream.
We find global fixed income even more unattractive, with the Citigroup World Government Bond Index yielding a measly 1.20%. While hedging adds a modest level of extra yield, we see the risk-reward trade-off for global bonds as worse than Australian bonds, especially with the higher duration of European and Japanese bonds today given near-zero yields.
In general, we find most global fixed income segments unattractive. Credit spreads are below historical median for most sectors. Some relative value can be found in leveraged loans and structured credit funds in the United States. Private credit strategies have seen an influx of capital, and are also starting to appear frothy in the United States and Europe. While higher risk, private credit/special situation funds in Asia still offer compelling opportunities for those willing to take liquidity risk. There are also select opportunities in Australia to provide private credit to real estate–related investments as a result of recent restrictions placed on domestic banks by the RBA.
Conclusion
The positive momentum underpinning the global economy looks set to continue in 2018. Unlike last year, however, continued growth may see inflation start to rise back to normal levels across developed markets. This should drive both policy rates and bond yields higher. Although rising rates alone will not derail the global economy, they could trigger a rise in market volatility.
For Australia, the risk from rising rates is potentially higher than elsewhere, given household debt levels and the state of the housing market. Indeed, we may be at the tipping point, with the RBA facing the choice to stay put or follow US rates higher.
Ultimately, we judge the risks to the outlook as balanced, and advise investors to remain neutral despite the growing bullishness of the consensus. Indeed, an alternative narrative of a ‘melt-up’ in global equities is circulating. This sees the long-awaited rotation from bonds into equities as investor pessimism finally gives way to optimism. Such an outcome is possible, however, we advise investors not to blindly chase markets higher.
We remain neutral on equities, favouring non-US and EM equities over US equities. We suggest remaining underweight duration and credit in fixed income portfolios because of the risk of rising rates, while exploring select opportunities in more illiquid strategies. Finally, we advise investors remain partially unhedged as a protection against downward pressure on the Australian dollar.
Aaron Costello, Managing Director
Han Xu, Investment Associate
Index Disclosures
Australia National House Price Index
The Australia National House Price Index is calculated as the weighted average of the eight capital cities, namely Adelaide, Brisbane, Canberra, Darwin, Hobart, Melbourne, Perth, and Sydney.
Bloomberg AusBond Treasury Index
The Bloomberg AusBond Treasury Index measure the performance of a segment of the Australian bond market composed of fixed income securities issued by the Australian Treasury.
Bloomberg AusBond Bank Bill
The Bloomberg AusBond Bank Bill Index measures the Australian money market by engineering a passively managed short-term money market portfolio. This index is composed of 13 synthetic instruments defined by rates interpolated from the RBA 24-hour cash rate, 1M BBSW, and 3M BBSW.
Citigroup World Government Bond Index
The Citigroup World Government Bond Index is composed of issues of the government bond markets of the United States, Japan, Germany, France, the United Kingdom, Canada, Italy, Australia, Belgium, Denmark, the Netherlands, Spain, Sweden, and Austria, and measures total return performance for government bond markets with a remaining maturity of at least one year.
MSCI AC (All Country) Asia ex Japan Index
The MSCI AC (All Country) Asia ex Japan Index is a free float–adjusted, market capitalisation–weighted index that is designed to measure the equity market performance of Asia, excluding Japan. The MSCI AC Asia ex Japan Index consists of the following ten developed and emerging markets country indexes: China, Hong Kong, India, Indonesia, Korea, Malaysia, Philippines, Singapore, Taiwan, and Thailand. It covers approximately 85% of the free float–adjusted market capitalisation in each country.
MSCI Australia Index
The MSCI Australia Index is a free float–adjusted, market capitalisation–weighted index designed to measure large- and mid-cap equity market performance of Australia. The index covers approximately 85% of the free float–adjusted market capitalisation in Australia.
MSCI Emerging Markets Index
The MSCI Emerging Markets Index is a free float–adjusted, market capitalisation–weighted index designed to measure large and mid-cap equity market performance of emerging markets. As of January 2016, the index includes 23 emerging markets country indexes: Brazil, Chile, China, Colombia, Czech Republic, Egypt, Greece, Hungary, India, Indonesia, Korea, Malaysia, Mexico, Peru, the Philippines, Poland, Qatar, Russia, South Africa, Taiwan, Thailand, Turkey, and the United Arab Emirates. The index covers approximately 85% of the free float–adjusted market capitalisation in each country.
MSCI Europe ex UK Index
The MSCI Europe ex UK Index captures large- and mid-cap equity market performance across 14 developed markets countries in Europe. The country indexes included are: Austria, Belgium, Denmark, Finland, France, Germany, Ireland, Italy, the Netherlands, Norway, Portugal, Spain, Sweden, and Switzerland. The index covers approximately 85% of the free float–adjusted market capitalisation of European developed markets, excluding the United Kingdom.
MSCI Japan Index
The MSCI Japan Index is a free float–adjusted, market capitalisation–weighted index that is designed to measure the large- and mid-cap equity market performance of Japan. The index covers 85% of the free float–adjusted market capitalisation in Japan.
MSCI New Zealand IMI Index
The MSCI New Zealand Investable Market Index (IMI) is designed to measure the performance of the large-, mid-, and small-cap segments of the New Zealand market. The index covers approximately 99% of the free float–adjusted market capitalisation in New Zealand.
MSCI UK Index
The MSCI UK Index is a free float–adjusted, market capitalisation–weighted index that is designed to measure the large- and mid-cap equity market performance of the United Kingdom; the index covers 85% of the free float–adjusted market capitalisation in the United Kingdom.
MSCI US Index
The MSCI US Index is a free float–adjusted, market capitalisation–weighted index that is designed to measure the large- and mid-cap equity market performance of the United States. The index covers approximately 85% of the free float–adjusted market capitalisation in the United States.
MSCI World ex Australia Index
The MSCI World ex Australia Index captures large- and mid-cap representation across developed markets countries. The index covers approximately 85% of the free float–adjusted market capitalisation available to foreign investors across developed markets, excluding Australia. The country indexes included are: Austria, Belgium, Canada, Denmark, Finland, France, Germany, Hong Kong, Ireland, Israel, Italy, Japan, the Netherlands, New Zealand, Norway, Portugal, Singapore, Spain, Sweden, Switzerland, the United Kingdom, and the United States.
MSCI World Index
The MSCI World Index represents a free float–adjusted, market capitalisation–weighted index that is designed to measure the performance of the large- and mid-cap segments of developed markets. As of December 2017, it includes 23 developed market country indexes: Australia, Austria, Belgium, Canada, Denmark, Finland, France, Germany, Hong Kong, Ireland, Israel, Italy, Japan, Netherlands, New Zealand, Norway, Portugal, Singapore, Spain, Sweden, Switzerland, the United Kingdom, and the United States. The index covers approximately 85% of the free float-adjusted market capitalisation in each country.
RBA Index of Commodity Prices
The RBA Index of Commodity Prices is a weighted arithmetic average based on the prices of major commodities exported by Australia, and is intended to provide a timely indicator of the prices received by Australian commodity exporters.
S&P/ASX 200 Index
The S&P/ASX 200 Index is a free float–adjusted, market capitalisation–weighted equity index that covers 80% of market capitalisation in Australia available to domestic investors.
S&P/ASX Resources 200 Index
The S&P ASX Resources 200 Index is a sector sub-index of the S&P/ASX 200 Index. It provides exposure to the resources sector of the Australian equity market as classified as members of the GICS® resources sector. Resources are defined as companies classified in the energy sector (GICS® Tier 1), as well as companies classified in the metals & mining industry (GICS® Tier 3).
Footnotes