A subdued growth outlook and increased volatility for many asset classes mean investors should be cautious in 2015
- We continue to have concerns about the Australian macro environment and expect muted growth and inflation in Australia. China’s rebalancing economy is a top concern for Australia, combined with uncertainties in the domestic economy.
- Fair valuations and a high dividend yield for Australian equities keep us neutral on the asset class. Asian and European equities are more attractive than US equities. Australian investors should maintain exposure to domestic fixed income given the higher probability of a weaker economy.
- The outlook for the Australian dollar is a big question mark for Australian investors. Should there be further weakness in commodity prices, the Australian dollar will face downside pressure. The currency will remain weak versus the US dollar but not necessarily against others.
Most asset classes posted positive returns in 2014, a year dominated by three interrelated themes: deflation, commodities, and the US dollar. Deflation concerns in Europe helped drive global bonds lower and turbo-charged the returns of yield-sensitive assets, such as REITs. Commodities also added to the deflationary impulse, with prices for oil and industrial commodities tumbling given oversupply and slowing demand from China. Finally, a rising US dollar amid a US economic recovery and potential monetary tightening rocked currency and commodity markets.
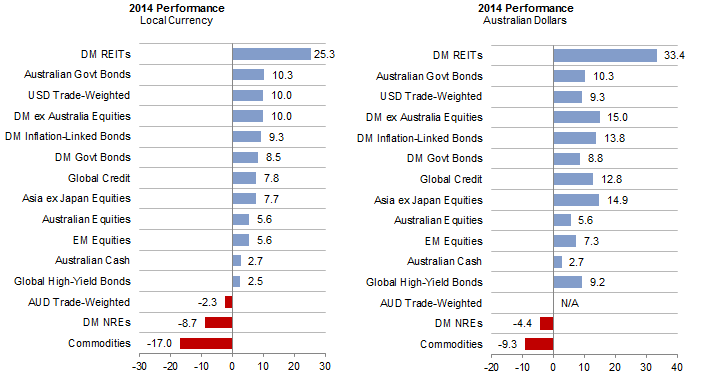
Unfortunately, Australia was in the crosshairs of all three trends: the Australian dollar tumbled and Australian equities lagged global markets given exposure to commodities, while Australian government bonds rallied strongly. When adjusted for movements in the Australian dollar, 2014 was a good year to hold unhedged offshore assets (Figure 1). So far in 2015, these three themes continue to drive markets, with the added twist of global central banks, including the Reserve Bank of Australia (RBA), being forced to respond to deflation and currency concerns.
What does this mean for Australia-based investors? For 2015, we continue to be cautious on the outlook for the Australian economy and the Australian dollar, though we are neutral on Australian equities and fixed income. We still suggest investors tilt toward foreign equity exposures and especially non-US markets at the expense of US equities. We suggest investors remain long the US dollar, while considering hedging some portion of non-US equity exposures. Finally, we continue to recommend maintaining exposure to Australian government bonds despite their overvaluation as yields are still attractive versus global bonds.
Australia Faces Headwinds to Growth and Inflation
See Aaron Costello et al., “China: Prepare for Stress,” Cambridge Associates Research Note, October 2014.
We remain concerned that the non-mining economy in Australia will be unable to offset increasing weakness in the mining sector. Mining capital expenditures peaked in 2012 and have been falling alongside iron ore prices as the Chinese economy attempts to shift from investment-driven to consumption-driven growth (Figure 2). Mining investment will continue to slow sharply because of the steep fall in iron ore prices in 2014. Given our concerns over the growth outlook for China, we do not expect a rebound in Chinese demand and view the decline in iron ore prices as largely structural, not cyclical.

Figure 2. Capital Expenditures of Australian Miners and Real Iron Ore Prices
Fourth Quarter 1986 – Fourth Quarter 2014
So far, the Australian economy has not been greatly affected by the slowdown in mining investment. This is because interest rate cuts by the RBA since 2011 have allowed consumers to borrow more and maintain spending, while the housing sector boomed as mortgages became more affordable (and foreign investor interest remained high), driving up construction activity and house prices. The combination of low rates and construction activity helped real GDP growth bounce from 2.2% at year-end 2013 to a forecasted 2.5% in 2014, with consensus expectations for GDP growth to pick up to 3% by year-end 2015 and reaching 3.2% by mid-2016 (Figure 3). Inflation is also forecasted to increase to 2.9% by the middle of 2016.
However, we question how sustainable this forecast recovery will be, especially as the mining economy remains under pressure and is increasingly spilling over to the non-mining economy. Real wage growth is currently stagnant at close to 0% and unemployment continues to move up. With household debt at record highs, the re-leveraging of the consumer seems near an end. At the same time, house prices are no longer growing as quickly (except in Melbourne and Sydney), and purchases are mostly coming from investors (rather than first-time buyers). The likely introduction of macro-prudential measures such as increasing down payments or restricting lending may further reduce the appeal of Australian housing. Meanwhile, the fall in the price of oil has also hit liquid natural gas prices, a sector that many hoped would cushion the blow from falling iron ore prices. Thus, Australia will benefit less from the decline in oil prices than other economies.
The RBA seems to share this concern, cutting the policy rate from 4.75% in 2011 to 2.25% in early February. Given the headwinds facing Australian growth and inflation, we would not be surprised to see the RBA lower rates further. While lower rates and a weaker Australian dollar may help boost the economy in the near term, our central case remains that growth and inflation stay muted. Although a “hard landing” in China and Australia is not our base case for 2015, the odds are increasing that Australia will experience a recession in the intermediate term.
Question Marks for the Australian Dollar
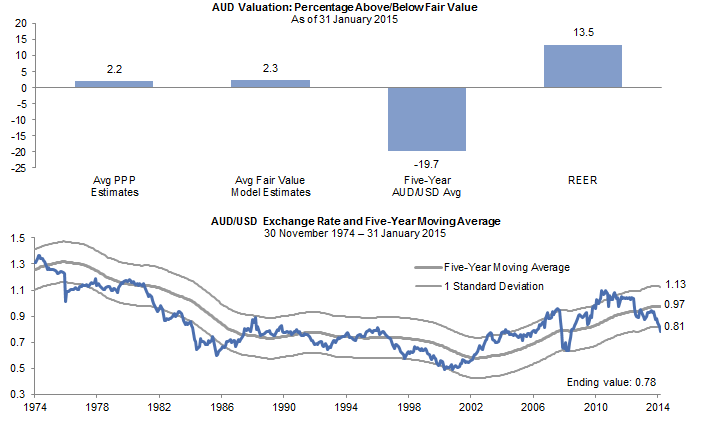
The Australian dollar continues to weaken, falling 8.5% versus the US dollar in 2014 and nearly 5% so far in 2015. Given the 20% decline in the Australian dollar over the past two years, the outlook for the currency is not so clear cut.
The Australian dollar no longer appears expensive versus the US dollar and appears oversold in the near term (Figure 4). Still, we expect the Australian dollar to remain weak versus the US dollar over the intermediate term. The currency clearly faces more downside should the RBA be forced to cut rates further, while additional weakness in China and commodity prices will weigh on the Aussie. The RBA has also expressed its desire for a weaker currency, with Governor Glenn Stevens suggesting AUD/USD 0.75 is an “appropriate” level for the currency, implying at least a 3.5% downside from current prices of 0.78. Thus, while the bulk of the currency adjustment has taken place, an overshoot cannot be ruled out due to a generally strong US dollar.
Yet, relative to other developed markets currencies, the outlook for the Australian dollar is more cloudy. In 2014 the Australian dollar only fell 2.3% on a trade-weighted basis, as the currency rose 4% against the euro and yen. As a result, the Australian dollar still looks a bit expensive on a trade-weighted “real effective exchange rate” basis. While valuations are still elevated, with most countries actively combating deflation through rate cuts and quantitative easing programs, the Australian dollar is unlikely to sell off sharply versus non-US currencies, and Australia’s relatively high yields provide some support. Overall, we see the Australian dollar remaining weak against the US dollar but not necessarily against others.
Australian Equities Are Fairly Valued, But Earnings Are Under Pressure
Australian equities returned 5.6% in 2014, heavily underperforming other developed markets in both local currency (10%) and AUD terms (15%). Bifurcation in sector returns reflected the bifurcated economy as commodity-related sectors heavily underperformed while non-mining sectors generally did well.[1]In 2014, the ASX200 Resources Index returned -16.4%, while the ASX200 Industrials Index returned 11.4%.
Surprisingly, earnings growth was robust last year at 14.4%, helping to offset a reduction in price-earnings multiples. For 2015, the consensus expects Australian earnings growth to be much lower at 2.8%, with further earnings pressure for miners and only modest earnings growth for banks. Given our expectations of weak economic growth in Australia, we agree that earnings for Australian companies will be muted. Banks (which account for 37% of the market) face headwinds from regulatory requirements and the uncertain outlook for the housing market. Mining stocks (12% of the market) appear cheap, and could surprise to the upside amid cost-cutting measures and a cheaper Australian dollar, although we are not particularly bullish on the sector’s prospects.
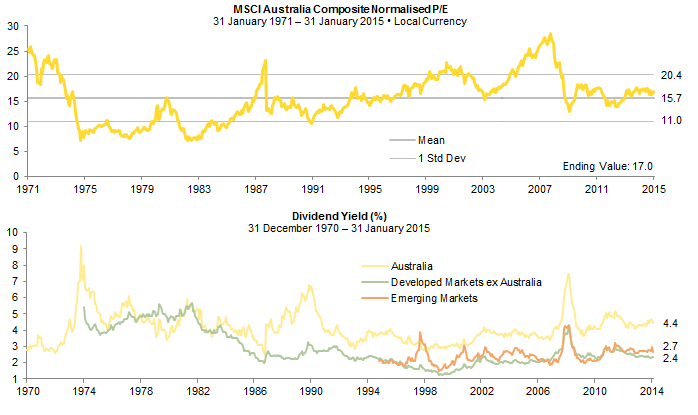
Overall, we are neutral on Australian equities. The asset class is still fairly valued but given a strong performance so far in 2015 (~9.5%), it is moving toward the high end of our fair value range. While dividend yields are high relative to other markets (Figure 5), we do not see a compelling reason to overweight the market. On a relative basis, Australia is fairly valued versus overall global equities and looks cheap versus US equities, but more expensive relative to most other markets (Figure 6). Given the macro headwinds, we’d need to see lower valuations to become excited about Australian equities. Having said that, active managers may be able to add value by identifying themes with less exposure to mining or the domestic economy.
European and Asian Markets Offer Better Value than US Equities
See Celia Dallas, “VantagePoint,” Cambridge Associates, First Quarter 2015.
For more details, see Wade O’Brien et al., “Five Key Questions for 2015,” Cambridge Associates Research Report, December 5, 2014.
Looking more broadly at equity allocations, given valuation disparities across global equity markets, Cambridge Associates recommends investors underweight US equities in favor of hedged exposures to Japanese and European equities and also overweight Asia ex Japan equities. US underweights hurt last year as the market outperformed most other equities, but headwinds for US equities are becoming stronger amid a stronger dollar and tightening monetary policy. In implementing this advice, Australian investors have two questions to consider:
- Should Australian investors hedge allocations to Japan and Europe?
- Will an overweight to Asia ex Japan equities expose Australian investors to too much China risk?
Hedge Exposure to European and Japanese Equities? Quantitative easing in Europe and Japan makes it difficult to determine how the Australian dollar will fare against the yen and euro. The yen and the euro could continue weakening versus the Australian dollar since the Bank of Japan and European Central Bank have been much more aggressive than the RBA. On the other hand, the Australian dollar could weaken if China concerns grow stronger or if the RBA decides to become more aggressive in loosening its monetary policy. Given the uncertainties, we would advise hedging at least a portion of allocations to Europe and Japan. Moreover, Australian investors have the benefit of earning positive carry as interest rate differentials for Australia versus Europe and Japan remain positive (Figure 7).
Too Much China Risk in an Asia ex Japan Overweight? Cambridge now favors Asia ex Japan allocations over allocations to emerging markets broadly given that both markets are at a similar level of undervaluation relative to their own history, while Asian economies are set to benefit more from falling energy and commodity prices and Asian currencies are fundamentally sounder. Yet both Australia and Asia ex Japan have clear economic linkages to China and a Chinese hard landing will have adverse knock-on effects on both.
Small Asia ex Japan overweights make sense for Australia-based investors. First, the lower valuations for Asia ex Japan equities imply that China risks may be more priced in than for Australian equities. Second, Asia ex Japan equities have less exposure to the energy and materials sectors (combined 10%) versus emerging markets equities as a whole (15%) and Australia (20%). Finally, Asia ex Japan currencies may well hold up better (or at least no worse) than the Australian dollar amid a China scare.
Alternatively, Australian investors can focus on domestic demand themes such as India and ASEAN rather than China-related markets and themes in Asia ex Japan and emerging markets. However, investors should keep in mind that such strategies are currently more expensive than emerging markets equities as a whole, and in some cases, Australian equities.
Maintain Exposure to Australian Government Bonds
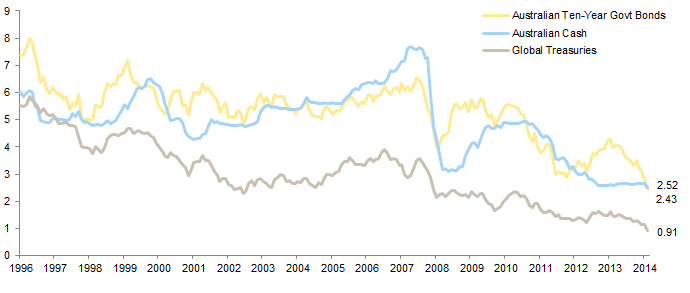
Australian government bonds performed strongly in 2014, returning 10.3% and outperforming developed markets government bonds (8.8%) in AUD terms. Australian yields are now close to their all-time lows, with ten-year Australian government bond yields falling from 4.3% at year-end 2013 to 2.8% at year-end 2014. Yields have fallen a further 40 bps at the end of January 2015. The yield curve is now inverted with bond yields lower than cash yields, while inflation-adjusted “real yields” are back to zero. Thus, we view government bonds as overvalued.
See Jason Widjaja et al., “Australia Outlook 2014: Watch Out for That Transition,” Cambridge Associates Market Commentary, February 2014.
In our outlook last year, we advised investors to hold both Australian cash and government bonds in their defensive fixed income portfolios based on higher yields and a steepening yield curve. Though the environment has changed, we still advocate this positioning. Given our view that Australian growth and inflation will remain subdued and more rate cuts may come, Australian government bonds should provide protection against a recession in Australia. Moreover, Australian yields today are still high relative to other developed markets yields, making Australian government bonds attractive in a yield-starved world (Figure 8).
Strong future performance for Australian fixed income is unlikely given today’s extremely low yields. However, with inflation low and growth an uncertainty, a combination of Australian cash and government bonds should protect investors against economic downturns.
Conclusion
We have been cautious on the Australian macro environment for the past couple of years and continue to expect muted growth and inflation in Australia. China’s rebalancing economy is a top concern for Australia, combined with uncertainties in the domestic economy.
Despite these macro headwinds, fair valuations and a high dividend yield for Australian equities keep us neutral on the asset class. In foreign equities, allocations to Europe and Japan (hedged) and Asia ex Japan are more attractive than US equities. We would advise Australian investors to maintain exposure to domestic fixed income due to the higher probability of a recession or deflation. Allocations should be divided between cash and government bonds given a flat yield curve.
The outlook for the Australian dollar is a big question mark for Australian investors. The currency is no longer expensive against the US dollar but is still elevated versus other currencies. Overall, investors should be long the US dollar and partially hedge other currency exposures.
The coming year looks to be a challenging one as the Australian economic outlook remains subdued while diverging global monetary policies could lead to increased volatility for many asset classes.
Contributors
Jason Widjaja, Senior Investment Associate
Aaron Costello, Managing Director
Exhibit Notes
2014 Performance
Sources: Barclays, Bloomberg L.P., BofA Merril Lynch, Citigroup Global Markets, J.P. Morgan Securities, Inc., MSCI Inc., and Thomson Reuters Datastream. MSCI data provided “as is” without any express or implied warranties.
Notes: “DM REITs” represents the MSCI World REITs Index. “Australian Govt Bonds” represents the Bloomberg AusBond Treasury 0+ Yr Index. “USD Trade-Weighted” represents the J.P. Morgan Trade-weighted USD Index. “DM ex Australia Equities” represents the MSCI World ex Australia Index. “DM Inflation-Linked Bonds” represents the Barclays Global Inflation-Linked Index. “DM Govt Bonds” represents the Citigroup World Government Bond Index. “Global Credit” represents the BofA Merrill Lynch Global Broad Corporate Bond Index. “Asia ex Japan Equities” represents the MSCI All Country Asia ex Japan Index. “Australian Equities” represents the MSCI Australia Index. “EM Equities” represents the MSCI Emerging Markets Index. “Australian Cash” represents the Bloomberg AusBond Bank Bill Index. “Global High Yield Bonds” represents the BofA Merrill Lynch Global High Yield Bond Index. “AUD Trade-Weighted” represents the J.P. Morgan Trade-Weighted AUD Index. “DM NREs” represents the MSCI World Natural Resources Index. “Commodities” represents the Bloomberg Commodity Index.
Capital Expenditures of Australian Miners and Real Iron Ore Prices
Sources: Bloomberg L.P. and Thomson Reuters Datastream.
Notes: Real GDP figure for Q4 2014 based on median analyst forecasts as compiled by Bloomberg. Mining Capex data begin second quarter 1987, with recent figure as of third quarter 2014. Inflation data are as of 31 December 2014.
Australian GDP, Interest Rates, and Inflation
Sources: Bloomberg L.P. and Thomson Reuters Datastream.
Notes: Real GDP data from Q4 2014 onwards are based on median analyst forecasts as compiled by Bloomberg. Inflation data are as of 31 December 2014. Cash rate data on bottom graph are monthly, with current rate as of 3 February to reflect the monetary policy change. Between December 31, 1989, and October 31, 1991, RBA cash rates ranged from 9.5% to 18% and are not shown for reasons of scale.
Australian Dollar Valuations
Sources: Bank for International Settlements, The Economist, Goldman, Sachs & Co., International Monetary Fund (IMF), J.P. Morgan Securities, MSCI Inc., and Thomson Reuters Datastream. MSCI data provided “as is” without any express or implied warranties.
Notes: Real effective exchange rate (REER) is as of 31 December 2014 and expressed as percent change over long-term average. PPP-implied exchange rates are based on relative price levels between countries, with the assumption that a basket of identical goods should cost the same across countries. Average PPP estimates reflect a simple average using IMF and The Economist data, which are based on consumer prices. Fair value model estimates are derived from econometric models that take into account several variables such as PPP, interest rate differentials, fund flows, etc., to produce an equilibrium exchange rate. These fair value estimates differ from currency forecasts, as it is not always assumed that currencies revert to fair value over the forecast horizon. Average fair value model estimates reflect a simple average using Goldman Sachs and J.P. Morgan data.
Australia Valuations and Dividend Yield
Sources: MSCI Inc. and Thomson Reuters Datastream. MSCI data provided “as is” without any express or implied warranties.
Notes: The composite normalised price-earnings (P/E) ratio is calculated by dividing the inflation-adjusted index price by the simple average of three normalised earnings metrics: ten-year average real earnings (i.e., Shiller earnings), trend-line earnings, and return on equity–adjusted earnings. Developed markets dividend yield data start on 31 December 1974. Emerging markets dividend yield data start on 30 September 1995. All data are monthly.
Normalised P/E Z-Scores for Various Equity Markets
Sources: MSCI Inc. and Thomson Reuters Datastream. MSCI data provided “as is” without any express or implied warranties.
Notes: The composite normalised price-earnings (P/E) ratio is calculated by dividing the inflation-adjusted index price by the simple average of three normalised earnings metrics: ten-year average real earnings (i.e., Shiller earnings), trend-line earnings, and return on equity (ROE)–adjusted earnings. We have removed the bubble years 1998–2000 from our mean and standard deviation calculations. Japan equity valuation is based on price-to-book ratio. Asia ex Japan and New Zealand equitiy valuations are based only on the ROE-adjusted P/E. Valuations for all other markets are based on the composite normalised P/E. All data are monthly.
Three-Month Interbank Rate Differentials with Australia
Source: Thomson Reuters Datastream.
Note: Eurozone data begin 31 December 1998.
Bond Yields
Source: Thomson Reuters Datastream.
Footnotes


