At this stage of the US real estate cycle, commercial real estate loans may hold some appeal for investors that are concerned about overvalued real estate equity, as well as those concerned about low spreads and excess competition in other parts of the credit market
- Factors favorable to commercial real estate loans today include yields that look attractive relative to other types of credit, fundamentals that have strengthened (but could be peaking), historically low cap rates that make equity investments less appealing, and a wave of upcoming maturities that could put upward pressure on spreads.
- Real estate debt will not keep pace with equity over a full cycle and returns have trailed in recent years. However, looking ahead, this might change given equity pricing looks stretched and the equity cushions under real estate loans would provide some protection from an eventual downturn.
- Commercial real estate loans are investible via a variety of different formats, from highly rated securitized notes backed by pools of loans to higher risk “bridge loans” backed by individual properties. Implementation options range from liquid funds with diversified exposures to lock-up vehicles where skilled underwriters can earn a premium doing bespoke construction and development loans.
Many institutional investors have exposure to commercial real estate (CRE) equity investments via vehicles like real estate investment trusts (REITs) or private closed-end funds; a smaller number have dedicated real estate debt investments, either in the form of commercial mortgage–backed securities (CMBS) or private funds focused in this area. Real estate debt yields are unlikely to keep pace with those of equity through a full cycle, but in the current environment may hold some appeal for investors that are worried about property valuations or looking to diversify sources of income. In this note, we provide background on the market for CRE finance, review the reasons why these loans hold some appeal today, and describe vehicles through which investors can gain exposure.
Overview of CRE Financing
CRE financing is around a $3 trillion market in the United States,[1]This figure comes from the Mortgage Bankers Association. Figures from the US Federal Reserve are higher as they include construction loans for single-family homes and other types of loans that are … Continue reading smaller than the investment-grade bond universe (with representative indexes around $5 trillion), but much larger than the US high-yield bond universe (around $1.3 trillion). Banks are the largest provider of financing in this market, followed by the CMBS markets, insurance companies, and other investors such as mortgage REITs and alternative lenders (Figure 1). The CMBS market can be split into two parts: private-label deals (where the issuer is a conduit that has purchased a diversified pool of individual loans) and debt issued by a government-sponsored entity (GSE) like Fannie Mae or Freddie Mac, which predominantly funds multi-family housing.
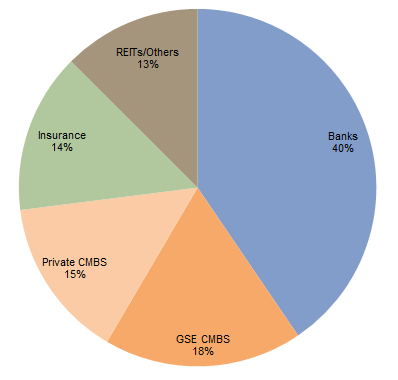
Figure 1. Sources of Commercial Real Estate Financing
As of March 31, 2017
Sources: FDIC, Federal Reserve Board of Governors, Intex Solution, Inc., Mortage Banker’s Association, and Wells Fargo Securities LLC.
Note: Data include outstanding commercial and multi-family mortgage debt.
Features of CRE loans vary depending on their purpose, borrower, and the underlying exposure (industrial, lodging, office, retail, and multi-family). Construction and development loans are usually short-term in nature (typically two to three years) and are often refinanced at lower rates (and longer maturities) when the project is eventually finished. Standard commercial mortgages are ten-year loans. Finally, multi-family loans (which finance structures having five or more housing units) can have maturities of ten years or more.
The variety of underlying asset types and financing structures create a diverse lending opportunity set. The lowest risk category of lending is senior debt on an existing, fully leased property with significant equity below the lender (and in a location with an attractive macro backdrop). Depending on the exact characteristics of the asset and factors such as the amount of leverage and duration, this debt may be provided by banks and offer yields in the low-to-mid single digits. Investors seeking more yield (and risk) can invest either lower down the capital structure (typically in a mezzanine or preferred equity tranche) or in a more speculative category of loan like construction and development (sometimes referred to as bridge loans). Terms for these categories can vary widely based on unique characteristics of the deal and the amount of competition, but yields often reach into the upper single or even lower double digits.
The Current Attractions of CRE Debt
Reasons to consider CRE debt today include relatively attractive yields, reasonably strong fundamentals, solid underwriting standards, stretched valuations that make real estate equity comparatively less appealing, and the potential for a wall of maturing debt to push yields higher. We review these arguments below and also discuss some less bullish dynamics.
CRE Debt Yields Look Relatively Attractive. Yields on CRE debt look attractive relative to other more picked-over parts of the credit market. On the liquid credit side, BBB-rated CMBS debt (an admittedly small universe) yields almost 5.7%, well above most other types of similarly rated credit (Figure 2). On the private credit side, high-single-digit yields on CRE loans compare favorably with other types of private credit strategies like direct lending (senior debt), where some managers target 6%–8% (unlevered) net yields. This is especially true of real estate closed-end funds that target mezzanine or preferred equity, where loan yields may be north of 10% yet lenders still have a 20% or greater equity cushion below them.
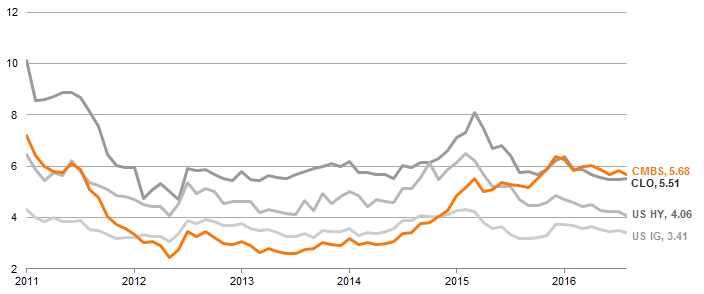
Figure 2. Yields for BBB-Rated CMBS Compared to Similarly Rated Credits
December 31, 2011 – July 31, 2017 • Percent (%)
Sources: Barclays, Bloomberg L.P., and J.P. Morgan Securities, Inc.
Note: “CMBS” represented by the Bloomberg Barclays Investment Grade CMBS BBB Index, “CLO” by the J.P. Morgan CLOIE BBB Index, “US HY” by the Bloomberg Barclays Ba High Yield Index, and “US IG” by the Bloomberg Barclays Baa US Corporate Bond Index.
Fundamentals Have Been Improving . . . But Could Be Peaking. Fundamentals for commercial real estate have been slowly improving over the past several years but certain metrics show signs of peaking. For example, vacancy rates are now slowly starting to inflect upward in assets like retail and office (Figure 3), though they remain close to long-term averages. This is due in part to new supply, which has accelerated in recent years after a relative lull in the wake of the financial crisis (Figure 4). Structural shifts could weaken fundamentals for certain sectors. Retailers have been negatively impacted by ecommerce, and offices by trends in more efficient use of office space, such as open workspaces and coworking/shared workspaces. Offsetting this are a few positives, such as the benefit for industrial property due to growing demand for logistics centers. The biggest wildcard for fundamentals is the current economic expansion, which by many measures looks long in the tooth but could be extended if efforts toward tax reform and other stimulus bear fruit in Washington.
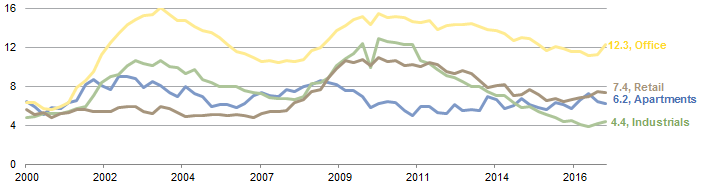
Figure 3. US Vacancy Rates by Property Type
First Quarter 2000 – Second Quarter 2017 • Percent (%)
Source: National Council of Real Estate Investment Fiduciaries.
Note: All data are quarterly.

Figure 4. US Property: Construction Starts
1982–2016 • US Dollar (billions)
Sources: CB Richard Ellis and F.W. Dodge: McGraw-Hill Construction Information Group.
Notes: Construction start data are adjusted for inflation using CPI-U as of December 31, 2016. All data are quarterly.
Loan Performance Has Been Strong, But Underwriting Standards Are Not Universally Agreed. Real estate prices have appreciated in recent years but outstanding CRE debt levels have grown more slowly, resulting in falling loan-to-value (LTV) ratios. Overall delinquency rates for CRE mortgages sit near historical lows, with rates well below 1% for lenders like banks, insurance companies, and GSEs. Lenders have become more conservative, and Federal Reserve surveys show that underwriting standards at banks continue to be tightened across various categories. Underwritten LTVs in new CMBS transactions mirror these trends, falling from around 70% pre-crisis to around 60% in recent years (Figure 5). These may prove too optimistic if cap rates revert back to historic averages, as typically modeled by rating agencies. Meanwhile, rising debt service coverage ratios reflect how growth in rents has outpaced growth in interest costs in recent years. The average ratio today is around 1.7 according to Real Capital Analytics, well above the 1.3 that preceded the financial crisis. The flipside is that rent growth assumptions made by underwriters can also prove too bullish, as has been the case in recent CMBS vintages. Last year, properties backing post-crisis CMBS generated 2.4% overall income growth, below the 3.3% seen in 2015.
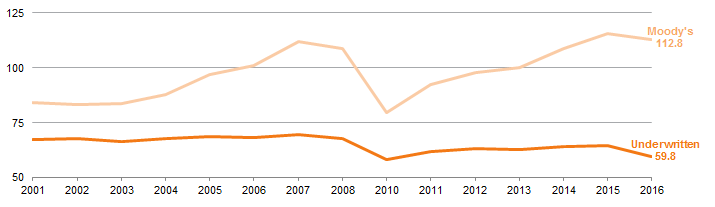
Figure 5. LTVs on New CMBS Transactions: Underwritten Values vs Moody’s Estimates
2001–16 • Percent (%)
Sources: J.P. Morgan Securities, Inc. and Trepp.
Note: Data are annual and released weekly as part of the J.P. Morgan CMBS Weekly Datasheet.
Properties Are Expensive (Admittedly Not All). Given its defensive properties, debt may also appear more attractive than real estate equity at this point in the cycle. Capitalization rates on private property deals sit at 5.0%, near historical lows (Figure 6), and further compression seems unlikely, especially if interest rates rise. Prices for some segments like apartment have surged (57%) since the financial crisis, and overall prices are now around 26% higher, according to Moody’s and Real Capital Analytics. Of course, not everything looks expensive, as core commercial is only 13% higher and some segments like retail are below pre-crisis pricing. Still, the pace of net operating income growth is cooling across different property types. Average asking rents for apartments grew at the slowest pace in five years (3.2% year over year) in first quarter 2017, and office rents barely budged (1.8%). Meanwhile, falling transaction volumes have raised some questions about recent appreciation figures, though data can be volatile and some attribute this to an impasse between unlevered owners who lack other compelling opportunities and buyers who are waiting for better prices.

Figure 6. US All Property Cap Rates
Second Quarter 1983 – Second Quarter 2017 • Percent (%)
For more on the risk retention rules that came into effect at the end of 2016, see the August 2017 edition of Cambridge Associates’ “Quarterly Regulatory Update.”
Source: National Council of Real Estate Investment Fiduciaries.
Note: Data represent trailing four-quarter averages.
Maturing Debt Could Boost Yields. Between now and the end of 2019, as much as $1 trillion of CRE debt will mature, including around $450 billion of bank loans (Figure 7). Some of this debt was made at peak property valuations prior to the financial crisis, and some commercial banks may not be able to re-up commitments given more stringent underwriting standards and/or higher capital requirements. Meanwhile, the CMBS (and overall asset-backed security, or ABS) market is much smaller now than pre-crisis, in part due to new risk retention rules that require originating firms to retain exposure to sizable first-loss pieces. Reduced availability of funding sources could boost yields and thus returns for investors, assuming there is no offsetting pick-up in activity from other types of lenders. CMBS volumes fell materially in first quarter 2017 from the same period one year ago. However, at least for now, other types of lenders like commercial banks and GSEs are more than compensating.
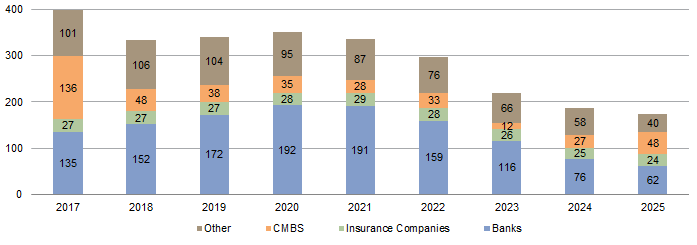
Figure 7. US Commercial Real Estate Maturities
2017–25 • US Dollar (billions)
Sources: JLL Research, Trepp, and the US Federal Reserve.
Note: Data are through third quarter 2016 and as of December 5, 2016.
Accessing the Market
For more about this asset class please see Wade O’Brien et al., “A Supportive Argument for Structured Credit,” Cambridge Associates Research Note, March 2017.
Institutional investors have a number of ways to participate in CRE debt, and need to choose the strategy that best aligns with their return and liquidity targets. Non-Agency CMBS instruments are relatively liquid, attractively priced, and offer a diversified exposure (a typical deal has from 50 to 75 underlying loans). Certain commingled funds offer dedicated exposure to CMBS, while many long-only and credit hedge funds invest in CMBS alongside other types of ABS-like residential mortgage-backed securities (RMBS) and collateralized loan obligations (CLOs). These funds typically are not a pure-play way to invest in CRE debt given their other investments, but may be of interest to investors that effectively want to outsource the decision as to which asset offers the best relative value. Note that vehicles which exclusively focus on private-label CMBS are limited in number, and several managers have recently expressed caution over softening fundamentals.
CRE debt is also accessible via closed-end vehicles, which entail locking up capital for up to ten years. The strategies of these funds can vary significantly in terms of average loan size (from $2 million and up), property type, geographic market, location in the capital stack (senior or mezzanine), etc. The advantage that many of these funds claim to offer borrowers is speed and customization—e.g., a developer looking for acquisition finance may have an easier time going through a single private lender as opposed to a syndicate of banks, which may take weeks if not months to negotiate terms. From a different perspective, a real estate developer looking to renovate or stabilize an asset may find it more economical to initially take out more expensive short-term (two- to three-year) financing before later securing better terms on a ten-year loan after the building is fully leased at higher rents. Some of these debt funds are operated by larger private equity firms that also run real estate equity–focused funds and thus may piggyback off the relationships and deal flow of the sibling entity. The volume of capital being raised by private CRE debt funds is on the rise. Preqin reports that 94 managers were targeting around $37 billion of new funding at the end of second quarter 2017. As in the hedge fund space, in recent years several closed-end funds have launched that invest in both commercial loans and ABS (with some using securitization to refine their risk exposure); the benefit to investors is flexibility should the opportunity set in any one asset class diminish.
Private CRE debt funds offer an opportunity to benefit from underwriting skill and any potential dislocation in the market, but investors should ensure they can afford to lock up capital. Investors choosing this option need to establish whether the skillset of their managers and the strategy employed aligns with their goals. Questions to ask include:
- How does the manager source ideas?
- What is the manager’s competitive advantage in that product?
- Where in the capital stack is the manager investing?
- Does the manager employ leverage on the loans it has extended? How much?
- Can the manager operate the property if the debt defaults and it receives the keys?
- How did the manager perform during the last downturn? If newer, how does the fund expect to invest if conditions take an unfortunate turn for the worse?
Finally, investors choosing real estate debt closed-end funds need to consider where in the portfolio to hold such assets. While returns may prove compelling relative to real estate equity in future years and thus a real assets bucket may be appropriate, CRE debt may not fare as well against other equity-oriented lock-up strategies like buyouts or venture.
Concluding Thoughts
Most types of real estate debt have underperformed real estate equity in recent years, a somewhat predictable result given its lower risk profile. As property price and rent growth are cooling and the US economy approaches the late stages of a long growth cycle, this may be less true going forward.
Being higher in the capital stack via CMBS or private CRE debt offers investors some protection from an eventual downturn given significant equity cushions for most types of loans. Many strategies also have a current yield aspect, which helps reduce the duration of the investment and smooth overall portfolio returns. The flipside is that the upside from debt is somewhat capped, although could reach into the low double digits for some funds. Tailwinds could come from a wall of maturing debt that pushes up yields on new loans and thus juices returns for debt strategies. However, a paucity of other options and just good enough fundamentals could continue to coax banks and other lenders (like private funds) back into the market, driving down returns. Lower LTVs (i.e., greater equity stakes) may also reduce demand for leverage. Interest rates are a wildcard, and the impact depends to a certain extent on why rates are rising. Higher rates could prove a bigger boon to debt holders (via higher interest payments if they are floating rate) as long as they do not challenge fundamentals or reflect strengthening economic growth, which could mean rising property prices and thus returns for equity investors.
In terms of implementation, some of the more liquid multi-asset residential and commercial debt vehicles that mix lending with buying existing ABS may offer investors an attractive way to obtain exposure while giving managers flexibility if the CMBS opportunity shrinks or fundamentals get worse from here. Similar strategies are available via closed-end funds, and those focused on bridge lending may offer a way for managers to harvest unique underwriting skill and relationships. Investors need to carefully consider where in the portfolio to hold any of these funds. While returns may prove compelling relative to real estate equity in future years and thus a hard assets bucket may be appropriate, CRE debt may not fare as well against other lock-up strategies like buyouts or venture.
Wade O’Brien, Managing Director
Dan Day, Senior Investment Associate
Footnotes