We continue to find high-yield bonds uncompelling; select opportunities in high-yield energy credit may offer attractive alpha
- Solid credit fundamentals and 6%+ yields in a low-return environment have lured some investors back to high-yield bonds, but current coupons will serve to cap future returns and offer little protection in the (somewhat unlikely) event the credit cycle turns.
- The fall in oil prices has rocked the energy sector of high yield. The direction of oil prices will have a large impact on credit quality across this sector, and if oil recovers quickly the sector in aggregate may be too cheap.
- For investors looking for exposure to energy credit, we prefer private equity–style vehicles where investments will be made not just in existing securities but also in new loans that can result in superior economics for skilled managers.
US high-yield bonds have posted lackluster returns over the past couple of years, weighed down in part by low yields. Returns have been well below those of other diversifying assets; the cumulative return of US high-yield bonds since the start of 2013, for example, has been less than half that of long/short equity hedge funds (Figure 1).

Figure 1. High-Yield Index Performance vs US Equities and Long/Short Hedge Funds
February 28, 2013 – February 28, 2015 • January 31, 2013 = $100
See, for example, our Asset Class Views publication on US high yield dating back to June 2013, which suggests underweighting in favor of other diversifying assets.
Given that the flipside of this underperformance is rising yields, we thought it would be useful to “re-underwrite” our longstanding advice to underweight this asset class. This note discusses high-yield credit fundamentals and market technicals, and takes an in-depth look at energy bonds, which have sold off given the recent plunge in oil prices. Solid credit fundamentals and recent refinancing activity should reduce default risks, and yields appear reasonable relative to other parts of the fixed income universe. However, we continue to find high-yield bonds very overvalued and less attractive than other diversifying assets, though some strategies focused on the energy sector may merit a closer look from investors.
Fundamentals
The near-continuous rally in US Treasury yields since the financial crisis has helped bring down yields on a variety of fixed income asset classes and high-yield bonds are no exception. Yields on high-yield bonds have risen since last autumn to around 5.9%, but remain below both recent and long-term averages (Figure 2).

Figure 2. High-Yield Index Historical Yield
August 31, 2000 – February 28, 2015
Credit spreads look in line with historical averages, and relatively attractive when today’s credit quality and default risks are taken into account. Most metrics indicate that underlying credit quality on US high-yield bonds is in line with historical averages. The leverage ratio of 4.0x is only slightly above its historical average, and the 3.9x interest coverage ratio looks reassuring relative to its 3.2x historical average (Figure 3).[1]The leverage ratio is the ratio of debt to trailing 12-month EBITDA and the interest coverage ratio is the ratio of trailing 12-month EBITDA to trailing 12-month net interest expense. However, these averages mask significant variation across sectors. The gaming sector (5.9x) is far more levered than the more heavily weighted telecom (4.6x) and energy sectors (3.7x), while interest coverage ratios are well above average for sectors like energy and automotive.
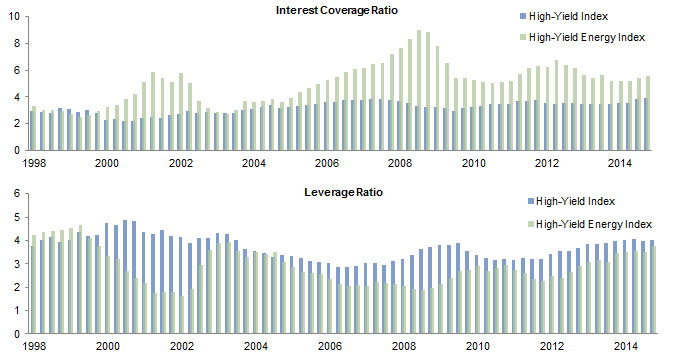
Figure 3. High-Yield Index Interest Coverage and Leverage
First Quarter 1998 – Fourth Quarter 2014
These ratios have shortcomings. The leverage ratio for the energy sector looks reasonable using 2014 full year data, but will deteriorate going forward as lower oil prices start to impact cash flows. Interest coverage ratios are also vulnerable to lower cash flows or higher interest expenses if anticipated Fed rate hikes mean higher refinancing costs. However, many companies have used the buoyant markets of recent years to refinance existing debt loads and push back debt maturities, so any higher refinancing costs will not hit for a few years. Less than 5% of US high-yield bonds mature before the end of 2016 (Figure 4), lowering refinancing and thus default risks for borrowers.
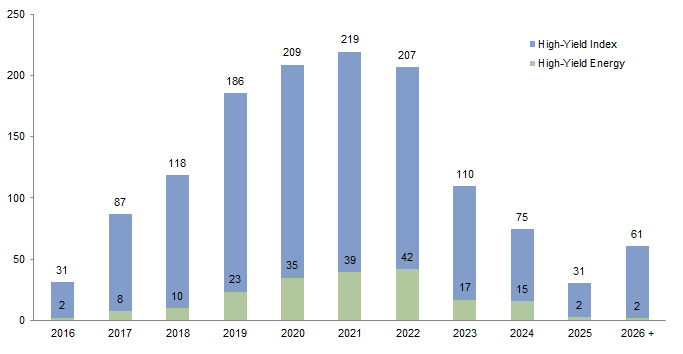
Figure 4. Maturity Schedule of Barclays High-Yield Energy Index
As of February 28, 2015 • Market Value (US$ billions)
Default rates are backward looking but trends do not flash any warning signs. The issuer-weighted default rate has risen to 2.2% but remains at less than half its historical average (Figure 5). The par-weighted 3.0% default rate is higher, given recent defaults for the heavily weighted TXU and Caesars. Looking ahead, as the index weight shrinks for these types of aggressive pre–financial crisis buyouts, the lack of large issuers with extremely low credit ratings may help cap default rates. Only two of the largest 50 issuers in the Barclays index have CCC ratings: Intelsat and iHeartCommunications. Most forecasters expect that in 2015 the par-weighted default rate will be between 2.5% and 3.0%, though the fate of the energy sector is an important wildcard.
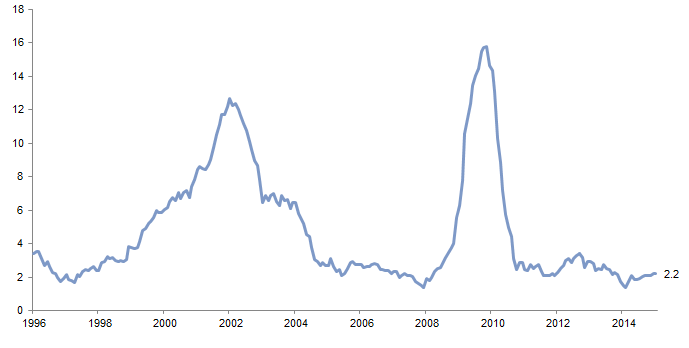
Figure 5. US High-Yield Trailing 12-Month Default Rate
January 31, 1996 – January 31, 2015 • Percent (%)
It is worth saying that trailing default rates also looked low in the spring of 2008, before steadily rising for the next 19 months, and that leverage and coverage ratios also looked within historical ranges at that time. However, several dynamics are different this time around. One is the current debt maturity profile of the index, and the limited amount of debt maturing during the next couple of years. Another is that recent issuance has been less aggressive than seen before the last big default cycle, with acquisition-related finance averaging around 20% of the last three years’ total versus around 40% from 2005 to 2007. This is also reflected by the rising credit quality of new issuance; roughly 50% of 2014 issuance carried at least a BB rating (or the equivalent) from one rating agency, well above levels seen before the global financial crisis. Offsetting these positives is that credit protections for investors are deteriorating; according to Moody’s, new US high-yield bonds feature the weakest covenant packages in at least four years.
Technicals
Gross new issuance in the US high-yield market reached a record $399 billion in 2013 before slightly decelerating to $356 billion last year, which was still the third highest total on record (Figure 6). Outstanding issuance has grown more slowly given much of the recent issuance was for refinancing, yet still stands at around $1.4 trillion. Trading activity has not kept up with this soaring market cap, increasing volatility. According to Barclays, last year turnover in the US high-yield market was around 100% of market cap, down from 177% ten years ago.

Figure 6. New High-Yield Bond Issuance
2001–15 • Volume of New Issuance (US$ billions)
Flagging investor demand for high-yield bonds has weighed on performance. In 2014 investors withdrew a record $24 billion from mutual funds and exchange-traded funds that invest in US high-yield bonds, the second straight year of withdrawals. Low yields have diminished appetite, as have strong returns on other assets such as US equities. During the first two months of 2015 roughly $10 billion has flowed back into high-yield funds as concern has eased over the immediacy of Fed rate hikes and as yields look attractive on a relative basis.
Energy Sector Stress
Recent news flow about the high-yield market has been dominated by stories about cheap oil impacting credit fundamentals in the energy sector, which stems from several factors. Many of the borrowers are relatively new companies that were formed to take advantage of the shale revolution, facilitated by advances in hydraulic fracturing, or “fracking,” over the past decade. The energy sector has seen its contribution to new high-yield issuance more than double from 6% in 2004 to 14% last year (Figure 6); it is now the largest or second largest sector in most US high-yield indexes. Since much of this debt was issued during an era of relatively loose underwriting standards and higher energy prices, analysts are anxious to see how relatively new management teams and business models will respond to these price pressures.
Thus far the market has been somewhat discriminating about the impact of cheaper oil prices. Yields have risen on energy sector bonds but declined for other sectors (Figure 7), while within the energy sector itself prices have diverged across subsectors. Generally speaking, bonds from service and exploration companies have fared far worse than those from other subsectors like pipelines and refiners.

Figure 7. High-Yield Energy Index Spreads
March 31, 1995 – February 28, 2015 • Yield (%)
Price divergences across sectors can be explained several ways. Service sector companies own and/or operate onshore and offshore rigs. As oil prices have fallen, so too has the number of rigs used as well as the demand for maintenance services (Figure 8). Across exploration & production (E&P) companies, declines have typically been proportional to leverage ratios (debt amounts relative to cash flows), balance sheets, hedge ratios, and other factors such as quality of underlying assets (both amount and extraction cost of reserves). Whether a company owns oil, natural gas, coal, or a blend of these assets also comes into play. The debt of midstream (pipeline) companies has held up relatively well, as have bonds from refiners that in some ways benefit from cheaper oil via greater demand for products like gasoline. Complicating the process is the fact that some firms operate integrated business models, meaning, for example, they are involved in both E&P and mid- or downstream activities.
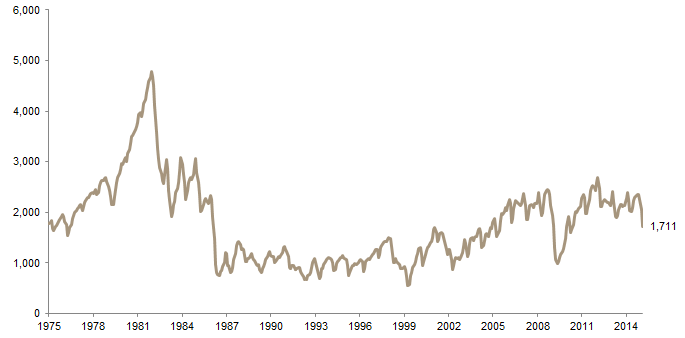
Figure 8. North American Active Drilling Rig Count
January 31, 1975 – February 28, 2015
Credit metrics at first blush don’t seem to merit the sell-off that has occurred for energy credits. Leverage ratios (3.7x) and coverage ratios (5.5x) that compare favorably to the broader indexes (Figure 3) are one of the key reasons that energy sector issuers carry relatively high credit ratings. However, these ratios are flattered by the use of trailing cash flows, which are associated with much higher energy prices. Looking ahead, analysts expect to see significant deterioration. For example, Barclays estimates that leverage for US high-yield E&P companies will increase from 2.8x to 4.3x in 2015 if oil stays around $50/barrel, nearly double its long-term 2.2x average. These figures would be worse if not for hedges that are in place to protect against low oil prices—Barclays estimates that around 40% of 2015 production for its coverage universe is hedged. However, as these hedges wear off in 2016, the picture may darken unless oil prices recover.
The direction of oil prices will have a large impact on credit quality across the energy high-yield sector, and it seems highly likely that a number of weaker companies will default. However, several dynamics will help mitigate risks for other firms until prices recover. Most energy debt was issued during the last several years and will not need to be repaid for some time. For example, only about 10% of outstanding energy sector bonds mature before 2019 (Figure 4). Many issuers are already taking drastic steps to shore up cash flows given the decline in oil prices. Budgets for capital expenditure are being slashed, layoffs have been announced, and pressure is being placed on various suppliers to renegotiate contracts. Some of the largest high-yield E&P companies also have significant additional sources of liquidity in the form of undrawn bank lines. Finally, the chance that loans issued by energy companies will trigger some type of cross default is also reduced as many of these loans were issued during a period of relatively loose underwriting standards and thus lack restrictive covenants.
Other market participants may also take actions that will reduce default risks. Bank lenders have historically shown a willingness to loosen existing loan agreements or extend new credit to keep companies alive and protect their claims, often receiving in exchange higher interest rates or more direct claims on assets. Many believe banks will follow this playbook during the current cycle. A number of private equity firms and hedge funds are raising funds to help lend to distressed energy companies and capital is already being put to work. Strategies and transactions vary, but some of the credit-focused funds are offering more subordinated credit (so-called second lien debt) in exchange for high interest rates. While such transactions may be negative in the near term for equity investors, they will prove beneficial for more senior creditors.
Generalizing about whether all energy sector bonds are priced efficiently is difficult given enormous dispersion across issuer types, underlying business models, balance sheets, hedging ratios, and other determinants of credit quality (Figure 9). The prices of some bonds have likely fallen farther than fundamentals would suggest, but others may be too rich given the difficulty some companies will encounter in meeting future obligations. In aggregate, spreads appear to compensate investors for a fair amount of default risk. Using an excess spread figure of 680 bps (the current 8.3% yield for energy bonds minus the 1.5% yield for benchmark US Treasuries) and assuming a three-year time horizon, investors are receiving a cumulative 2,040 bps of cushion, which put another way would cover up to 40% of these borrowers defaulting and losses amounting to over 50% of face value after default.
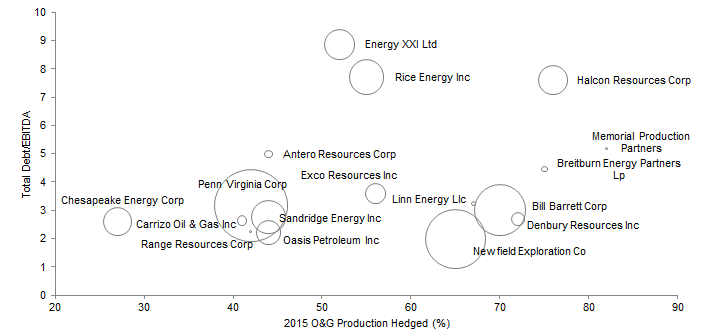
Figure 9. High-Yield Energy Bond Index Fundamentals
As of February 28, 2015
Advice
Investors have returned to US high-yield bonds in 2015, lured back by the relative attractiveness of 6%+ coupons when yields on many other types of debt are barely above zero. Credit fundamentals also look in line with historical averages, though some metrics are flattered by the low absolute level of interest rates. If as expected the Fed hikes interest rates later in 2015, high-yield bonds may suffer a slight sell-off, but may be insulated by the possibility that credit spreads contract, which was indeed the case in February.
Despite these favorable dynamics, we remain unenthusiastic about US high-yield bonds. Current coupons will serve to cap future returns, and offer little compensation in the (somewhat unlikely) event that the rate or credit cycle turns. Credit underwriting standards are also deteriorating, leaving investors less protected if conditions deteriorate and potentially with lower recoveries. We continue to believe that other diversifying strategies such as equity-oriented hedge funds offer more compelling alternatives, acknowledging fully that some of these other strategies have posted disappointing returns in recent years and manager selection is paramount.
Energy high-yield bonds are a slightly different opportunity. We are more constructive on certain alpha opportunities rather than the overall beta. The sector in aggregate may be too cheap if oil quickly recovers; we have no way of knowing whether this will be the case. The market has been somewhat efficient in discriminating across sectors, but bond prices for some issuers have likely undershot fundamentals. Uncertainty over the direction of oil prices and thus credit quality has probably encouraged some investors to adopt a “shoot first, ask questions later” mentality, and some investors have likely become forced sellers as ratings have been cut or because they are not equipped to negotiate with distressed companies. For investors that want to target distress in energy sector credit we prefer private equity–style vehicles where investments will be made not just in existing securities but also in new loans that can result in superior economics for skilled managers.
Wade O’Brien, Managing Director
Ramin Sobhany, Investment Associate
Exhibit Notes
High-Yield Index Performance vs US Equities and Long/Short Hedge Funds
Sources: Barclays, Credit Suisse, and MSCI Inc. MSCI data provided “as is” without any express or implied warranties.
Note: Hedge fund data are through January 2015.
High-Yield Index Historical Yield
Source: Barclays.
High-Yield Index Interest Coverage and Leverage
Source: BofA Merrill Lynch.
Notes: Interest coverage ratio calculated as LTM EBITDA divided by net LTM interest expense. Leverage ratio calculated as net debt divided by LTM EBITDA.
Maturity Schedule of Barclays High-Yield Energy Index
Source: Barclays.
US High-Yield Trailing 12-Month Default Rate
Source: Moody’s Investors Service.
New High-Yield Bond Issuance
Source: J.P. Morgan Securities, Inc.
Note: Data for 2015 are through February 28.
High-Yield Energy Index Spreads
Source: Barclays.
North American Active Drilling Rig Count
Source: Baker Hughes Incorporated.
Note: Data are monthly.
High-Yield Energy Bond Index Fundamentals
Sources: Barclays and Bloomberg L.P.
Notes: Hedged values are estimates from company reports compiled by Barclays. Bubble size reflects cash on balance sheet as of most recent filing. Hedged 2015 O&G production is an estimate.
Footnotes