Summary of policy benchmarking approaches
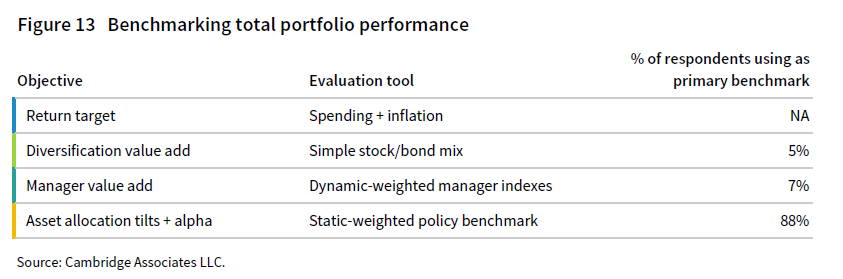
Benchmarking investment performance is an essential part of an institution’s well-functioning governance process. When selecting a benchmark, it is important for institutions to understand what types of questions they are seeking to answer (Figure 13). There is no single benchmark that can assess every single aspect of portfolio management. Consequently, it is not uncommon for institutions to use multiple benchmarks in their performance evaluation process. In our survey, we asked respondents to provide both the real return objective for the investment portfolio and the primary benchmark used to evaluate investment performance at the total portfolio level.
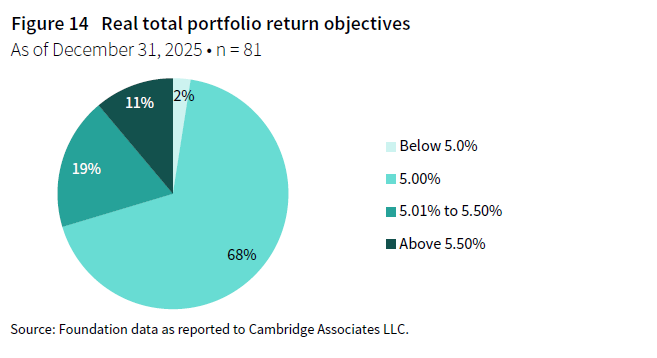
Most foundations in this study are private, nonoperating foundations that are required by law to meet an annual payout requirement. These types of foundations must make qualifying distributions that amount to approximately 5% of their average total asset value across the tax year. Foundations that aim to preserve the purchasing power of their assets over time must earn a real return (i.e., adjusted for inflation) that at least matches their payout rate. Since investment returns are volatile from year to year, return objectives are evaluated from a long-term perspective as opposed to a goal that must be met every single year. Given the payout requirement that most respondents are bound by, it is not surprising to see that about two-thirds (68%) reported that their long-term real return objective was 5% and another 30% have a return objective that is higher than 5% (Figure 14).
In the Investment Portfolio Returns section, we cited the performance of a blended index weighted 70% to the MSCI ACWI and 30% to the Bloomberg Aggregate Bond Index. For foundations that are diversified across alternative asset classes, a benchmark such as this helps to evaluate whether the decision to diversify the portfolio added value. Our comparisons of median foundation performance versus the 70/30 benchmark show how the peer universe in general measured up to a simple, passive investment option. In practice, just 5% of foundations reported that a simple blended index was the primary benchmark used for their total portfolio return. The most common approach among this subgroup was to use a blend weighted 70% to an equity component and 30% to a bond component. The most appropriate weightings for this type of benchmark would be a blend that aligns with the targeted risk profile of the portfolio.
The remaining peers in the universe use a policy benchmark that has three or more components. The vast majority (88%) use a blend of indexes with static weightings that align exactly or closely with the asset classes and target percentages specified in their asset allocation policies. This type of benchmark helps an institution evaluate how its portfolio performed relative to the blended index that represents its default or normative position. A handful of respondents (7%) use a blend of manager-specific indexes, where the weightings update frequently (e.g., monthly) to match each portfolio. This type of benchmark is intended to focus on manager selection decisions and neutralizes the effects of over/underweights of the actual asset allocation versus policy targets. The figures that follow provide more detail on benchmarks for the foundations that use a static-weighted policy benchmark.
Components of policy portfolio benchmarks
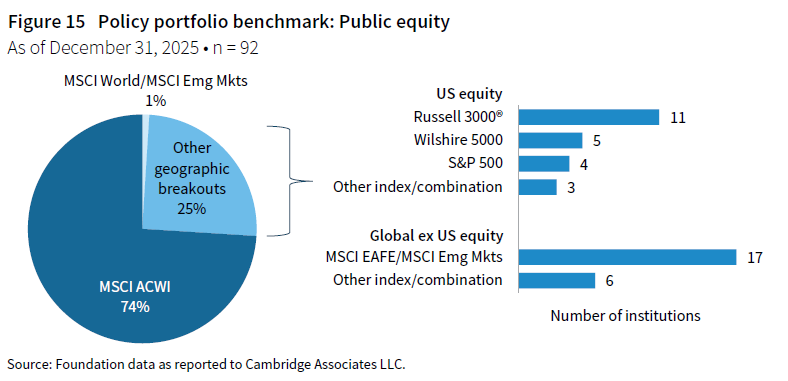
When it comes to benchmarking public equity, the use of the MSCI ACWI is as prevalent as ever. Last year, 66% of respondents used this index to represent their entire public equity allocation in the policy benchmark. This year, the percentage of respondents citing this index increased to 74% (Figure 15). The remaining respondents use a combination of indexes that are more geographically defined. For those that use a US-focused benchmark, the Russell 3000® Index was by far the most common. For global ex US equities, a combination of the MSCI EAFE Index and the MSCI Emerging Markets Index was cited most often.
When evaluating PE/VC in the policy benchmark, 77% of respondents use a public index, with the MSCI ACWI being the preferred index among this cohort (Figure 16). The rationale for using a public index is that the public equity bucket in the portfolio was the funding source for private equity allocations. And if the portfolio did not invest in private equity, that capital would have remained with the public equity allocation. The use of a public index primarily evaluates whether the decision to invest in private markets paid off for the portfolio.
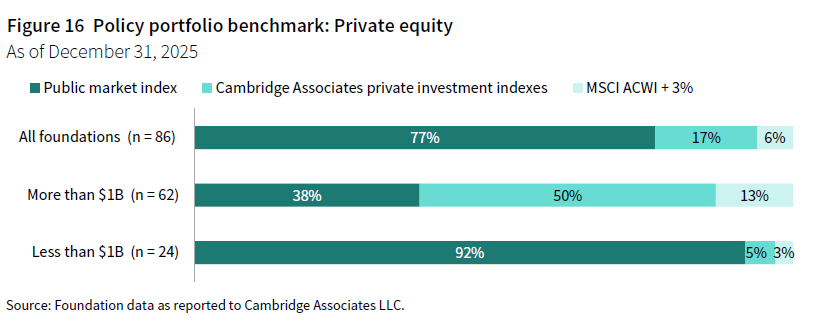
There are some shortcomings to using a public index to benchmark private equities. Most notably, the public stock market is not a universe of securities that is representative of private equity investments. Consequently, in years such as 2025, where there are large differentials between public equity and private equity performance, the spread between the portfolio return and the benchmark return can be more reflective of those market dynamics than of how well the management team implemented the private portion of the portfolio. A smaller proportion of the universe (17%) instead use the CA private investment indexes to represent private equity in the policy benchmark. These indexes do not meet the ideal properties of benchmark as they are not transparent or investable. However, they are a universe of institutional-quality private investment funds that are more representative of the asset class compared to a public index. The remaining 7% use a the MSCI ACWI plus a 3% premium.
There was a noticeable difference in the breakdown of responses by asset size. For foundations less than $1 billion, a public index was used by more than 90% of respondents. In contrast, approaches were more mixed among foundations more than $1 billion, with the CA private investment indexes being cited by half of respondents. The private investment indexes can be custom weighted by vintage year and exposure across different strategies, which helps to evaluate fund selection. It is likely for this reason that the approach continues to be prevalent among larger institutions, of which many have performance-based incentive compensation programs for their investment staff.
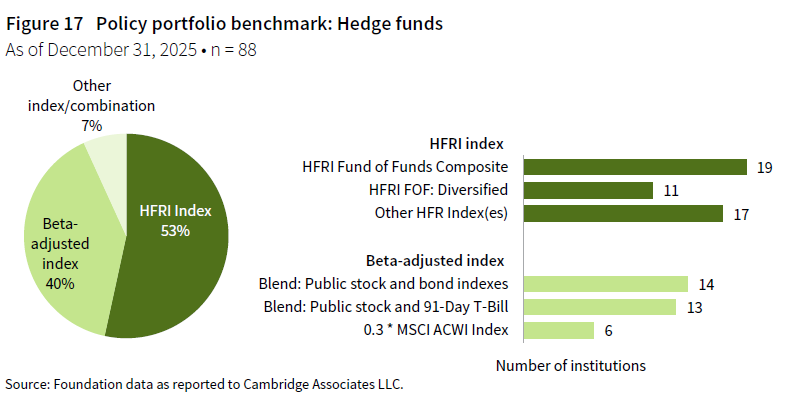
Investors also face similar challenges of selecting an appropriate index when accounting for hedge fund allocations in the policy benchmark. Slightly more than half of respondents use one or more indexes produced by Hedge Fund Research® (HFR), which tracks hedge fund managers that report to their database (Figure 17). Within this family of indexes, the HFRI Fund of Funds Composite was most often cited. Other approaches include a beta-adjusted benchmark, although the exact method varies across a few different options. Most respondents using this type of benchmark use either a blended public equity/bond index or a blending public equity/91-Day T-Bill return stream. In both instances, the MSCI ACWI with a 0.3 beta is the most common approach.
For fixed income, 48% of foundations use the Bloomberg Aggregate Bond Index, which was almost the exact same percentage from last year’s survey. The remaining respondents chose from a number of other indexes that presumably are a fit for their underlying exposures. When it comes to real assets, benchmark choices are even more unique across the respondent group due to the variety of strategies in this bucket. Finally, while the majority of the universe has allocations to private credit strategies, only a small percentage of those foundations have a dedicated benchmark to private credit in their policy benchmark.
Value add versus the policy benchmark
Just 14% of respondents reported that their total portfolio return beat their benchmark in 2025. When considering the spread between the portfolio return and the benchmark, the median across the respondent group was -300 bps for the calendar year. Outcomes varied widely across foundations, ranging from 110 bps of outperformance at the top 5th percentile mark of the universe to underperformance of 800 bps at the bottom 5th percentile (Figure 18).
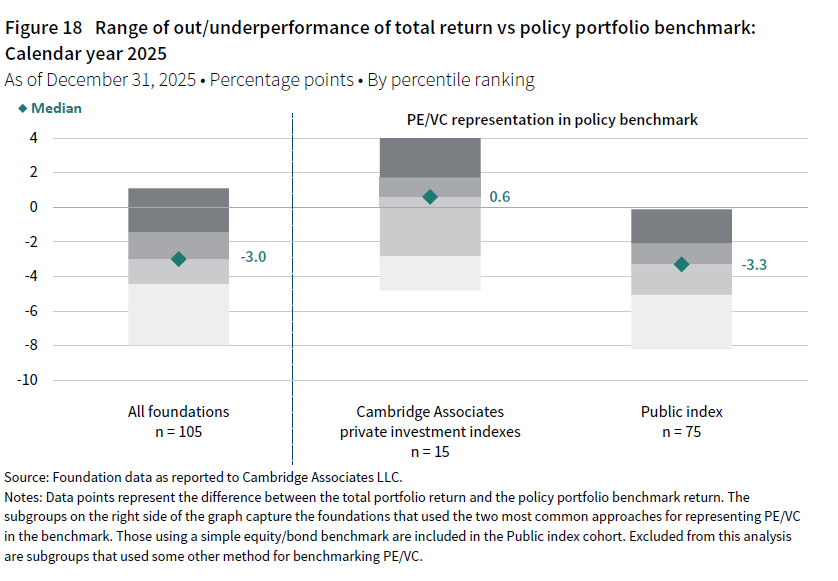
When breaking the peer universe down further, it is clear that the type of benchmark used for private equity was a big factor in how well an institution performed versus its overall policy benchmark in 2025. For foundations that used the CA private investment indexes, the median value add was actually positive at 60 bps. In contrast, the median value add for foundations using a public index was significantly lower at -330 bps. While there were not enough respondents using the MSCI ACWI plus 3% to show a percentile distribution for this cohort, these foundations by and large underperformed by even larger margins because of the extra return hurdle added on.
The different experiences of these subgroups tie back to the relationship between public equity and private equity returns in 2025. The one-year horizon IRR of the CA Private Equity and Venture Capital Index was significantly lower than the mPME version of the MSCI ACWI (13% versus 23%). Therefore, an institution using the CA private equity indexes would calculate a lower benchmark return than it would if using a public index. The difference becomes even more magnified the higher a foundation’s allocation is to private investments. With most foundations in our universe having 20% or more of their portfolios invested in PE/VC, the index choice is consequential in the policy benchmark calculation.
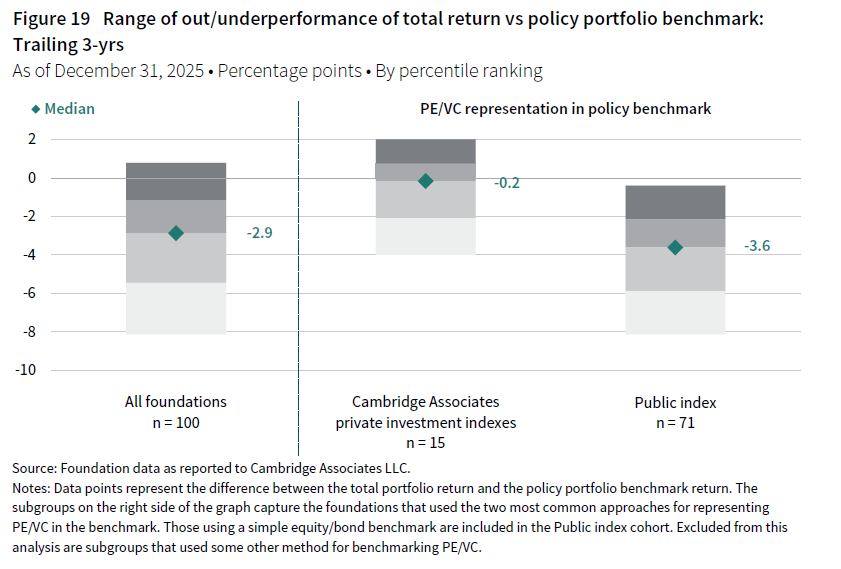
The relative performance of public equity versus private equity in 2025 was a continuation of a multi-year trend. Thus, the trailing three-year value add statistics essentially mirrored what we saw with the 2025 outcomes. For the overall respondent group, the median spread between the portfolio return and the benchmark return was -290 bps for the trailing three-year period (Figure 19). A little more than half of the cohort using the CA index underperformed for this period, while the vast majority of the public index subgroup again fell short of their policy benchmark.
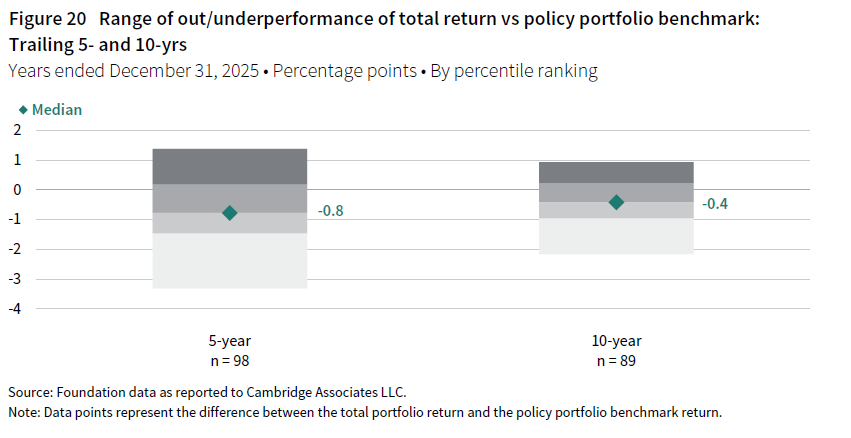
Most respondents also underperformed their policy benchmark over longer time horizons. The median value add was -80 bps and -40 bps for the trailing five- and ten-year periods, respectively (Figure 20). The different benchmarking approaches were not nearly as impactful on the value add statistics for longer periods. Part of that is because the public versus private index spreads were not as large for longer periods, and the differentials that do exist naturally get smaller in the annualized calculations
Return to the Foundation Annual Investment Pool Returns: Calendar Year 2025 landing page to read other sections of this report.
Notes on the Data
The notation of n denotes the number of institutions included in each analysis.
Returns for periods greater than one-year are annualized.
The simple portfolio benchmark consisting of 70% MSCI ACWI/30% Bloomberg Aggregate Bond Index is calculated assuming rebalancing occurs on the final day of each quarter.
The MSCI indexes contained in this report are net of dividend taxes for global ex US securities unless otherwise noted.
Private indexes are pooled horizon IRRs, net of fees, expenses, and carried interest.
Hedge Fund Research data are preliminary for the preceding five months.
Profile of respondents
This report includes data for 115 foundations. The breakdown is as follows: 95 private nonoperating foundations, five private operating foundations, and 15 community foundations. All participants provided investment pool return and asset allocation data as of December 31, 2025.
The 115 participants in this study reported long-term investment portfolio (LTIP) assets as of December 31, 2025, totaling $255 billion. The mean LTIP size was $2.2 billion, and the median was $422.1 million.
12 participants have an LTIP size less than $100 million, while 36 have an asset size greater than $1 billion. The remaining 67 participants have an LTIP size between $100 million and $1 billion. The participants with LTIP sizes greater than $1 billion controlled 91% of the aggregate LTIP assets.
Modified public market equivalent indexes
Under Cambridge Associates’ modified public market equivalent (mPME) methodology, the public index’s shares are purchased and sold according to the private fund cash flow schedule, with distributions calculated in the same proportion as the private fund and mPME NAV is a function of mPME cash flows. The mPME analysis evaluates what return would have been earned had the dollars invested in private investments been invested in the public market instead.