Worries over the health of US credit markets have risen in recent months, with numerous reports highlighting the growing vulnerability of indebted companies (and thus investors) to rising rates and a potential turn in the economic cycle. Legitimate areas of concern do exist in the credit markets, including the weakening quality of loan documentation, liberties taken by companies in calculating future cash flows, and rising volumes of lower-quality debt issuance. Rising rates will eventually become a concern for some borrowers. However, by failing to consider the broader context or some of the offsetting positives, we believe some of the prevailing narrative is overly pessimistic. This paper provides our updated thoughts across US credit markets, as well as some tactical tilts investors could employ to help navigate a few of these headwinds.
Debt Levels Are Definitely Rising
Debt levels are rising according to many measures, though some are more useful than others in terms of measuring corporate ability to pay—ultimately what matters for investors. For example, some analysts compare US corporate (or more specifically non-financial corporate) debt to local GDP at the macro level, while others measure it against aggregate issuer cash flow. At this more micro level—focusing on bond index debt levels as a percentage of a balance sheet or income metric (equity, operating cash flow, etc.)—the question then is which metric is best: net versus gross, median versus average, etc. Different metrics result in very different conclusions about leverage levels and ability to service today’s debt.
Based on macro economy-wide measures, US non-financial corporate debt levels have risen since the financial crisis (Figure 1) and stand near record levels. However, this is not the whole story. Total US corporate debt has actually fallen sharply since the financial crisis as financials have deleveraged. Debt burdens send mixed signals (when measured versus corporate cash flows). Net debt for investment-grade corporate bonds (excluding financials) has fallen recently from 2.7 times EBITDA in 2015 to around 2.3 times at the end of first quarter 2018. Current levels remain above those seen pre-crisis (1.7 times on average from 2005 to 2007) but could decline further as corporate profits continue to rebound. Meanwhile, after rising a few years ago as oil prices collapsed, average leverage for high-yield bond issuers has declined, but at around 4.3 times EBITDA remains above the pre-crisis levels (an average of 3.1 times from 2005 to 2007) and is fairly close to its 20-year average (4.0x) (Figure 2).
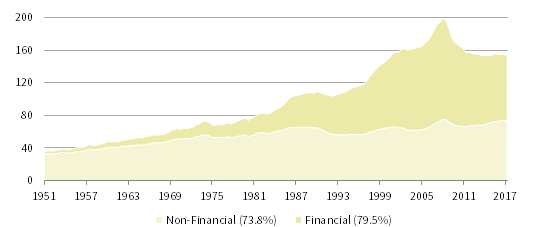
FIGURE 1 TOTAL US DEBT BY SECTOR AS A PERCENTAGE OF NOMINAL US GDP
Fourth Quarter 1951 – First Quarter 2018 • Percent (%)
Sources: Federal Reserve, Thomson Reuters Datastream, and US Bureau of Economic Analysis.
Note: Current debt as a percentage of GDP shown in legend.
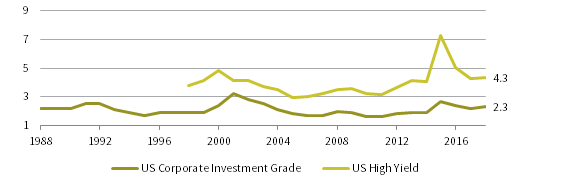
FIGURE 2 NET LEVERAGE RATIOS: US CORP INVESTMENT-GRADE BONDS
1988–2018
Sources: Barclays, Bloomberg L.P, and ICE BofA Merrill Lynch.
Notes: Data are annual. Data for US high-yield bonds begin in 1998. US corporate investment-grade and US high-yield net leverage data are calculated as net debt/EBITDA for the Bloomberg Barclays US Corporate Investment Grade (ex Financials) Index and BofA Merrill Lynch US High Yield Master II Index, respectively. Data for 2018 are as of first quarter 2018.
A couple of caveats are required when discussing current leverage levels. Interest rates are currently below those seen before/during the financial crisis, so the ability of companies to service debt is higher today. Investment-grade interest coverage[1]Interest coverage is defined here as trailing 12-month EBITDA divided by trailing 12-month interest expense. ratios stand around 11.6 times, well above average levels before the financial crisis, while high-yield coverage ratios are slightly higher (4.0 times today versus 3.8 times a decade ago). Earnings are also rising rapidly, in part due to corporate tax cuts, suggesting coverage ratios will improve from here. Investment-grade issuer EBITDA increased nearly 11% year-over-year during first quarter, and high-yield corporate performance was even stronger.
Rising issuance levels in some markets are often conflated with higher leverage. Broadly syndicated US leveraged loan issuance has risen, and outstanding issuance is now over $1 trillion, a round and attention-grabbing figure. Less discussed is that some of the growth in leveraged loan market has come at the expense of the high-yield bond market, which has seen essentially no growth over the past four years; according to Fitch, the size of the overall leveraged loan market surpassed that of the high-yield bond market earlier in 2018 (Figure 3). The net result is that the combined volume of sub-investment- grade debt (bonds and loans) has risen, but less than headlines about soaring loan issuance suggest, and not disproportionately to the cash flow available to service it.
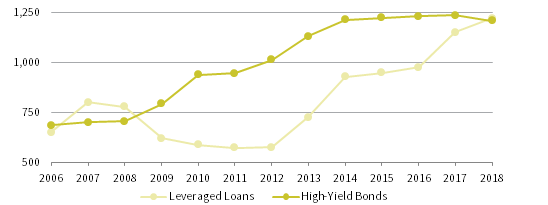
FIGURE 3 US LEVERAGED LOAN MARKET VS HIGH-YIELD BOND MARKET
2006–18 • Market Value (USD billions)
Source: Fitch.
Note: Data for 2018 are as of May.
Trends in Issuance and Credit Quality
Lower-quality issuance is increasing across different segments of the credit markets, but some of the more alarming headlines should be taken with a grain of salt. In the investment-grade space, the index weighting for BBB-rated debt has increased by more than 10 percentage points (ppts) since the financial crisis and now stands near record levels at 48%. The average rating of the investment-grade index has dropped as a result, but to a relatively small degree. The (weighted) average rating of constituents has dropped just one credit notch from around A2 before the financial crisis to the edge of A3/Baa1 today (Figure 4).
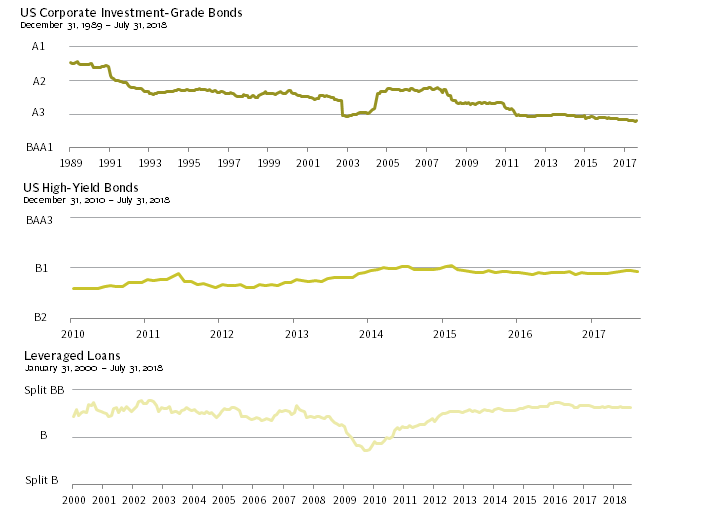
FIGURE 4 AVERAGE INDEX RATING OVER TIME
Sources: Barclays, Bloomberg L.P, and Credit Suisse.
Notes: Index rating for US corporate investment-grade bonds and US high-yield bonds based on average of Moody’s, S&P, and Fitch ratings expressed in Moody’s nomenclature. US corporate investment-grade bonds and US high-yield bonds are representated by the Bloomberg Barclays Corporate Investment Grade Bond Index and Bloomberg Barclays Corporate High Yield Bond Index, respectively. Leveraged loan average ratings are based on a single “blended” Moody’s/S&P rating. Split ratings are assigned when ratings from Moody’s and S&P differ. Leveraged loans are respresented by the Credit Suisse Leveraged Loan Index.
The bigger questions might be how much additional credit risk this introduces and whether current spreads offer compensation. BBB credit spreads are around 41st percentile of their historic level and look in line with single A bonds, which are around 42nd percentile. Reflecting the higher weight for BBB bonds, the 109 basis point (bp) OAS of the US investment-grade bond index has risen in 2018 but remains slightly below its historical median (Figure 5). Default risk may not have significantly increased given this changing index composition. According to Moody’s, the long-term average annual loss rate (factoring in rate of default and recovery) was just 0.1% per annum (p.a.) for BBB-rated bonds at the end of 2017, slightly higher than that for single A (0.0%) but well below that for BBs (0.6%). More concerning to our mind is that the average duration of the investment-grade index has risen over time and now stands around 7.3 years, weighing on returns given recent (and possible future) rate hikes by the US Federal Reserve.
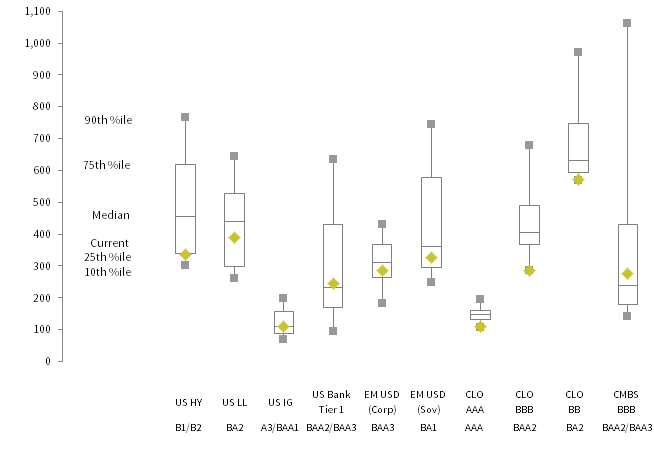
FIGURE 5 CURRENT CREDIT SPREADS IN HISTORICAL CONTEXT
As of July 31, 2018 • Basis Points (bps)
Sources: Barclays, Bloomberg L.P., Credit Suisse, and J.P. Morgan Securities, Inc.
Notes: Asset classes represented by: Bloomberg Barclays US Corporate High Yield Index (US HY), Credit Suisse Leveraged Loan Index (US LL), Bloomberg Barclays US Corporate Investment Grade Index (US IG), Bloomberg Barclays Capital Securities Tier 1 Index (US Bank Tier 1), J.P. Morgan CEMBI Diversified Index (EM USD [Corp]), J.P. Morgan EMBI Global Diversified Index (EM USD [Sov]), J.P. Morgan CLOIE AAA Index (CLO AAA), J.P. Morgan CLOIE BBB Index (CLO BBB), J.P. Morgan CLOIE BB Index (CLO BB), and Bloomberg Barclays US CMBS Baa Index (CMBS BBB). Observation periods begin: January 31, 1994 for US HY; January 31, 1992 for US LL; June 30, 1989 for US IG; December 31, 2001 for US Bank Tier 1 & EM USD (Corp); December 31, 1997 for EM USD (Sov); December 31, 2011 for CLO AAA, CLO BBB & CLO BB; and August 31, 2000 for CMBS BBB.
Similar stories are circulating about higher-beta credit, bemoaning the increase in lower quality. The share of B-rated bonds is growing and now represents over half of the high-yield index. In the loan market, the share of single-B rated assets has grown more than 8 ppts in just the last two years and stands at 45%. But offsetting this dynamic in both cases are falling shares of lower-quality issuance. The CCC share of the high-yield bond index recently hit a 20-year low. In loans, the share of non-rated issuance (which presumably is lower quality) is barely above 2%, roughly 10 ppts below its historical median. The net result is that the average rating for both the bond and loan indexes are fairly close to their historical medians. The current discount margin for leveraged loans of around 400 bps, within 12% of its historical median, seems reasonable from this perspective.[2]Leveraged loans are typically callable at any time. The discount margin reflects the additional spread impact of buying a loan below par amortized over what is typically assumed to be a three-year … Continue reading It also seems attractive relative to the OAS on high-yield bonds, which at 336 bps is within the bottom quartile of its observed values.
Credit bears may concede these basic points, but they do like to highlight theoretical threats. One is the potential lack of buyers should a large piece of this record BBB issuer universe be downgraded and become what are known as “fallen angels.” The US investment-grade index now has a $5 trillion market cap, and nearly 50% of this is rated BBB—this $2.4 trillion segment is the equivalent of nearly twice the overall high-yield market capitalization. If a large share of these bonds were downgraded to BB, one argument goes, they might swamp available high-yield market demand and cause spreads to move dramatically wider.
This event is possible, and the unprecedented size of the BBB market magnifies the risk. Investors should watch signals, such as, rating agency downgrade “watchlists” closely. Still, there are several reasons why the worst-case scenario might not occur. Some of the growth in BBB-rated bonds has been due to large mergers& acquisition deals. The top ten BBB borrowers account for the equivalent of about 40% of the high-yield index, and the recently approved AT&T and Time Warner merger will add almost another $160 billion to the mix. Fundamentals for these issuers could improve if merger synergies play out as hoped. If they do not and some of these large issuers were downgraded to high yield, the potential for at least short-term volatility is significant. Another feature of the growing BBB bucket is the rising weight of financials, which now account for over 20% of this bucket, nearly double their share from ten years ago. Some analysts argue the more highly regulated nature of this sector reduces its default risk.
One wildcard in terms of market impact is that the lack of new high-yield supply in recent years may mean some investors welcome the chance to examine new names and opportunities. There have been several historical instances where large percentages of the investment-grade market were downgraded, most recently in 2009 (financials) and before that in 2005 (autos). During each episode, while spread widening occurred prior to the downgrade, these credits then outperformed similarly rated peers after their demotion. This time around the potential volumes involved are larger and so too are the risks, but the better news is the ability of banks to intermediate and help contain some of the technically driven selling that also may be increasing given proposed rollbacks to the Dodd-Frank Act.
Do Rising Rates Threaten Debt Serviceability?
Recent rate hikes are raising the cost of servicing current debt loads, and the Fed is expected to continue tightening into 2019. Rising short-term yields (Libor in particular) have prompted concern over leveraged loan issuer fundamentals. The better news is that improved debt coverage ratios for many of these borrowers provide some cushion. Using a stylized example, a new borrower with the current index average coverage ratio (EBITDA times interest expense) of 4.0, that borrowed at a spread of 300 bps over three-month Libor, would see their coverage ratio drop to around 3.4x if Libor increased 100 bps from today’s 2.3% level, only slightly above the 3.2x long-term average coverage ratio for sub-investment grade borrowers. Short-term rates are unlikely to rise in isolation. If stronger economic growth justifies further upward pressure, there would likely be offsetting increases in cash flow and negotiating power for issuers (resulting in lower credit spreads) to offset the impact. The risk, of course, is that rates rise due to inflationary pressures rather than growth (perhaps spurred by increased tariffs), albeit issuers would retain some ability to boost their top line.
So Far Not So Bad, but Don’t Get Complacent
Though the fundamental economic backdrop for credit looks reasonable, risks are undoubtedly growing. These include weakening quality of loan documentation, with record numbers (over 85%) of all loans now being issued in so-called “covenant-lite” or “cov-lite” format. This means investor protection via measures like financial covenants (which may limit leverage) and negative covenants (which for example might restrict payments to equity owners) are eroded (Figure 6). Fewer or less onerous covenants reduce the ability of creditors to influence a struggling business or intervene to protect their claims. As a new trend, there is not much data to determine whether weaker documents will lower returns going forward. A recent Standard’s & Poor’s study found that loans with stronger covenants had slightly higher recoveries for creditors than ones with lighter restrictions, but this difference based on a very small sample. Not everyone shares the concern over cov-lite. Some managers argue that fewer restrictions increase issuer flexibility during downturns, and the absence of covenants doesn’t weaken the incentive of equity owners to a viable and profitable business.
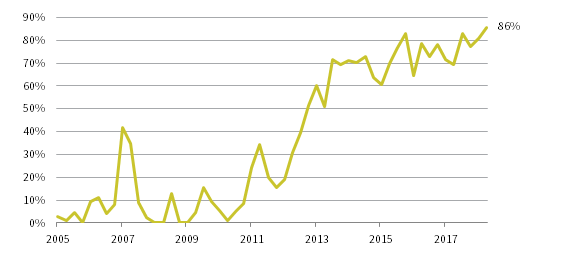
FIGURE 6 PORTION OF NEW LEVERAGED LOAN ISSUANCE CLASSIFIED AS COV-LITE
First Quarter 2005 – Second Quarter 2018
Sources: BofA Merrill Lynch and S&P/LCD.
Note: Data are quarterly.
Less discussed, but worrying for loan investors, is the growing reliance of some borrowers on purely loan financing, which removes a loss-absorbing bond or equity related layer that is typically subordinate to loans in the capital stack. According to Barclays, 58% of the issuers in the loan market only have loans in their debt structure, up from 39% as recently as the end of 2012.
For our perspective on loan recoveries, please see Tod Trabocco, “Senior Loans: Recovery Rates May Fall in Next Downturn,” Cambridge Associates Research Note, August 2018.
Compounding the risk are two additional dynamics: the falling share of new loan packages including subordinated second lien debt (another buffer), as well as the fact that a growing number of high-yield bond deals are being issued pari passu with loans. These trends could reduce loan recoveries when the default rate picks up from its current low level, though the absence of covenants could make this default cycle longer and shallower than predecessors.
Loan investors should be concerned not just about the absence of certain financial covenants in documents but also the growing liberties that issuers are taking in calculating certain financial ratios. Specifically, the use of so-called EBITDA “add backs” is growing, where loan issuers exclude certain expenses or add certain expected revenues to help increase reported cash flows and thus depress leverage ratios. According to Covenant Review, a shocking 30% of the EBITDA that was reported by loan issuers for last quarter had been generated by these adjustments, nearly 50% more than had been reported three years ago. Although some of these future revenues or efficiencies may arise, companies could find debt burdens much harder to service if they do not.
Another risk for credit markets is perhaps the hardest to navigate: the worsening technical backdrop for bonds given central banks are pulling back from asset purchases and allowing their balance sheets to shrink. Quantitative easing has had a powerful impact on credit by forcing yield-starved investors to migrate down the credit curve and into areas like investment-grade or even high-yield bonds. Since last September, the Fed has shrunk its balance sheet by roughly $200 billion, and the pace of shrinkage will accelerate over the next quarter (Figure 7). Meanwhile, the European Central Bank is still buying assets but has slashed the volume to around €30 billion per month, and the pace will drop further later this year. As central banks pull back and yields on safe assets rise, yield-sensitive investors may be more able to meet their return bogeys in safe assets like sovereign bonds, thus spurring a pull-back from credit. The better news is that central banks will be watching closely for signs of stress, and may change course if asset markets warrant it.
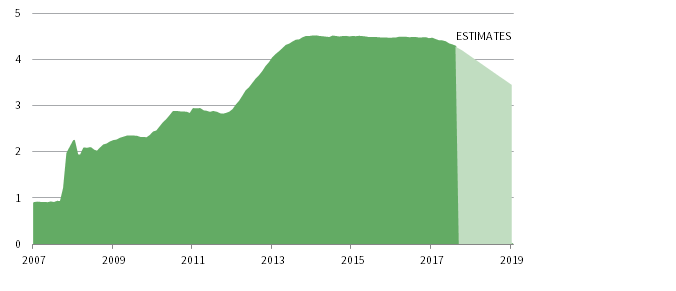
FIGURE 7 CUMULATIVE BALANCE SHEET ASSETS FOR US FEDERAL RESERVE
December 31, 2007 – December 31, 2019 • USD Trillions • Estimates begin after July 31, 2018
Sources: Federal Reserve and Thomson Reuters Datastream.
Notes: Data are monthly. Estimates are based on US Federal Reserve announcements regarding its asset purchase plan through the end of 2019.
A significant wildcard in assessing the current health of the credit markets is where we are in the economic cycle. The US economic expansion looks long in the tooth in terms of duration (entering its tenth year), but overall growth has been fairly mild thus far and many traditional signals (e.g., inflation, housing, household leverage, etc.) do not indicate we are late cycle. The recently announced corporate tax cuts and fiscal stimulus in the United States could provide issuers with a cushion during the next downturn, though their benefit will fade over time and recent trade wars are an existential threat. Reflecting the current benign environment, today’s 1.1% default rates for high-yield and loan borrowers are less than one-third their historical average.
What Should Investors Do About All This?
We believe investors should be selective in their credit exposures in this environment. Risks are rising, including interest rates, weaker underwriting, and the removal of the important central bank back-stop that has intensified the thirst for yield in recent years. Set against this is a reasonable benign economic backdrop in the United States, healthy credit fundamentals, and valuations that seem reasonable in at least some asset classes.
Looking at sub-investment-grade US credit, we are unenthused about the category overall (more due to valuations than concern over fundamentals); most categories are not priced to generate equity-like returns. The flipside is that some assets may have defensive qualities during a significant market downdraft, though weaker loan documentation and liberties with financial reporting may reduce this buffer. Given the lack of transparency in documentation, what seems more certain is that investors are better off with active rather than passive exposure. Caution about rising rates makes us lean toward loans versus high-yield bonds given their floating-rate nature, but we assume recoveries will be lower than historical averages given the slimmer-than-average cushion below loans in the capital structure and their weaker covenants.
Despite improved valuations, the relatively long duration and weakening credit quality of investment-grade bonds reduces their attractiveness and makes index-like exposures less suitable for safe-haven allocations. An additional risk for this category is that a large concentration of BBB-rated companies could be downgraded in a short timeframe and swamp available demand from high-yield investors. This also suggests high-yield investors will need to watch investment-grade fundamentals more carefully than has previously been the case. Investors comfortable with more credit risk may find the higher-quality end of the high-yield spectrum (i.e., BB-rated bonds) more attractive than the lower-quality end of the investment-grade spectrum (BBB-rated bonds). The yield on BB bonds is now 122% of that on BBB bonds (5.42% versus 4.3%), in line with its historical average, and the duration of the BB index is around three years less than that of BBBs. Less compelling is the current spread differential between BBs and BBBs, around 90 bps or bottom quintile.
For more on this please see our publications “Outlook 2018: Stick Around for Dessert,” Cambridge Associates Research Report, 2017 and Wade O’Brien, “A Supportive Argument for Structured Credit,” Cambridge Associates Research Note, March 2017.
Although we believe current concerns over US investment-grade and higher-yielding credits are overblown, we still prefer other credit sectors. Specifically, we favor asset-backed securities backed by claims against residential and commercial mortgages, as well as collateralized loan obligation debt tranches backed by pools of loans. Many of these assets offer floating-rate coupons, solid fundamentals, and more spread for each rating category compared with corporate equivalents. We also remain constructive on several private credit strategies, especially if investors can afford to lock up capital and do not need regular income distributions. The caveat today is that the large volume of capital raised (for example, in US direct lending) has lowered yields and weakened documentation, so careful manager selection is once again key to prospective returns.
Wade O’Brien, Managing Director
Brandon Smith, Senior Investment Associate
Footnotes