Global markets rallied in 2023, as signs of disinflation in major economies led investors to anticipate central bank rate cuts in 2024. Global yields declined sharply in late 2023, which saw bonds rally and helped boost the returns of equity markets and rate-sensitive sectors. The performance of New Zealand equities, however, trailed that of their global counterparts, as more persistent domestic inflation and tighter financial conditions placed a pronounced drag on economic growth and corporate earnings. Heading into 2024, these headwinds persist. Although slower-than-expected growth could prompt the Reserve Bank of New Zealand (RBNZ) to shift from its current hawkish policy guidance, the timing remains uncertain, given the central bank’s focus on reining in domestic inflationary pressures. As such, New Zealand equity performance may remain muted in 2024, while the currency could also weaken, given its procyclical nature. On the other hand, the outlook for New Zealand government bonds is more positive, given higher starting levels of yields and with the RBNZ near or at the end of its tightening cycle.
Macro
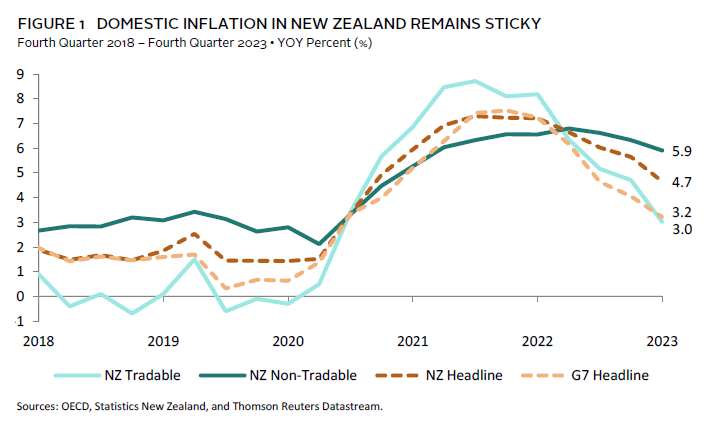
Economic activity in New Zealand slowed sharply in 2023, given headwinds from stickier inflation and tighter financial conditions. Relative to other major central banks, the RBNZ tightened monetary policy more aggressively throughout 2022–23, taking its Official Cash Rate to 5.50% by May 2023. Despite keeping policy rates at restrictive levels since, domestic inflation in New Zealand took longer to normalise than elsewhere, given higher levels of net immigration and the continued recovery in the tourism sector. Although New Zealand’s headline CPI rolled over to 4.7% year-over-year in fourth quarter 2023, it was largely driven by a decline in tradable inflation. In contrast, non-tradable inflation remained sticky at 5.9% year-over-year, albeit is showing signs of peaking (Figure 1).
Still, higher rates in New Zealand have negatively impacted economic growth. Consumer spending on services, which had been more resilient, rolled over in third quarter 2023. At the same time, rate-sensitive sectors such as durable goods, non-residential real estate, and other business investments are seeing larger declines. As a result, New Zealand’s economy contracted by 1.5% year-over-year in third quarter 2023. Following the disappointing numbers, and alongside the Federal Reserve’s pivot in policy guidance, markets had brought forward their expectations of rate cuts by the RBNZ to support growth, with futures pricing as of the end of January suggesting approximately 90 basis points (bps) of cuts by July 2024.
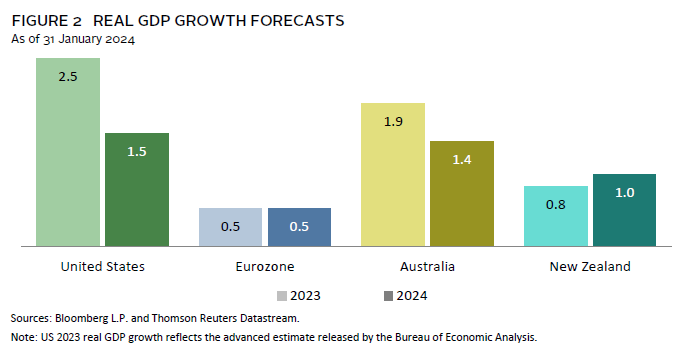
For 2024, the economic outlook for New Zealand remains muted. Rate-sensitive sectors are likely to remain under pressure until the RBNZ moves to ease policy. This easing may not occur until the central bank sees stickier segments of domestic inflation trending to target, or if growth surprises more sharply to the downside. The economy is also set to lose some support from government spending as policy makers have committed to reducing the budget deficit this year to promote price stability. Consensus forecasts at the end of January still expect New Zealand’s economy to expand by 0.8% in full year 2023 and for growth to improve modestly in 2024 to 1.0% (Figure 2). Still, these growth expectations remain slower than in the United States and Australia, although more resilient as compared to Europe. Embedded in these forecasts are also expectations of more aggressive policy easing by the RBNZ in the second half of this year, and some of these expectations have since pulled back in February. Hence, a key risk to these growth expectations is if the central bank continues to maintain a more hawkish stance and falls behind the curve in combating slowing growth.
Equities
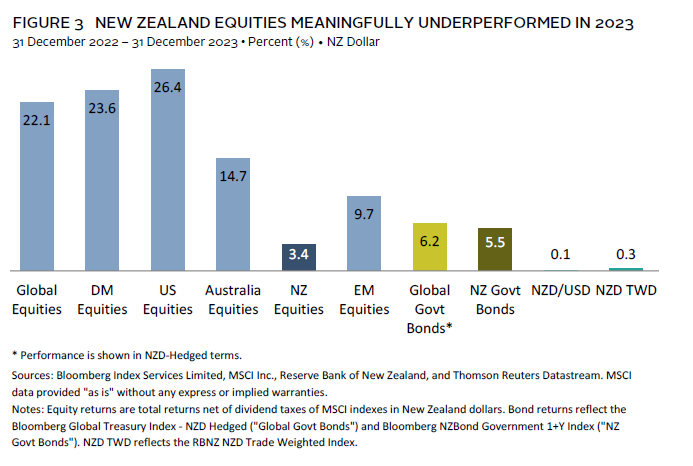
The MSCI New Zealand IMI returned 3.4% in 2023 in New Zealand dollar (NZD) terms, underperforming its developed markets (DM) peers (23.6%) by more than 20 percentage points (Figure 3). Contributing to its underperformance is the market’s underweight to IT and other technology stocks, which drove DM equity gains in 2023. The rate-sensitive nature of New Zealand equities also impacted performance, with New Zealand’s high-yielding stocks under pressure for much of 2023 as global bond yields moved higher. Although New Zealand equities recovered in fourth quarter 2023 alongside their DM peers amid a sharp decline in global bond yields, they continued to underperform, as tighter financial conditions and slower domestic growth drove corporate earnings lower.
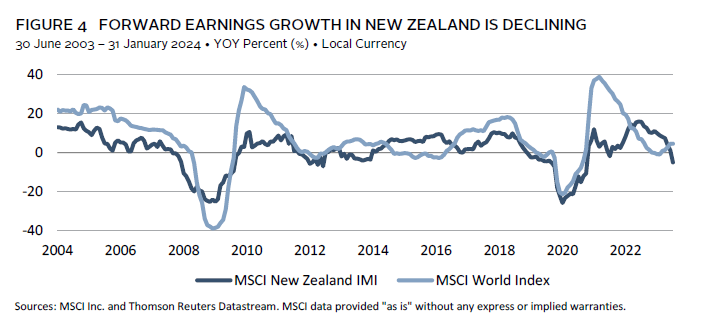
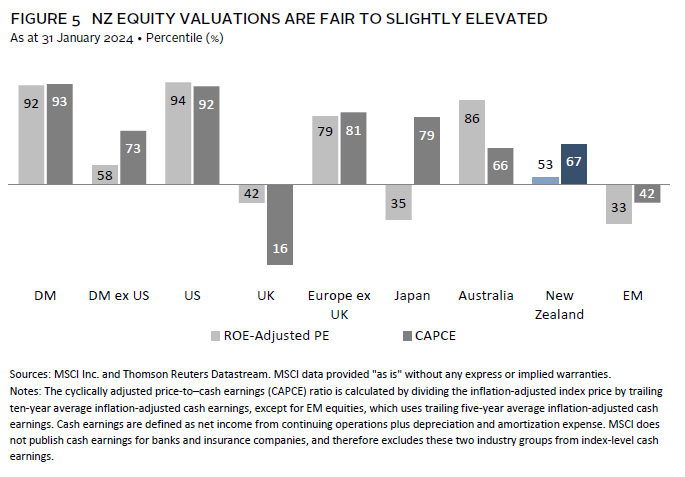
On a year-over-year basis, the 12-month forward earnings growth for New Zealand equities has turned negative and does not yet show signs of bottoming out (Figure 4). This is a contrast to earnings expectations for DM equities, which are ticking up. At the same time, valuations for New Zealand equities have corrected, but they remain at fair to slightly elevated levels (Figure 5). Given the weaker outlook for New Zealand’s economy and earnings growth, the performance of its equity market may remain muted in 2024, particularly as valuations still present downside risks.
Relative to global equities, however, the outlook for New Zealand equities is mixed. Valuations for other major DM equities have also run up, and earnings estimates remain optimistic given expectations of more aggressive rate cuts in the United States and Europe, which may lead to greater disappointment if these do not play out. Further, if current rate cut expectations for 2024 do occur but are due to a meaningful slowdown in global economic activity, New Zealand equities may still fare better, given their more defensive nature. Overall, we are neutral on the outlook for New Zealand equities relative to global equities in 2024. Instead, we recommend a tactical overweight to DM small caps and DM value equities, where valuations are more priced for an economic downturn scenario and can offer significant upside potential if global activity picks up. Valuations for emerging markets (EM) also appear favourable, although this is largely due to China, whereas EM ex China valuations are mixed. We recommend a modest tactical overweight to Chinese equities, given depressed valuations, and see increased monetary and fiscal stimulus in China as the catalysts to trigger a sharp rally.
Bonds
Global government bonds recovered in 2023 from a difficult year in 2022. New Zealand government bonds returned 5.5% in 2023 in local currency terms, slightly underperforming global government bonds, which returned 6.2% in NZD-hedged terms. Gains had been supported by the sharp decline in yields over fourth quarter 2023, as signs of disinflation in the United States and Europe, along with a pivot in the Fed’s policy guidance, led to markets pricing in more rapid rate cuts in 2024. Although the RBNZ has maintained a relatively more hawkish guidance in comparison through the end of the year, New Zealand government bond yields nevertheless declined sharply over the fourth quarter alongside their global peers.
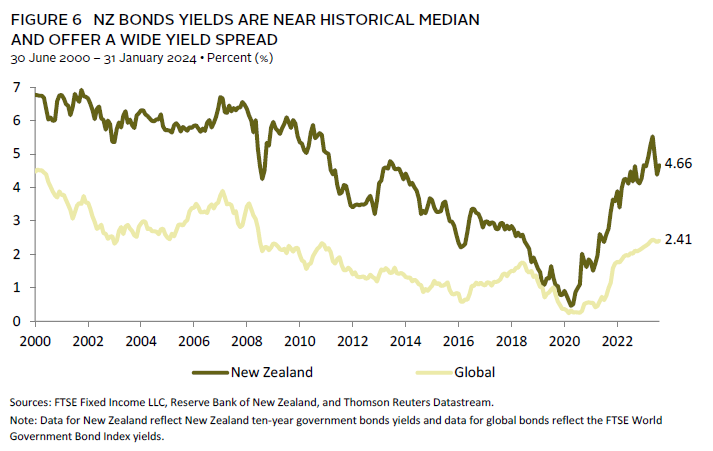
A near-term risk to New Zealand government bond performance is if current market-implied rate expectations do not play out as quickly, particularly given stickier inflationary pressures in New Zealand and the RBNZ’s more hawkish stance. While the United States and Europe face the same risk, the Fed and the European Central Bank may have more leeway to ease policy, given inflation there has shown greater signs of trending to target. Still, the outlook for New Zealand government bonds remains positive in 2024, given higher starting levels of yields and with the RBNZ near or at the end of its tightening cycle. The start of the RBNZ’s policy easing to combat slowing growth would lend support to New Zealand government bond performance, as will their positive interest rate differentials versus global government bonds, which remain wide at 225 bps as of the end of January (Figure 6).
Currency
The NZD ended 2023 relatively flat against the US dollar (0.1%) and in trade-weighted terms (0.3%), although the currency was volatile and its performance against its major trade weight currency partners was mixed. The NZD had weakened against the USD for much of 2023 before rebounding amid a sharp repricing of rate expectations in the United States. Against other currencies, the NZD declined modestly against the euro and Australian dollar but gained relative to the yen, given wider rate differentials and where the Bank of Japan (BOJ) is maintaining looser monetary policy. Declining prices of New Zealand’s key commodity exports had weighed on the currency throughout 2023, although these were partly offset by a moderation in global energy prices.
In 2024, pressure on the NZD against the USD may ease further as the Fed begins to cut rates and if the RBNZ is slower to pivot. Real exchange rate valuations also support room for upside, given that the NZD is now below fair value versus the USD. Still, downside risks remain in relation to the uncertainty over the timing and scale of Fed rate cuts, which could come in slower than currently priced in considering economic data in the United States remain more resilient than elsewhere. Slowing domestic growth is also a risk, given the procyclical nature of the NZD means it tends to fall as economic activity weakens.
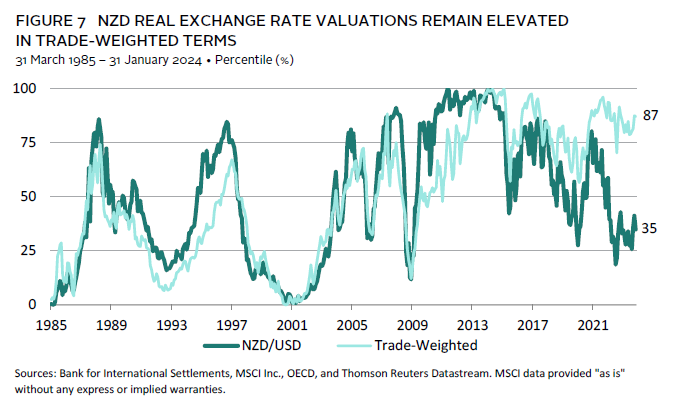
The outlook for the NZD’s performance against other major currencies is weaker (Figure 7). Elevated valuations are a headwind, with the NZD remaining expensive versus the Australian dollar, euro, and yen. Fed rate cuts and a weaker USD could drive a rally in these other major currencies, while, separately, the yen could benefit from a BOJ pivot to policy tightening. The uncertainty in the outlook over global energy prices given geopolitical tensions in the Middle East and Ukraine is another risk, particularly as New Zealand’s current account deficit remains wide, albeit improving.
Conclusion
The outlook for New Zealand’s economic growth and equity market remains muted in 2024. Rate-sensitive sectors of New Zealand’s economy and corporate earnings are likely to remain under pressure until the RBNZ pivots to policy easing, which may take longer, given stickier levels of domestic inflation. On the other hand, there is the risk that the central bank keeps financial conditions too tight for too long, which could trigger a more severe decline in economic activity and further weigh on New Zealand’s equity market. Although earnings expectations in New Zealand look more priced for a downturn scenario than their DM counterparts, downside risks remain, given fair to slightly elevated valuations. As such, we are neutral on the outlook for New Zealand equities in 2024. Instead, we favour DM small caps and DM value equities, as well as Chinese equities, as we see catalysts for these to outperform while valuations are also more attractively priced.
In contrast, we remain positive on New Zealand government bonds in 2024. Yields today are fair relative to history, and the asset class could benefit as the RBNZ pivots to policy easing to counter slowing growth. New Zealand government bonds also continue to offer an attractive yield spread versus their global counterparts. Positive rate differentials could support the performance of the NZD against the USD in 2024, as will the start of Fed rate cuts, but the currency is procyclical in nature and could still weaken if domestic growth continues to weaken. In trade-weighted terms, the NZD may also come under pressure, particularly given the country’s wide current account deficit and very elevated real exchange rate valuations.
Aaron Costello, Regional Head for Asia
Vivian Gan, Associate Investment Director, Capital Markets Research
Index Disclosures
Bloomberg Global Treasury Index
The Bloomberg Global Treasury Index tracks fixed-rate local currency government debt of investment-grade countries. The index represents the Treasury sector of the Global Aggregate Index and is currently denominated in 28 currencies. The three major components of this index are the US Treasury Index, the Pan-European Treasury Index, and the Asian-Pacific Treasury Index, in addition to Canadian, Chilean, Mexican, and South African government bonds.
Bloomberg NZBond Government 1+ Year Index
The Bloomberg NZBond Government 1+ Year Index is engineered to measure the market of securities issued by the New Zealand government. This is a legacy UBS index. It is a rules-based, market value–weighted index, which includes bonds maturing in 1+ years.
FTSE World Government Bond Index
The FTSE World Government Bond Index measures the performance of fixed-rate, local currency, investment-grade sovereign bonds. The index is a widely used benchmark that currently includes sovereign debt from more than 20 countries, denominated in a variety of currencies, and has more than 30 years of history available. The index provides a broad benchmark for the global sovereign fixed income market. Sub-indexes are available in any combination of currency, maturity, or rating.
MSCI All Country World Index
The MSCI All Country World Index represents a free float–adjusted, market capitalization–weighted index that is designed to measure the equity market performance of the full opportunity set of large- and mid-cap stocks across 23 developed and 24 emerging markets. It covers more than 2,800 constituents and approximately 85% of the free float–adjusted, market capitalization in each market. The developed markets country indexes included are: Australia, Austria, Belgium, Canada, Denmark, Finland, France, Germany, Hong Kong, Ireland, Israel, Italy, Japan, the Netherlands, New Zealand, Norway, Portugal, Singapore, Spain, Sweden, Switzerland, the United Kingdom, and the United States.The emerging markets country indexes included are: Brazil, Chile, China, Colombia, Czech Republic, Egypt, Greece, Hungary, India, Indonesia, Korea, Kuwait, Malaysia, Mexico, Peru, the Philippines, Poland, Qatar, Saudi Arabia, South Africa, Taiwan, Thailand, Turkey, and the United Arab Emirates.
MSCI Australia Index
The MSCI Australia Index is designed to measure the performance of the large- and mid-cap segments of the Australia market. With 58 constituents, the index covers approximately 85% of the free float–adjusted market capitalization in Australia.
MSCI Emerging Markets Index
The MSCI Emerging Markets Index captures large- and mid-cap representation across 24 emerging markets countries. With 1,440 constituents, the index covers approximately 85% of the free float–adjusted market capitalization in each country. Emerging markets countries include: Brazil, Chile, China, Colombia, Czech Republic, Egypt, Greece, Hungary, India, Indonesia, Korea, Kuwait, Malaysia, Mexico, Peru, the Philippines, Poland, Qatar, Saudi Arabia, South Africa, Taiwan, Thailand, Turkey, and the United Arab Emirates.
MSCI New Zealand Investable Market Index
The MSCI New Zealand Investable Market Index (IMI) is designed to measure the performance of the large-, mid-, and small-cap segments of the New Zealand market. With 23 constituents, the index covers approximately 99% of the free float–adjusted, market capitalization in New Zealand.
MSCI US Index
The MSCI US Index is designed to measure the performance of the large- and mid-cap segments of the US market. With 609 constituents, the index covers approximately 85% of the free float–adjusted market capitalization in the United States.
MSCI World Index
The MSCI World Index captures large- and mid-cap representation across 23 developed markets countries. With 1,480 constituents, the index covers approximately 85% of the free float–adjusted market capitalization in each country. Developed markets countries include: Australia, Austria, Belgium, Canada, Denmark, Finland, France, Germany, Hong Kong, Ireland, Israel, Italy, Japan, the Netherlands, New Zealand, Norway, Portugal, Singapore, Spain, Sweden, Switzerland, the United Kingdom, and the United States.
RBNZ NZD Trade Weighted Index
The RBNZ NZD Trade Weighted Index (TWI) measures the value of the New Zealand dollar (NZD) against New Zealand’s major trading partners. It is the Reserve Bank’s preferred summary measure for capturing the medium-term effect of exchange rate changes on the New Zealand economy and inflation. Data for the nominal TWI (17) are available from 1984.