Global markets struggled in 2022 as inflation across major developed economies soared to decades-high levels. In New Zealand, the combination of rising prices and the central bank’s early monetary policy tightening meant that economic growth started off weak, only picking up following the reopening of New Zealand’s borders. Against this backdrop, New Zealand markets had difficulty gaining ground, although they still demonstrated greater resilience than many of their global counterparts. For 2023, the Reserve Bank of New Zealand’s (RBNZ) commitment to taming inflation combined with a weakening outlook for domestic growth imply that New Zealand’s equity market could remain under pressure. New Zealand government bond yields also have further room to rise as a result – although the upside is more limited given the higher level of starting yields – and will provide some support for the currency.
Macro
Last year was challenging for New Zealand. In response to rising inflationary pressures in late 2021, the RBNZ started tightening monetary policy earlier than most other central banks, raising its official cash rate (OCR) by 450 basis points (bps) from 0.25% in October 2021 to 4.75% as of February 2023. Yet, despite its actions, global supply shocks and supply chain disruptions resulting from the war in Ukraine, together with a tight labour market, meant that domestic inflationary pressures took longer to normalise. As a result, New Zealand’s headline inflation rose well above the RBNZ’s upper target of 3.0%, peaking at 7.3% on a year-over-year (YOY) basis in second quarter 2022 before moderating slightly to 7.2% YOY as of fourth quarter 2022 (Figure 1).
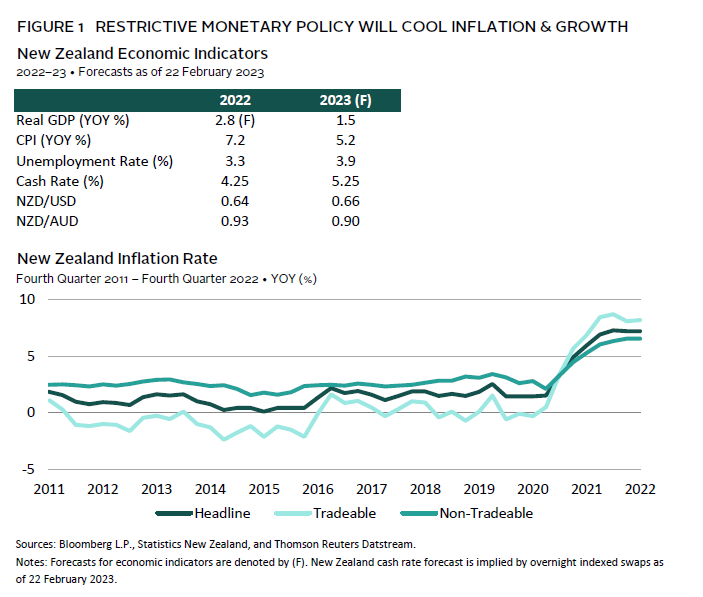
Although inflation in New Zealand did not rise to the levels seen in other major developed countries, it also has not shown clear signs of rolling over, as is the case in the United States where the Federal Reserve took on more aggressive tightening. The fall in global energy prices has contributed to a decline in tradable inflation, however the faster-than-expected recovery in the tourism and services sector, combined with a labour shortage, has resulted in New Zealand’s non-tradable inflation component taking longer to decelerate. The recent devastation caused by Cyclone Gabrielle has compounded the inflation risks, as it is likely to drive short-term volatility in food prices and add to price pressures in the medium term as fiscal support measures for rebuilding efforts are introduced. Furthermore, it remains to be seen how China’s reopening will offset cooling growth and demand in other parts of the world and whether this will refuel New Zealand’s import inflationary pressures. As such, market implied rates show that the RBNZ will hike by another 50 bps in 2023 – taking its OCR to 5.25% – to combat inflationary pressures.
With the RBNZ expected to take rates to more restrictive levels, New Zealand’s economic growth is likely to come under pressure. Consensus forecasts show real GDP growth slowing from 2.8% in 2022 to 1.5% in 2023, but this masks the fact that a large portion of recent growth has been derived from a tourism sector rebound, while domestic activity is slowing. Real house prices are declining sharply on a YOY basis, and consumer confidence has slumped to a record low. New Zealand’s ten-year/two-year yield curve is also now inverted. Although this measure arguably is less reliable as a predictor for New Zealand recessions given its tendency to stay inverted for longer, the same consensus forecasts show that New Zealand is expected to enter a technical recession beginning in the second half of the year. Further weighing on the growth outlook for New Zealand is the impact of Cyclone Gabrielle, which will cause a contraction in production and consumption in the near term until reconstruction activities help to provide a boost to activity. Overall, as the RBNZ continues its battle with inflation, we view that the positive momentum in New Zealand’s economic growth will turn and weaken over 2023.
Equities
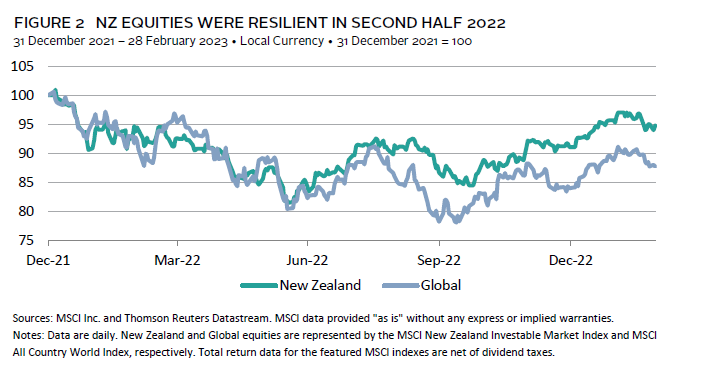
New Zealand equities faced selling pressure in 2022 but outperformed their global counterparts. The MSCI New Zealand IMI returned -8.9% in New Zealand dollar (NZD) terms, outpacing the MSCI All Country World Index by 2.7 percentage points (ppts) in NZD terms and by 7.1 ppts in local currency terms. The relative outperformance was driven by more resilient earnings growth in the second half of 2022, which helped to offset some of the drag from a compression in valuations (Figure 2). This came as more aggressive rate hikes by the Fed and other major central banks weighed on the global outlook for growth, while New Zealand was benefitting from a surge in tourism-related growth. The subsequent decline in global bond yields in late 2022 also contributed to New Zealand equities’ outperformance given the yield-sensitive nature of the market.
For 2023, the cooling outlook for New Zealand’s domestic economy remains a key risk. At the moment, the 12-month forward earnings growth for New Zealand equities is still positive, implying that the odds of a domestic recession and its impact on corporate earnings and profitability are not yet priced in. From a valuation perspective, there is also further downside risk for New Zealand equities given that valuations remain slightly above fair value relative to history, and thus not priced for a recession (Figure 3).
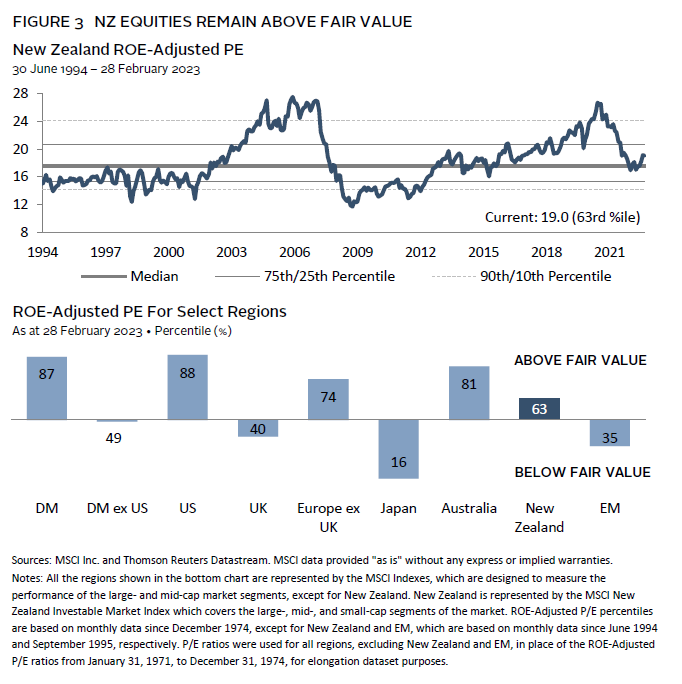
Relative to global equities, New Zealand equities also do not look cheap, except against US and Australian equities. Weakening global growth could continue to support New Zealand equities’ relative performance given their exposure to more defensive names. However, absent a sharp recessionary shock, rates and commodity prices may remain elevated for longer, and New Zealand equities would run the risk of underperforming value-biased regions such as Australia and the United Kingdom – as they did in 2022. As such, an allocation toward global value equities could help add diversification to portfolios, while at the same time emerging markets and Chinese equities still offer further upside potential as China recovers from the lifting of its zero-COVID policy.
Fixed Income
Last year was difficult for equities and fixed income markets alike. New Zealand government bonds returned -9.2% for the year in local currency terms, the worst performance on record based on available index history[1]Data for the Bloomberg NZBond Government 1+ Year Index begin January 1996.. With the RBNZ taking on more aggressive monetary policy tightening compared to most other major developed countries, yields for ten-year New Zealand government bonds continued to rise sharply throughout most of last year, ending February 2023 at 4.64% (Figure 4). Spreads for New Zealand government bond yields relative to global government bond yields widened further as a result, ending February at 253 bps. Nevertheless, the performance of global government bonds[2]Data reflect the Bloomberg Global Treasury Index – NZD Hedged. (-11.2%) in NZD-hedged terms had lagged that of New Zealand government bonds over 2022 given the former’s higher duration.
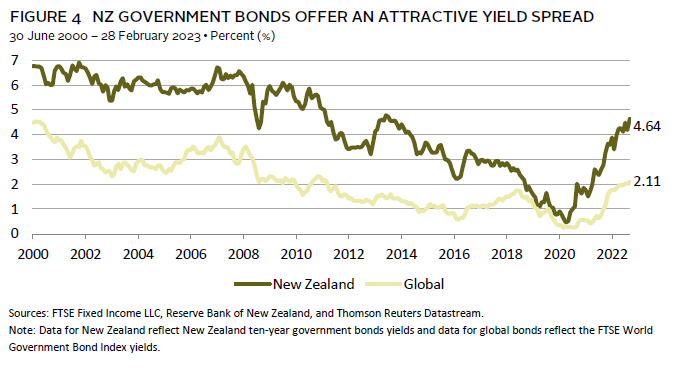
With the RBNZ remaining hawkish and expected to take its OCR to 5.25% this year, New Zealand government bond yields may have more room to rise. However, to the extent that yields are now not as suppressed relative to history, the upside for yields is more limited today, especially when considering the cooling housing market and inflation numbers starting to peak. The same can be said for global bond yields, where most major central banks are expected to take rates higher this year but at a slower pace. A more severe than expected downturn in the United States and Europe would upset this view, and global bonds yields would fall amid a policy pivot and a capital flight to safety. However, New Zealand bonds would continue to offer a higher yield spread, and the RBNZ may also ease policy in such an event. Therefore, we continue to favour New Zealand government bonds over global government bonds in 2023.
Currency
The New Zealand dollar had a volatile year in 2022. The currency fell 17% over the first three quarters against the US dollar before rallying 12% in fourth quarter 2022, resulting in a net decline of 7.3% against the US dollar for the year. The initial weakness of the New Zealand dollar was not idiosyncratic but rather driven by the broad-based strength of the US dollar given the rapid pace of Fed tightening and increasingly risk-off sentiments, factors that reversed in fourth quarter 2022. Relative to other developed markets currencies, the New Zealand dollar appreciated relative to the pound and the yen but weakened modestly against the Australian dollar and euro.
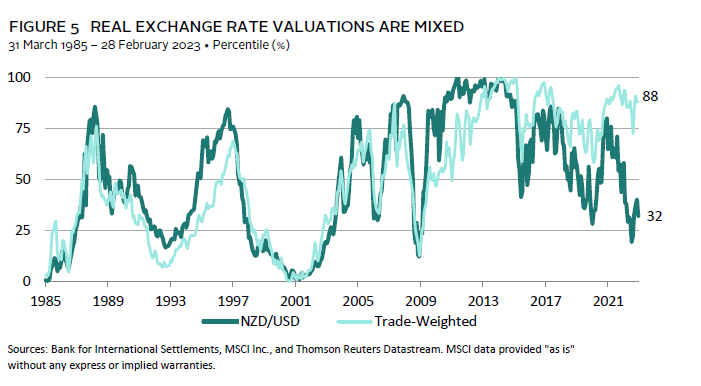
Valuations and the outlook for the New Zealand dollar are now mixed (Figure 5). The currency is very expensive on a real exchange rate basis in trade-weighted terms[3]Top five trade weights for New Zealand based on the Bank of International Settlements’ effective exchange rate (narrow index) are as follows: Australian dollar (23.8%), euro (22.4%), US dollar … Continue reading, but below fair value relative to the US dollar. Driving the elevated trade-weighted FX valuation is the currency relative to the Australian dollar, euro, and yen, which have also been weak relative to the US dollar over the past two years.
For 2023, a weakening US economy and a pause in the Fed’s tightening cycle may see the New Zealand dollar strengthen against the US dollar, a view that is currently expressed in the FX consensus forecasts. Higher levels of bond yields in New Zealand would also lend some support to the currency, as will the potential improvement in the country’s current account balance given the moderation in energy prices. However, other developed markets currencies would also rally in a weak US dollar environment, and thus the New Zealand dollar could still decline in trade-weighted terms, particularly given the outlook for slowing global growth and the procyclical nature of the New Zealand dollar.
Conclusion
New Zealand’s economy may continue to be challenged in 2023. The impact from Cyclone Gabrielle has weighed on the immediate growth outlook for the country, while at the same time the pressure from persistently higher inflation and more restrictive interest rates will be felt more acutely this year. The upside is that many of the global supply-side shocks that New Zealand has faced are abating, and thus headline inflation will gradually subside. The downside is that some of the price pressures remain driven by New Zealand’s domestic supply/demand imbalances, and hence domestic demand and activity may contract over 2023 as the RBNZ commits to its battle with inflation.
New Zealand equities could still demonstrate more resilience this year relative to their global counterparts if a slowdown in global growth leads to increased risk-off sentiments. However, the weaker outlook for New Zealand’s domestic economy itself is a headwind that will weigh on corporate earnings and its equity market. Furthermore, valuations for New Zealand equities remain slightly elevated, and the sector composition of the market is less favourable in an elevated inflation and rates environment. As such, we recommend New Zealand–based investors to diversify their portfolios with value equities and Chinese equities given China’s different economic cycle.
On the other hand, we are more positive on New Zealand government bonds in 2023. Yields today are no longer as depressed relative to history, and with the RBNZ looking to be approaching the peak of its tightening cycle, the outlook for the market is more attractive relative to a year ago. The New Zealand dollar could appreciate against the US dollar in 2023 as growth in the United States cools, and the Fed slows its pace of policy tightening. However, as other developed markets currencies would also recover in such an environment, the New Zealand dollar could still weaken in trade-weighted terms, particularly given very elevated current valuations.
Aaron Costello, Regional Head for Asia
Vivian Gan, Associate Investment Director, Capital Markets Research
Ilona Vdovina also contributed to this publication.
Index Disclosures
Bloomberg Global Treasury Index
The Bloomberg Global Treasury Index tracks fixed-rate local currency government debt of investment-grade countries. The index represents the Treasury sector of the Global Aggregate Index and is currently denominated in 28 currencies. The three major components of this index are the US Treasury Index, the Pan-European Treasury Index, and the Asian-Pacific Treasury Index, in addition to Canadian, Chilean, Mexican, and South African government bonds.
Bloomberg NZBond Government 1+ Year Index
The Bloomberg NZBond Government 1+ Year Index is engineered to measure the market of securities issued by the New Zealand government. This is a legacy UBS index. It is a rules-based, market value–weighted index, which includes bonds maturing in 1+ years.
FTSE World Government Bond Index
The FTSE World Government Bond Index measures the performance of fixed-rate, local currency, investment-grade sovereign bonds. The index is a widely used benchmark that currently includes sovereign debt from more than 20 countries, denominated in a variety of currencies, and has more than 30 years of history available. The index provides a broad benchmark for the global sovereign fixed income market. Sub-indexes are available in any combination of currency, maturity, or rating.
MSCI All Country World Index
The MSCI All Country World Index represents a free float–adjusted, market capitalization–weighted index that is designed to measure the equity market performance of the full opportunity set of large- and mid-cap stocks across 23 developed and 24 emerging markets. It covers more than 2,800 constituents and approximately 85% of the free float–adjusted, market capitalization in each market. The developed markets country indexes included are: Australia, Austria, Belgium, Canada, Denmark, Finland, France, Germany, Hong Kong, Ireland, Israel, Italy, Japan, the Netherlands, New Zealand, Norway, Portugal, Singapore, Spain, Sweden, Switzerland, the United Kingdom, and the United States. The emerging markets country indexes included are: Brazil, Chile, China, Colombia, Czech Republic, Egypt, Greece, Hungary, India, Indonesia, Korea, Kuwait, Malaysia, Mexico, Peru, the Philippines, Poland, Qatar, Saudi Arabia, South Africa, Taiwan, Thailand, Turkey, and the United Arab Emirates.
MSCI New Zealand Investable Market Index
The MSCI New Zealand Investable Market Index (IMI) is designed to measure the performance of the large-, mid- and small-cap segments of the New Zealand market. With 23 constituents, the index covers approximately 99% of the free float–adjusted, market capitalization in New Zealand.
Footnotes