We remain neutral on Japanese stocks despite attractive valuations and near-term earnings potential in view of daunting intermediate-term macro challenges
- Japanese equities have underperformed global peers in recent months as investors fretted over the strengthening yen presenting a headwind to further earnings growth.
- Investors may be overestimating the significance of the currency to Japanese earnings and underestimating progress on corporate governance, progress on structural reforms, and upside from the ongoing global economic recovery.
- Attractive valuations and the potential to invest in active managers with strong track records of generating alpha means investors should ensure they are not underweight the asset class, but headwinds like demographics and large debt burdens make us cautious about longer-term prospects.
Japanese equities have had a strong run in recent years, returning 18.3% annualized over the five years to May 31, 2017—well above developed markets as a whole. Attractive starting valuations and earnings upside from a variety of cyclical and secular drivers boosted the asset class. Still, market turbulence along the way has challenged the conviction of many investors—a 21.2% drop during the first half of 2016 nearly derailed this streak. Yen depreciation has been a significant detractor for unhedged USD-based investors that were better off in US stocks over the past five years (Figure 1). Longer-term results have been lackluster and accompanied by significant volatility, explaining some of the investor ambivalence toward Japanese stocks. Despite more than doubling over the past five years (in yen terms), the asset class has returned less than 1% per annum over the past decade!
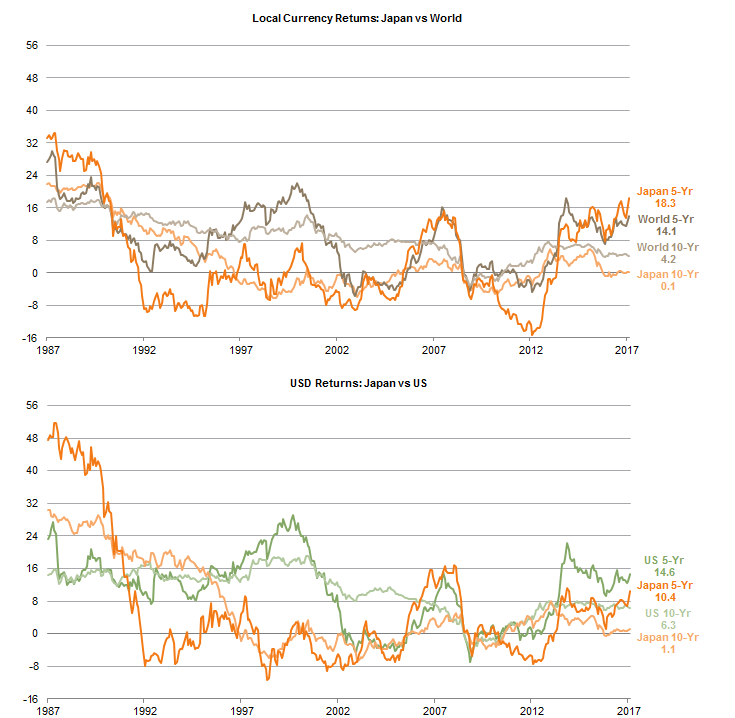
Figure 1. Five- and Ten-Year Rolling AACRs for Japanese Equities
April 30, 1987 – May 31, 2017 • Percent (%)
Sources: MSCI Inc. and Thomson Reuters Datastream. MSCI data provided “as is” without any express or implied warranties.
Notes: Data are monthly. Total returns for all MSCI indexes are net of dividend taxes.
We have been neutral on Japanese equities for almost a year, but with strong recent earnings growth and attractive absolute and relative valuations (Figure 2) it seemed appropriate to re-examine the prospects for Japanese equities. The case against Japan includes weak domestic economic growth, poor corporate governance, and management teams that are reluctant to manage balance sheets as aggressively as global peers. Other considerations include the sensitivity of earnings to currency fluctuations, as well as how low interest rates in Japan may depress consumer spending and financial sector profits going forward.
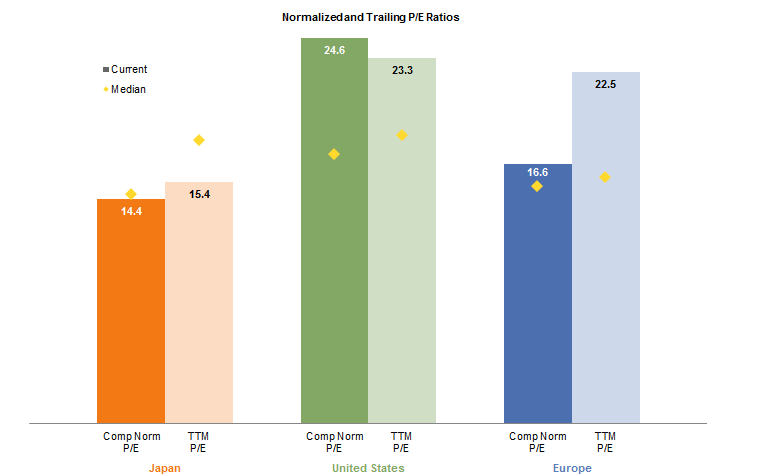
Figure 2. Comparing Japanese Equity Valuations to US and European Equities
As of May 31, 2017
Sources: MSCI Inc. and Thomson Reuters Datastream. MSCI data provided “as is” without any express or implied warranties.
Notes: For all regions, median trailing 12-month (TTM) P/E ratios are calculated from January 31, 2002, to present. The normalized P/E for Japan (ROE-adjusted P/E) uses the same history. Normalized P/Es (composite normalized P/E) for US and Europe use the full history from December 31, 1969. The composite normalized P/E ratio is calculated by dividing the inflation-adjusted index price by the simple average of three normalized earnings metrics: ten-year average real earnings (i.e., Shiller earnings), trend-line earnings, and ROE-adjusted earnings. The ROE-adjusted P/E ratio multiplies the current trailing P/E multiple by the ratio of current ROE to historical ROE for each market.
In this research note, we examine each of these factors and find that investors may be underestimating prospects for Japanese equities. We retain our neutral stance on Japan, but we remind investors that most are likely to find themselves underweight given positions held by international equity managers, and suggest they at least maintain a market weight position in light of the improving fundamental and macro picture.
Macro Picture Has Recently Improved; Long-Term Prospects Are Murkier
The domestic macro environment is slowly improving. The Japanese economy grew at a 1.0% pace during first quarter 2017, below initial estimates, but still has expanded for five straight quarters. Private consumption went from being a drag during the second half of 2016 to a major driver, as employment conditions improved and confidence rebounded. Global growth is also accelerating, helping Japanese companies that derive a large percentage of their earnings abroad. Exports have been another key contributor toward Japanese growth, expanding by around 12% year-over-year in March, the fastest pace since January 2015.
Meanwhile, stronger inflation and rate hikes in the United States have helped relieve pressure on the Bank of Japan (BOJ) to continue what had been an unprecedented bout of monetary expansion. Last September, the BOJ responded to market concerns over the impact of low interest rates by pivoting to a policy of yield curve targeting. Now, the BOJ is seeking to anchor the yield on the ten-year government bond around 0%, while allowing short-term rates below this target. Since then, the ten-year government bond yield has risen to around 0% (Figure 3) and shorter-term rates have remained negative, allowing the yield curve to steepen and helping financial sector profits.
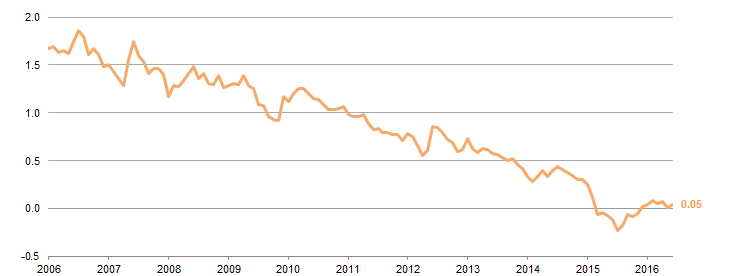
Figure 3. Ten-Year Japanese Government Bond Yields
December 31, 2006 – May 31, 2017 • Yield (%)
Source: Thomson Reuters Datastream.
The BOJ may have more flexibility to maintain its cheaper yen policy as initial concerns over import-led inflation fade. Consumer price inflation is barely above zero in Japan, and imports as a percentage of GDP are much lower than many peers. Gradually rising wages, especially for part-time workers, are also helping boost consumption.[1]Base wages rose around 1.0% for part-time workers in April 2017. Further, the political situation in Japan appears favorable relative to those in other developed markets. Prime Minister Shinzō Abe has generally enjoyed favorable poll numbers[2]Notwithstanding the recent scandal over donations to a nationalist school. and a change in his party’s rules on term limits means he could become Japan’s longest-serving post-war leader if he wins reelection in 2018.
These recent improvements in local conditions suggest current macro concerns are overstated, but it is not difficult to paint a more depressing longer-term picture. Demographics are expected to constrain Japan’s long-term economic growth, as the country’s workforce is shrinking by an estimated 500,000 workers per year. Government indebtedness soared during the financial crisis, due to efforts to prop up growth, and now stands at an astonishing 250% of GDP, possibly limiting policymakers’ options during the next downturn. Some analysts suggest concerns over debt levels are overstated—the net debt position is much lower and the cost of servicing this debt is quite low (given negative interest rates in many instances). Still, the fact that many households and companies hold this low-yielding debt limits their tolerance for inflation (which would reduce real yields) and creates a headwind for rising prices and, thus, corporate operating leverage.
Improvements in Corporate Governance, from a Low Base
During the last few years, the government has urged companies to improve governance and shareholder returns through measures like corporate tax cuts and the creation of the JPX Nikkei Index 400 in 2014. In response, companies have boosted shareholder payouts, added outside directors, and focused (for the first time) on metrics like return on assets (Figure 4). Recent data suggest companies are accelerating efforts to reward shareholders. Japanese companies returned an estimated ¥16.3 trillion to shareholders during the fiscal year that ended March 2016, the equivalent of around 3% of total market cap and well above levels seen in earlier years (Figure 5). When totals are recorded for the most recent fiscal year, they may reach ¥18.5 trillion. The amount of cash flow that is being plowed back into companies via capital expenditure is also falling, boosting metrics like return on assets.
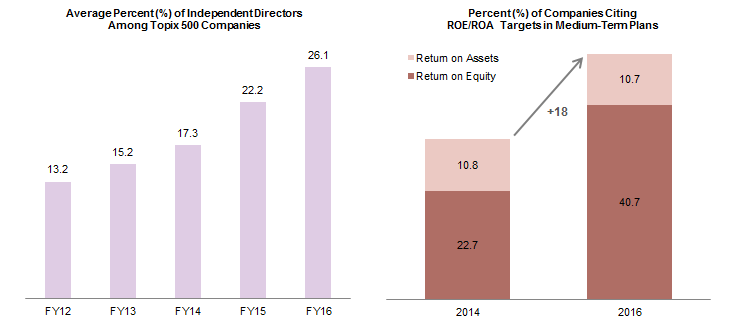
Figure 4. Japanese Corporate Governance
Sources: Deutsche Bank and Goldman, Sachs & Co.
Note: Japan’s fiscal year is from April to March, and is represented by the period in which it begins; for example, the fiscal year from April 1, 2016, to March 31, 2017, is called fiscal year 2016.
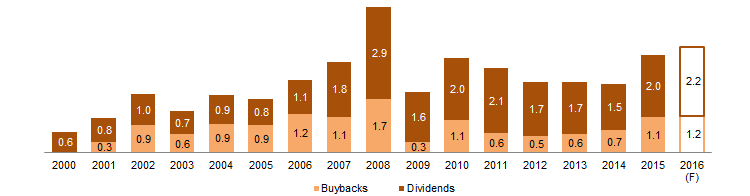
Figure 5. TOPIX Share Buybacks and Dividends as a Percentage of Market Value
Fiscal Years 2000–16 • Percent (%)
Sources: Bloomberg L.P., Goldman, Sachs & Co., and Tokyo Stock Exchange, Inc.
Notes: TOPIX share buybacks and dividends data are presented by fiscal year. Japan’s fiscal year is from April 1 to March 31, and is represented by the period it begins in; for example, the fiscal year from April 1, 2016, to March 31, 2017, is called fiscal year 2016. Share buybacks and dividends data are announced corporate actions derived from Bloomberg Equity Screening. Share buybacks and dividends data for fiscal year 2016, “2016 (F)”, are forecasted rough estimates based on analysis provided by Goldman Sachs Global Investment Research.
The market may be underestimating the pace of reform at many companies, but it is true that some companies are starting from a low base and have more to do before they catch up to global peers. For example, around 85% of board seats at S&P 500 companies are held by outside directors, more than three times the ratio in Japan. In a similar fashion, Japanese companies are becoming better stewards of capital for shareholders, but more can be done. Capital expenditure spending is declining as a percentage of operating cash flow, but historically has been higher than other developed markets (Figure 6), perhaps explaining why it tends to generate lower returns for Japan than for peers. The extent to which research & development spending is falling due to pessimism, rather than in deference to shareholders, also bears watching.
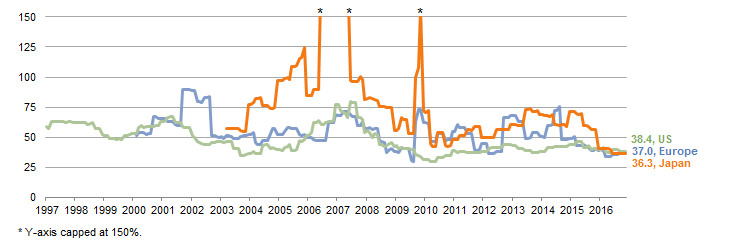
Figure 6. Capital Expenditures as a Percentage of Operating Cash Flow
April 30, 1997 – February 28, 2017 • Percent (%)
Sources: Bloomberg L.P. and MSCI Inc. MSCI data provided “as is” without any express or implied warranties.
Notes: Capital expenditures as a percentage of operating cash flow data for Europe and Japan begin May 31, 2000 and June 30, 2003, respectively.
Still, cash-rich Japanese corporate balance sheets are not entirely a bad thing. Relatively unlevered balance sheets, as well as the recent rebound in profitability, have afforded Japanese companies the flexibility to increase buybacks and dividends. These factors also help to explain why their return on equity numbers are lower than global peers. High cash levels offer more scope for returning capital and boosting return on equity, as well as more protection if rising interest rates push up debt servicing costs.
The Yen Is an Important Wildcard for EPS, But Don’t Overstate Importance
A stronger yen could impact the Japanese profit resurgence but its significance may be overstated. The surge in corporate profits that occurred from roughly the start of 2013 through early 2016 did coincide with a significant depreciation of the yen (Figure 7), and some of this earnings strength was surrendered after the yen rose against the dollar during the first half of 2016. However, this relationship has broken down during the past six months. Index profits have soared year-to-date despite the yen’s 5.5% appreciation against the US dollar. The 28% year-over-year growth in the first quarter for Topix companies was among the fastest seen in developed markets.
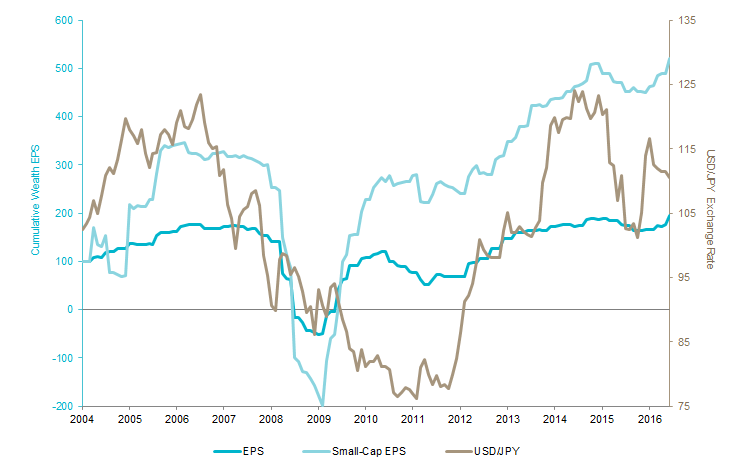
Figure 7. Japanese Earnings Per Share and USD/JPY Exchange Rate
December 31, 2004 – May 31, 2017 • EPS and Small-Cap EPS Rebased to 100 on December 31, 2004
Sources: MSCI Inc. and Thomson Reuters Datastream. MSCI data provided “as is” without any express or implied warranties.
Focusing on just the recent period and on index-level data also misses a few key dynamics. Historically, profits have been able to decouple from the currency—from 2009 to the middle of 2011 earnings soared while the yen appreciated. More recently, aggregate index profits fell, despite the fact that the average USD/JPY level was higher (reflecting yen weakness) in the fiscal year ending March 2016 than the year before. This is because the profit boost from the cheaper yen for large companies with significant USD revenue (e.g., Toyota, Nissan) was offset by huge losses at other companies (Mitsui, Mitsubishi Corp, etc.). Nippon Telegraph, a company with virtually no foreign revenue, posted one of the largest profit increases in fiscal year 2016 among Nikkei 225 members. Looking forward, Japanese companies are expected to see earnings grow around 13.2% during the current fiscal year (ending March 2018)—faster than US peers—despite only limited consensus expectations for further yen depreciation.
Looked at another way, small-cap earnings have displayed nearly the same trends as those of large caps (and in fact have seen a bigger resurgence) despite around 75% of their revenue coming from domestic sources. This also raises some questions over the dependence of profits on a weaker yen, and potentially speaks to the improvements in corporate governance.
If the currency is not the main driver of Japanese corporate profits, what is? Large index weightings for cyclical industries, like industrials and automotive stocks in the consumer discretionary bucket (Figure 8), suggest Japanese company profits are geared to global growth. Global growth has recently rebounded, led by a recovery in large emerging economies like China—a trend expected to continue through the remainder of 2017. Conditions in the United States are also expected to improve in 2017, possibly leading to further USD strength, but either way this market generates just 14.7% of Japanese corporate revenue. Summing up the link between currency and corporate earnings, a connection between a stronger yen and weaker profits exists for some companies,[3]Especially those that either don’t use currency hedges or that don’t have offsetting offshore costs like, for example, some of the auto manufacturers. but the cyclical nature of Japanese corporate revenues overall and the tendency of the yen to strengthen during periods of slowing global growth may mislead investors on the strength of the link.
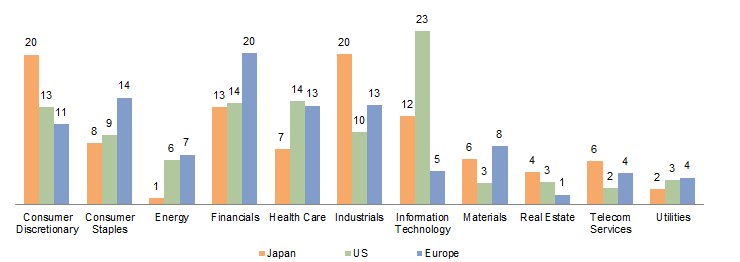
Figure 8. Sector Weights for Japanese Equities vs US and Europe
As of May 31, 2017 • Market Value Weight (%)
Sources: FactSet Research Systems and MSCI Inc. MSCI data provided “as is” without any express or implied warranties.
Note: Sector weights for Japan, Europe, and US are represented by the MSCI Japan Index, MSCI Europe Index, and MSCI US Index, respectively.
Concentrated Indexes and Availability of Alpha Support an Active Approach
Although we are not overly bullish on Japanese equities given an uncertain intermediate-term outlook, short-term prospects may be healthier and we don’t think investors should underweight the asset class. On a review of the portfolio, many investors will likely find that they are underweight Japanese equities relative to benchmarks. Over 80% of EAFE-benchmarked fund managers in our database are underweight Japan, and the average manager with exposure is underweight by 677 bps (Figure 9), perhaps a response to the asset’s long-term underperformance.[4]The average global equity manager is also underweight Japan, but not by as much.
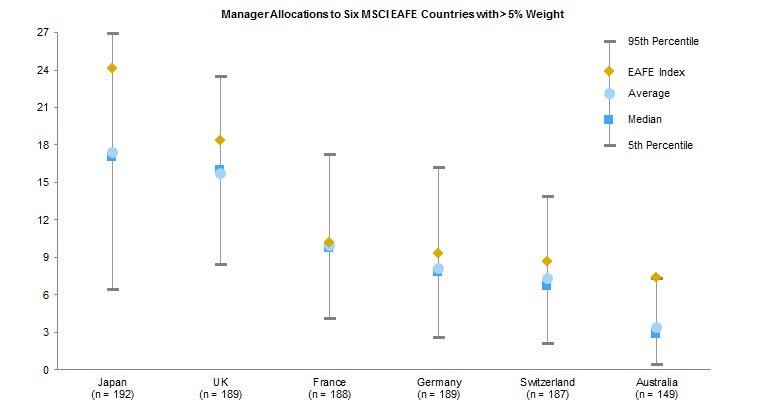
Figure 9. Global ex US Equity Managers’ Country Allocations vs the MSCI EAFE Index
As of December 31, 2016 • n = 193
Sources: Cambridge Associates LLC, MSCI Inc., and Thomson Reuters Datastream. MSCI data provided “as is” without any express or implied warranties.
Notes: Only includes data for 193 managers that provided geographic allocation as of year-end 2016. Index weights represent year-end geographic allocations of the MSCI EAFE Index. The n provided for each country represents the total number of products exposed to a given country as of year-end 2016, and percentile, median, and average figures are calculated only from products with exposure to the country shown. Cambridge Associates LLC’s (CA) manager universe statistics are derived from CA’s proprietary Investment Manager Database. Manager that do not report in US dollars, exclude cash reserves from reported total returns, or have less than $50 million in product assets are excluded.
Investors that want to increase exposure may want to pursue an active approach, either via a targeted Japan-only fund or via a global manager that has a more market weight exposure to Japan. Our data[5]Which, admittedly, is based on a relatively small sample size. indicate that dedicated Japan funds have a relatively better track record generating alpha versus peers in other developed markets. This could be because these managers possess strong stock-selection skills, or that lower long-term returns for Japanese equities have caused many investors (and sell-side firms) to lose interest, reducing market efficiency.
An active approach also might help navigate some of the concentrated exposures offered in the Japanese indexes. Around 20% of Nikkei 225 profits come from a relatively small number of motor vehicle and part manufacturers and, in any given year, just one company—Toyota—generates around 10% of index profits. For various reasons (cyclical forces like overcapacity, etc.), investors may not want to perpetually have a market-weight exposure to this sector, and active managers can help navigate risks and possible rewards. Progress in areas like corporate governance may not be equal across all companies, and skilled active managers may be able to identify improving firms and, in some instances, help push for those changes.
Investors may find fertile ground for alpha generation among Japanese small-cap stocks given reduced investor and sell-side coverage (Figure 10). However, at least from an index perspective, we are more neutral on small caps versus large caps than we were 18 months ago. Japanese small-cap stocks have outperformed large-cap peers by 900 bps since the start of 2016 and 500 bps per annum over the past three years. This has pushed up valuations: small caps trade at 1.2 times book value, around 5% above their historical average. Still, relative to international small-cap peers these valuations remain compelling (e.g., Europe ex UK small caps trade at 1.9 times book), and the earnings profile of Japanese small-cap equities may offer investors some upside if bears are proved wrong and domestic economic growth continues to surprise to the upside.
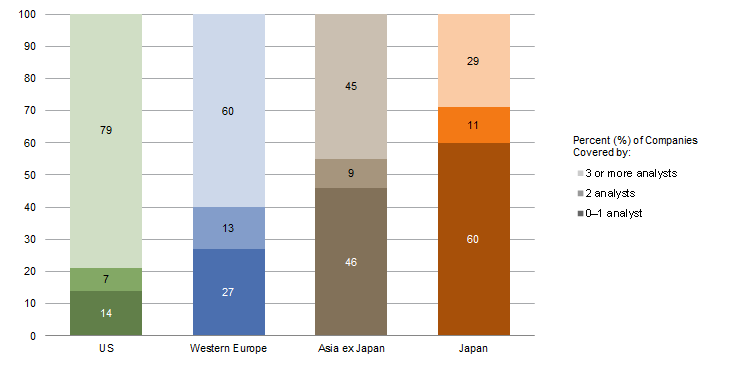
Figure 10. Analyst Coverage of Small-Cap Companies Within Various Regional Markets
As of June 30, 2016 • Percent (%)
Source: Matthews International Capital Management, LLC.
Conclusion
Strong recent returns of Japanese equities should not discourage investors from taking a closer look. Given both earnings growth and longer-term underperformance versus other developed equity markets, Japanese stocks look attractive on a relative and absolute basis. Though the yen may (or may not) prove a headwind for some companies, there are other potential drivers of returns, including improving governance and better capital allocation by corporate managers. In the near term, firmer economic growth both at home and abroad also means the yen should not derail expected attractive earnings growth.
Investors may be unintentionally underweight Japanese equities and, at a minimum, should look to market-weight the asset class. In doing so, investors should consider an active approach, as alpha generation has historically been higher in Japan than in some other markets, possibly the result of long-term lackluster returns and market inefficiency. Looking farther out, macro challenges should not be understated, and the combination of these and the potential for structural reforms to stall for a variety of reasons leave us neutral on the asset class.
Wade O’Brien, Managing Director
Brandon Smith, Investment Associate
Footnotes