Asset-backed securities enjoy favorable fundamentals and are positioned to outperform high-yield bonds and leveraged loans in 2017
- The strong returns of 2016 are unlikely to be repeated, but many structured credit strategies remain attractive on a relative basis given reasonable yields, positive trends in key metrics like net operating income, and reduced supply.
- Given the complexity and diversity of these strategies, interested investors should be selective—valuations are stretched in parts of the market and some sectors face regulatory headwinds.
- Investors have many strategy, exposure, and vehicle options in this space; we favor funds with the credit selection skills to choose the most attractively priced lower-rated tranches of existing deals and originate their own loans.
The low rate environment of recent years has pushed many investors into higher beta credit instruments to meet their goals for risk-adjusted returns. However, the resulting spread compression on many types of assets, including high-yield bonds and leveraged loans, will constrain their return potential going forward. Private credit strategies, such as direct lending and mezzanine debt, are one option—these offer the potential for higher returns, but may not be suitable for all investors given vehicle or liquidity constraints. For investors requiring greater liquidity, structured credit may be one of the last remaining attractive opportunities at this stage of the credit cycle. Spreads have recovered somewhat from a significant sell-off in early 2016, but remain elevated in some products. In this research note, we lay out the rationale for investing in structured credit and provide some thoughts on implementation, focusing mainly on assets that do not carry government guarantees.
The ABCs of ABS—There Are Many “Betas”
Investors have a variety of options when investing in structured credit (also referred to as asset-backed securities, or ABS). Vehicle options include open-ended mutual funds, closed-end or private equity–style funds, and hedge funds. Instruments include those backed by property loans—e.g., residential mortgage–backed securities (RMBS) and commercial mortgage backed–securities (CMBS)—by collateralized loan obligations (CLOs), or by a variety of other consumer exposures such as auto and student loans. Investment mandates can focus on one individual asset class or take a multi-asset approach that rotates across segments as relative value changes.
Looking across these opportunities, a fund’s appetite for risk and volatility are distinguishing characteristics. Some funds target highly rated instruments (e.g., AAA-rated bonds backed by government agency–guaranteed mortgages or higher-rated bonds backed by auto loans), seeking to outperform similarly rated corporate bonds. At the other end of the risk (and often liquidity) spectrum, hedge funds may use leverage and invest in lower-rated ABS, as well as use ABS indexes to express relative value trades.
Aside from their return potential, one of the benefits of investing in structured credit is the diversification these strategies can bring to portfolios. Exposure to assets like real estate credit and student loans complements the typical corporate credit and equity risk in most portfolios, as well as other real asset exposure like real estate equity. In the unexpected event that US growth disappoints in 2017, assets such as RMBS are likely to fare better than high-yield bonds or leveraged loans. Many ABS instruments are also issued in floating-rate format (offering a spread over a floating benchmark like Libor), helping (like leveraged loans) to cushion fixed income portfolios against the perils of rising rates. The 40 basis point (bp) rise in three-month US dollar Libor (to 1%) over the course of 2016 may have only provided a small boost to returns, but the asset class is better positioned than most peers for a more aggressive inflationary environment or more hawkish Federal Reserve.
Assessing actual returns delivered relative to return potential is challenging for some types of ABS. Numerous indexes exist for government agency–guaranteed MBS, but are fewer and farther between for other types of structured credit like CMBS and non-Agency RMBS. This is due to the variety of collateral types, structural complexity, and inconsistent issuance patterns across some markets. For example, non-Agency RMBS can be broken down into a host of smaller categories like Alt-A, Prime, Option ARM, etc.; issuance in most of these categories has plunged since the financial crisis. The returns achieved by structured credit hedge funds present a useful proxy, as they speak to the opportunity set and encompass a variety of styles and substrategies. These funds have posted impressive three- and five-year returns of 5.2% and 8.2%, respectively, outpacing most other hedge fund categories as well as non-hedged credit assets like high-yield bonds and leveraged loans (Figure 1).
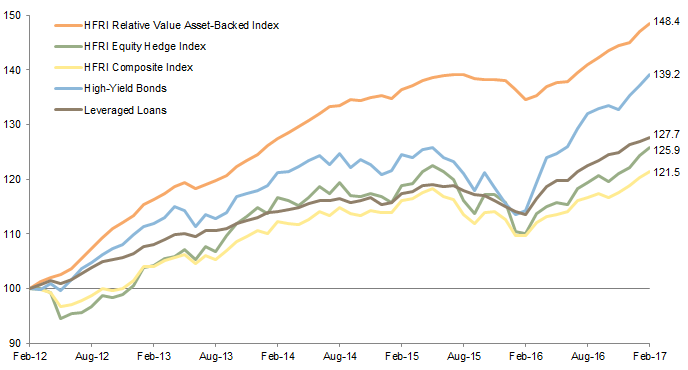
Figure 1. Cumulative Wealth of Credit Indexes
February 29, 2012 – February 28, 2017 • Rebased to 100 on February 29, 2012 • US Dollars
Sources: Barclays, Bloomberg L.P., Credit Suisse, and Hedge Fund Research, Inc.
Note: High-yield bonds and leveraged loans represented by the Bloomberg Barclays US Corporate High Yield Index and Credit Suisse Leveraged Loan Index, respectively.
2016: A Rocky Start Transforms Into a Fierce Recovery
For more on this, please see the August 2016 edition of Quarterly Regulatory Update.
Many structured credit funds had a successful 2016, despite suffering some indigestion along the way. Risk assets faced a rocky start to the year and structured credit was no exception. Concerns over rising corporate defaults (especially in commodity sectors) impacted high-yield bonds and leveraged loans, in turn weighing on CLOs. Commercial real estate (CRE)–backed debt also suffered, in part due to broader fears over growth and rising rates, but also due to concerns over soft fundamentals for malls. The “risk retention” rules called for under Dodd-Frank were a unique negative technical for structured credit early in 2016, despite the fact that market participants had years to adjust for this event. These rules, which came into effect at the end of 2016, require originators of structured credit transactions to retain 5% of the risk on any transaction (either by taking the so-called first-loss piece or a 5% “vertical” slice of each tier of the securitization). Suspicion that some managers lacked the capital to fund such slices and that banks would seek to avoid the unfavorable capital treatment of these tranches sparked fears that increased issuance to beat the December deadline would push spreads wider on all but the lowest rated tranches of new and existing securitizations. Finally, and as if this was not enough, some holders of higher-beta credit were forced to reduce risk in first quarter 2016, further pressuring spreads.
As worries over corporate and real estate fundamentals faded and technicals improved, many of these assets staged a fierce recovery during the second half of 2016. Selling pressure from banks eased, existing funds rotated into cheaper tranches, and several fund managers rushed to incept new vehicles to capitalize on the dislocation.[1]The structure of these funds varied; some of the funds that targeted CLO equity and subordinated debt were raised via lock-up vehicles where investors are restricted from redeeming capital for one or … Continue reading Of course, not all fund managers placed their bets correctly or, said another way, were as aggressive as they could have been. Some multi-asset ABS hedge funds played it safe in lower beta markets like non-Agency RMBS, while others chose the wrong hedging strategy. Still, the spoils for the winners were significant. Using one example to highlight how much higher-beta credit rallied, B-rated CLO tranches returned 23.6% in 2016, including 11.5% during just the last three months of the year.
Spreads Still Attractive
Yields have compressed over the course of 2016 and into 2017, yet remain attractive on an absolute and relative basis. For example, at the end of February BB- and BBB-rated tranches of CLOs yielded around 8.3% and 5.9%, respectively, around 450 bps and 225 bps tighter than one year ago but well above levels on similarly rated loans (Figure 2). Meanwhile, some CMBS spreads actually remain wider than one year ago and are also relatively attractive. CMBS tranches with mid-BBB ratings now yield around 4.5%, above the 3.7% yield on much longer-dated corporate bonds with similar ratings. Wider spreads may be the residual effect from last year’s volatility and lingering uncertainty over risk retention, though in the case of CMBS, may also reflect growing concern about stretched valuations for commercial real estate and specific concerns over malls and the retail sector.
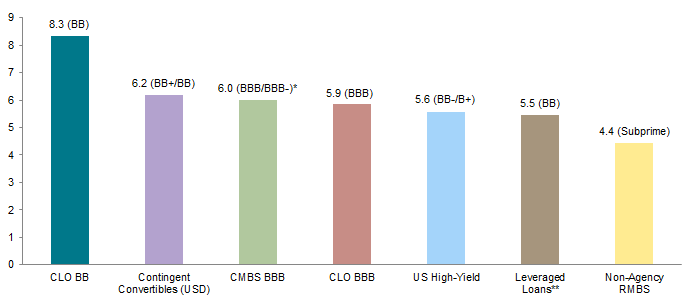
Figure 2. Yields and Ratings for Various Fixed Income Asset Classes
As of February 28, 2017 • Yield-to-Worst (%)
Sources: Barclays, Bloomberg L.P., Credit Suisse, J.P. Morgan Securities, Inc., and Thomson Reuters Datastream.
Notes: “CLO BB” represented by J.P. Morgan CLOIE BB Index, “Contingent Convertibles (USD)” by the Bloomberg Barclays Global Contingent Capital Index, “CMBS BBB” by the Bloomberg Barclays Investment Grade CMBS BBB Index, “CLO BBB” by the J.P. Morgan CLOIE BBB Index, “US High-Yield” by the Bloomberg Barclays US Corporate High-Yield Index, “Leveraged Loans” by the Credit Suisse Leveraged Loan Index, and “Non-Agency RMBS” by the J.P. Morgan Non-Agency RMBS Subprime Index.
* The Bloomberg Barclays Investment Grade CMBS BBB Index skews towards higher-yielding BBB- securities (72% of constituents as of February 28, 2017).
** Yields for leveraged loans are represented by three-month Libor plus the three-year discount margin.
Higher-rated structured credit transactions have been less volatile but have generated more subdued returns for investors. Still, yields on higher-rated tranches, while below the lofty levels of their sub-investment-grade peers, tend to be elevated relative to those on comparable corporate debt despite similar (or lower) risk profiles. For example, the 130 bp spread on AAA-rated CLO tranches at the end of February was well above the comparable yield of AAA-rated corporate bonds and only slightly tighter than one year ago, despite the fact that default rates for CLOs have historically been lower than those on corporate bonds.
Positive Fundamentals Will Compete with Stretched Valuations in 2017
The healthy gains many funds enjoyed last year beg the question of whether the opportunity set remains the same or if the landscape is shifting. The opportunity is smaller now than it was nine months ago and future returns will likely be lower, but structured credit remains attractive on a relative basis. With the exception of bank capital securities issued by European banks (which also look reasonably valued), it is increasingly hard to find high single-digit yields in credit outside of the ABS market (Figure 3).
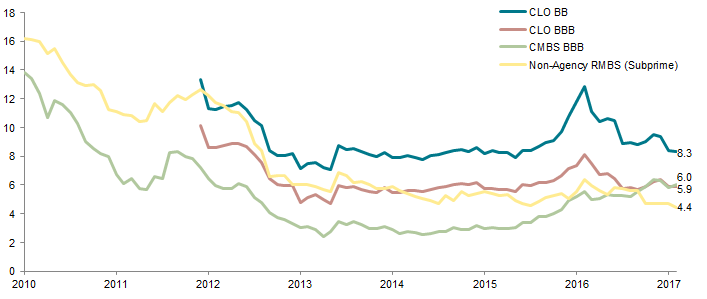
Figure 3. Yields for Various Asset-Backed Securities
January 31, 2010 – February 28, 2017 • Yield-to-Worst (%)
Sources: Barclays, Bloomberg L.P., and J.P. Morgan Securities, Inc.
Notes: “CLO BB” represented by J.P. Morgan CLOIE BB Index, “CLO BBB” by the J.P. Morgan CLOIE BBB Index, “CMBS BBB” by the Bloomberg Barclays Investment Grade CMBS BBB Index, and “Non-Agency RMBS (Subprime)” by the J.P. Morgan Non-Agency RMBS Subprime Index. Monthly data for CLO BB and CLO BBB begin December 31, 2011.
Improving fundamentals enhance the attractiveness of structured credit. Stronger economic growth and rising commodity prices have helped corporate earnings to recover, and overall default rates have dropped as weaker energy and mining credits have already defaulted. This boosts the credit quality of leveraged loans and, in turn, CLOs. Similarly, positive trends in net operating income and occupancy rates provide a boost to CMBS fundamentals (Figure 4). Technicals across all types of structured credit are favorable from an issuance perspective; fears over a deluge of risk retention–related issuance have ebbed and net supply of CLOs and CMBS may again decline (Figure 5).
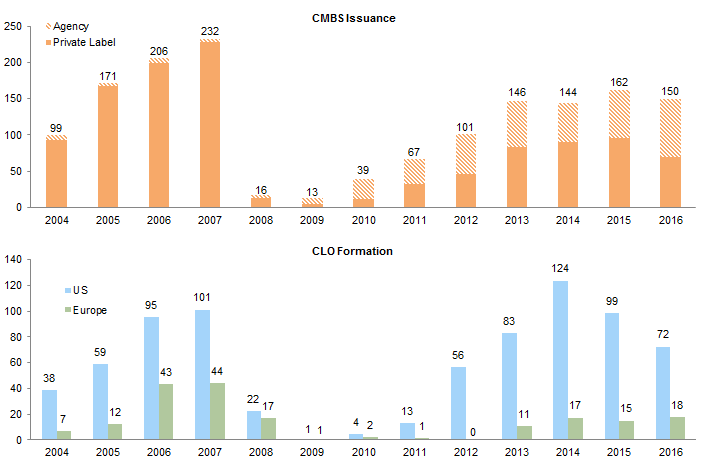
Figure 4. CMBS Issuance and CLO Formation
2004–16 • USD Billions
Sources: J.P. Morgan Securities, Inc., Thomson Reuters, and Wells Fargo.
Note: CMBS issuance represents US domestic data.
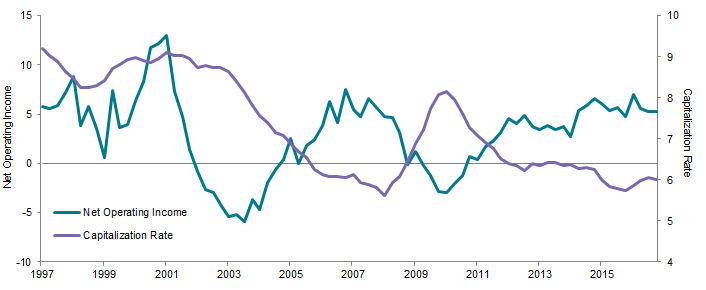
Figure 5. Net Operating Income Growth and Capitalization Rates
First Quarter 1997 – Fourth Quarter 2016 • Four-Quarter Moving Average (%)
Source: National Council of Real Estate Investment Fiduciaries.
Offsetting these positives are several worries. Valuations look stretched for some parts of the CRE market as capitalization rates are nearing historical lows. Rising interest rates may reduce affordability and sectors like retail continue to suffer from dislocation. Regulatory changes may also reduce profits and thus generate headwinds for CRE sectors like health care. Favorable new issue conditions in the leveraged loan market (over $100 billion of leveraged loans were refinanced in January alone) mean that many loans are being refinanced at lower spreads. This may challenge the economics of certain tranches of CLO debt, though managers can typically refinance outstanding notes at lower spreads after the call date. Finally, maturities are sizable in the CRE market later in 2017, raising the risk of a technically driven dislocation. Around $370 billion of CRE debt matures this year, of which approximately $140 billion is CMBS.
Thoughts on Implementation
Investors interested in structured credit have several options (Figure 6). One is choice of investment vehicle, which in turn may be driven by targets for returns and volatility. Long-only funds typically focus on higher-quality and liquid ABS instruments like RMBS and consumer debt, though there are mutual funds (often unconstrained or “core plus” type multi-asset bond funds) that will invest small amounts of their assets in higher-yielding niches like non-Agency RMBS and CLOs. At the other end of the liquidity spectrum are closed-end funds, which are raised opportunistically to invest in attractively priced niches, such as was the case with lower-rated CLO debt early in 2016. ABS hedge funds may offer the most attractive combination of both liquidity and opportunity to generate alpha via credit selection, especially during periods of spread dispersion when they can go long and short. Within the hedge fund category are a number of options, including funds that focus on a particular asset (RMBS, CMBS, CLO, etc.), multi-asset ABS funds, and absolute return hedge funds that might scale up their ABS exposure when pricing looks attractive.
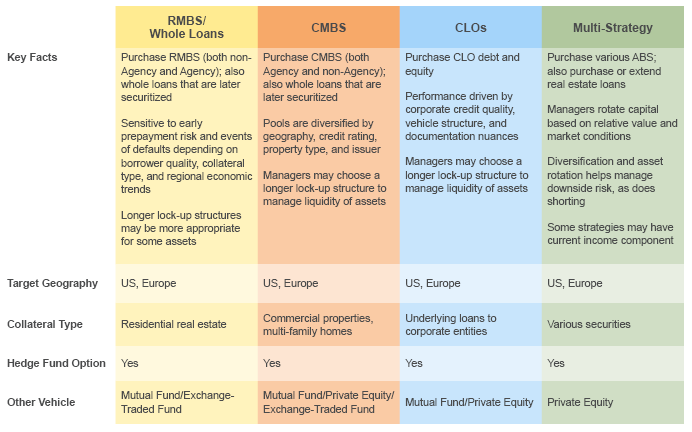
Figure 6. Characteristics of Structured Credit Strategies
Source: Cambridge Associates, LLC.
Note: Many funds offer unique structures and exposures; this table is not an exhaustive listing of available strategies or the assets they invest in.
Investors looking for more liquidity via a hedge fund structure may see their returns trail those of closed-end real estate debt funds where the manager can add value through directly originating and servicing loans, as well as choosing (in some cases) the type and amount of leverage to employ. The flipside is that they will enjoy better liquidity than longer lock-up structures, and be better positioned should market volatility increase again in 2017. One interesting option is hybrid funds (both long-only and hedged) that originate loans and create new CUSIPs, as well as invest in existing bonds and CDS indexes (CMBX, etc.). Some of these funds require tying up capital for longer than is typical in a hedge fund, but, at the same time, for far less time than a closed-end private equity vehicle. Given the investment required in IT and staffing to track all of the underlying assets and structures, barriers to entry are high and we would focus on seasoned firms that specialize in the product in which they are investing.
Conclusion
We are constructive on structured credit, especially with respect to similarly rated corporate bonds. Investors need to be realistic about return expectations given spreads have compressed and mid-single-digit yields on some higher-rated instruments are unlikely to generate equity-like returns. One of the best options in the space may be hybrid funds that allow managers room to demonstrate skill by choosing among existing bonds (and indexes), originating new loans, and choosing among a variety of leverage options including warehouse lines and securitization. Should fundamentals deteriorate or markets again suffer technical-driven volatility, hedge funds that are skilled at shorting may also reap generous rewards. Given the opacity and limited liquidity in some parts of the market, investors should select managers carefully and understand that these risks are elevated relative to certain other parts of the credit universe.
Index of Acronyms
ABS: Asset-backed securities
CDO: Collateralized debt obligations
CLO: Collateralized loan obligations
CMBS: Commercial mortgage–backed securities
CRE: Commercial real estate
MBS: Mortgage-backed securities
RMBS: Residential mortgage–backed securities
Wade O’Brien, Managing Director
Brandon Smith, Investment Associate
Footnotes