If trends in 2015 continue to year end, global value style equity benchmarks will experience another year of underperformance.[1]Value benchmarks are typically designed to represent a strategy of buying low price multiple stocks. Managers, however, can define “value” in different ways, and a manager’s correlation to … Continue reading Is the value premium “over”? We don’t think so. Over shorter time frames, the value premium tends to be erratic, if not elusive, and cyclical markets that favor growth over value are not uncommon. However, value’s outperformance has been much more consistent over longer time frames. Value could have further to fall in this cycle, but for long-term investors, the key question has been when, not if, the style has worked. Patience has paid off. And investors would do well to remember that times of turmoil and underperformance that test investors’ faith can eventually reset the deck for attractive future outcomes.
The Value Premium
The observation that cheaper stocks have outperformed their more expensive counterparts is well documented. Benjamin Graham widely extolled the benefits of a focus on buying cheap stocks beginning more than 70 years ago. Attention to value investing, as this strategy has become known, has grown since several seminal academic studies were published on the topic in the 1990s. Countless academic studies and practitioner white papers have focused on strategies for investing in statistically cheap stocks around the globe.[2]Eugene Fama and Kenneth French have published some of the most influential work about the value premium, including, for example, “The Cross-Section of Expected Stock Returns,” The Journal of … Continue reading
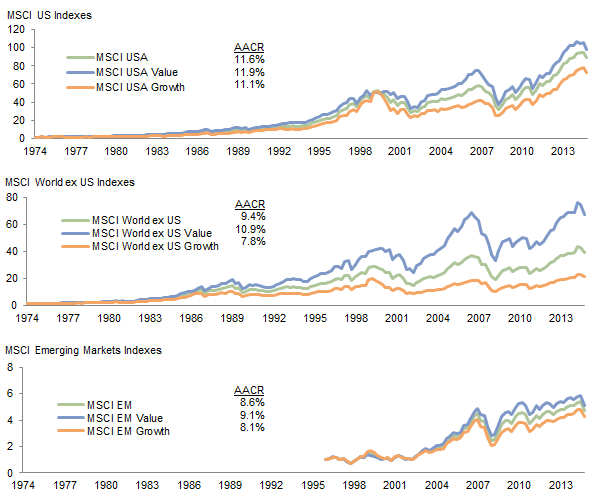
Cumulative Wealth for Select Global Equity Market Indexes
First Quarter 1975 – Third Quarter 2015 • Local Currency • Fourth Quarter 1974 = $1
Sources: MSCI Inc. and Thomson Reuters Datastream. MSCI data provided “as is” without any express or implied warranties.
Notes: Total returns are gross of dividend taxes. Data for MSCI Emerging Markets indexes rebased to $1 as of fourth quarter 1996.
Eugene Fama and Kenneth French, professors at the University of Chicago’s Booth School and Dartmouth College’s Tuck School of Business, respectively, have published some of the most influential work on value investing, and they continue to maintain data on US stocks dating back to July 1926. The Fama/French US Value Index is formed using those stocks in the highest 30% of all NYSE, AMEX, and Nasdaq stocks (for which there is sufficient monthly data available) ranked based on book equity to market equity—in other words, the lowest three deciles of the US equity market based on price-to-book equity. The Fama/French US Growth Index represents the three most expensive deciles relative to book value. The Fama/French US Value Index has generated average annual outperformance of 2.8% over the S&P 500 Index, and 3.3% annually versus the Fama/French US Growth Index from July 1926 to September 2015.[3]Ken French offers free, high-quality data on his website: http://mba.tuck.dartmouth.edu/pages/faculty/ken.french/data_library.html. Using data from MSCI’s style indexes, similar long-term results can be seen in markets outside the United States over the past 20 and 40 years, though MSCI’s indexes have a more muted value style tilt than Fama/French—a relative value versus deep value contrast—and, consequently, a lower long-term performance advantage.[4]MSCI value style indexes are designed to represent 50% of the market capitalization of their parent index, which is a 20% larger segment of the target market than Fama/French and, as a result, … Continue reading
Why does value investing earn a return premium? Two schools of thought generally hold sway. Efficient market supporters propose a risk-based theory noting that cheaper, “value” stocks are often associated with companies, industries, or geographies facing decline, distress, or some form of uncertainty. Thus, the return premium is compensation for accepting the risk that value stocks may be cheap for good reason, and therefore vulnerable to losses. In general, value indexes do have a higher exposure to areas of the market with fundamental question marks, more cyclical earnings, higher balance sheet leverage, or high economic sensitivity, where it can be harder to forecast future earnings. For example, investors in value indexes are overweight financials and energy and underweight the technology and consumer sectors, relative to broad market indexes.
Others see human behavioral flaws as the key driver of the value premium. For example, many characterize the market as a popularity contest, particularly in the short term, with investors inappropriately extrapolating current fundamental trends—both good and bad—into the future.[5]Benjamin Graham famously characterized the market as acting like a weighing machine in the long term but behaving like a voting machine in the short term. For early academic work on this topic see … Continue reading Unpopular (value) stocks are priced for the worst case, whereas popular (growth) stocks are priced for the best case. Since long-term reality is often somewhere in between, the theory follows that unpopular stocks generate better-than-expected returns when their fundamentals turn out to be better than expected, with the reverse occurring for popular stocks. Value strategies do indeed tend to have a contrarian bias, with a greater focus on stocks with recent bad news or lukewarm investor expectations.
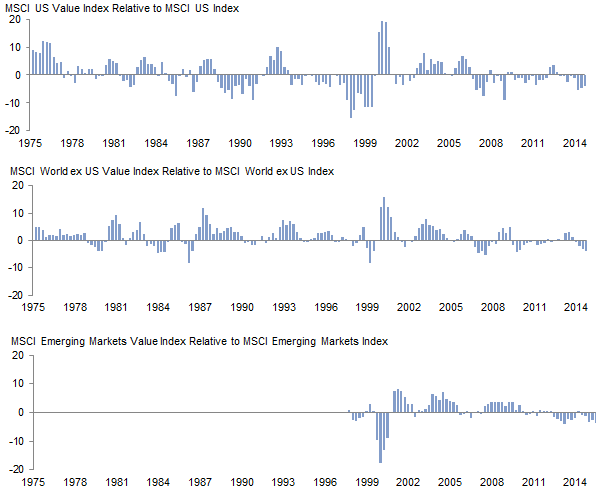
Trailing 12-Month Relative Returns for Select Global Equity Market Indexes
First Quarter 1975 – Third Quarter 2015 • Local Currency • Percentage Points
Sources: MSCI Inc. and Thomson Reuters Datastream. MSCI data provided “as is” without any express or implied warranties.
Notes: Total returns are gross of dividend taxes. Data for MSCI Emerging Markets indexes begin in first quarter 1997.
Alas, there is a catch. Underneath the long-term outperformance lurks a sometimes overlooked detail: while value strategies have outperformed over time, they don’t outperform all the time. Quite the contrary, value performance is episodic, with long, and sometimes severe, bouts of underperformance that test even the most disciplined investor’s fortitude. Going back to the Fama and French data, since 1926, the Fama/French US Value Index has outperformed the S&P 500 Index in 58% of rolling 12-month periods but 88% and 95% of rolling ten- and 15-year periods, respectively. MSCI data, which allow a more global picture, show a similar trend. Some value investors characterize short-term underperformance as the price paid by investors seeking to earn this long-term return premium.
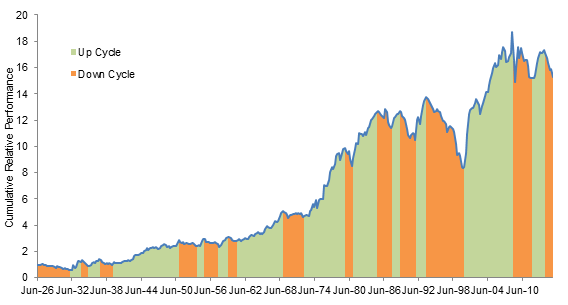
Historical US Value Premium Cycles: Fama/French US Value Index Relative to S&P 500 Index
Third Quarter 1926 – Third Quarter 2015 • US Dollar • Second Quarter 1926 = $1
Sources: Standard and Poor’s and Kenneth R. French Data Library.
Notes: Upward cycles in favor of value are assumed to begin when the representative Fama/French index stops making new relative performance lows on a rolling 12-month basis; downward cycles for value are assumed to begin when the representative Fama/French index stops making new relative performance highs. Directional deviations lasting less than four quarters were not considered to indicate a material change in a long-term trend.
Similar cyclical patterns are experienced in other long-term successful strategies like momentum investing, which we discussed last year in a paper where we suggest pairing momentum with value. While both strategies tend to exhibit strong long-term returns, both have also experienced periodic drawdowns, though, importantly, the drawdowns have historically occurred at different times. See Sean McLaughlin et al., “Momentum: Replacing Growth Indexes as a Healthy Menu Option,” Cambridge Associates Research Note, October 2014.
Just how often has value underperformed? The chart above illustrates the relative wealth accumulated by investing in low price-to-book stocks in the United States versus an investment in the S&P 500 Index since 1926. Periods with sustained drawdowns are highlighted in orange. There are 13 of them.[6]Estimating long-term market cycles can be an imperfect exercise since short-term directional shifts are typical within long-term tends. Our assessment of long-term trends was driven by a blend of … Continue reading For one painful illustration, consider that investors that jumped into value investing with both feet after the seminal Fama and French work was published in 1992 were promptly cut off at the knees, with six and a half years of underperformance from September 1993 to March 2000 to the tune of over 7% annually, and subsequently were not made whole until the middle of 2002!
Historically, long-term investors that stayed the course through value investing’s relative drawdowns have been repaid for their patience. Nonetheless, in the midst of a drawdown, not knowing how long the dark period will last or how severe the underperformance may be can test investors’ patience. With every period of underperformance, many investors don’t hold on to see the sunlight on the other side of the ditch. Over the last nine decades, by our estimate, periods with positive relative performance in the United States have lasted just over four years, on average, whereas periods of underperformance have averaged three years, with an average cumulative underperformance of 18.4% versus the S&P 500 Index. Some downturns are quite short, but the longest occurred over the six and a half years ended March 31, 2000, a significantly longer period than the current six-quarter trend of underperformance. While there is less data available, cycles observed in developed markets equities outside the United States over the four-decade period ended December 2014 have generally been shorter in duration, with up cycles averaging just over three years and down periods averaging just over five quarters, roughly the same as the current six-quarter down cycle. The cumulative underperformance in down cycles has averaged 7.4%.[7]Based on the performance of the Fama/French International Value Index relative to the MSCI World ex US Index. One possible explanation for this shorter average cycle may be the increased geographic diversity in global ex US indexes, with multiple-country equity markets influencing the aggregate outcome relative to a single country (United States) outcome.
Value’s Headwinds: Fear and Enthusiasm
While capital markets are never that predictable, environments characterized by either rising fear or elevated enthusiasm generally pose headwinds for value strategies. With rising fear—a “risk-off” market in more recent industry parlance—discount rates rise and prices fall, and this trend can be more painful for stocks, industries, or geographies perceived as the most uncertain or most susceptible to macroeconomic trends. Examples fresh in the minds of many investors might include the 2008 global financial crisis and the mid-2011 correction from the European debt crisis. During these times of market stress, value investors suffer more due to their larger proportion of holdings with economic sensitivity or fundamental uncertainty. As fear subsides and investor expectations normalize, value tends to recover lost performance and gain incremental ground.
On the other end of the cycle, value strategies often begin to fall behind at the tail-end of bull markets, where enthusiasm tends to favor narrow segments of popular growth stocks. The Nifty 50 and late 1990s technology and telecom bubble eras are prime examples where large-cap growth stocks garnered all the attention, to the detriment of “boring” value stocks. The same can be said for recent investor excitement over social media/technology and biotechnology stocks, which are not included in value indexes. Investors may be tempted to try to time the value cycle, but given inevitable exceptions to the storyline there is danger in over-specifying when these cycles occur and for how long. In part, the unpredictable and cyclical nature of the value investment style is the risk borne by the allocator of capital to value strategies and a reality that makes pursuit of the value premium challenging, particularly for shorter-term investors.
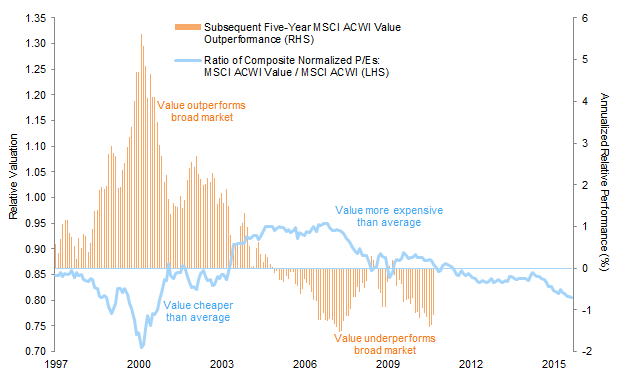
Relative Valuation and Subsequent Relative Performance for the MSCI All Country World Value Index
January 31, 1997 – September 30, 2015 • Local Currency
Sources: MSCI Inc. and Thomson Reuters Datastream. MSCI data provided “as is” without any express or implied warranties.
Note: The composite normalized price-earnings (P/E) ratio is calculated by dividing the inflation-adjusted index price by the simple average of three normalized earnings metrics: ten-year average real earnings (i.e., Shiller earnings), trend-line earnings, and return on equity (ROE)–adjusted earnings.
Can the Value Premium Endure?
With the rise in popularity of value investing, some commentators are positing (not for the first time) that value’s current cyclical underperformance is a harbinger of a bigger disturbance to the style. Is the value premium being arbitraged away?
While the value premium may be lower in the future, we don’t believe it will fully disappear. The historical data clearly show that long dry spells have occurred within value investing both before and after more attention was brought to the style in the last two decades. More importantly, despite the knowledge of its existence, the implementation challenges are the key pillars of support for the endurance of the value premium. Not all investors can pursue value strategies. Some don’t even try. Others try for a time, but abandon it with the pain of short-term underperformance. These behaviors provide a natural barrier to capital and limit to arbitrage. The performance of value strategies over the last decade already has some investors seeking the next best thing, as seen in the recent attention to quality and low volatility strategies often pitched as the antidote to temper value’s inherent volatility.
This natural ebb and flow of investor demand for value stocks results in a resetting of return potential after tough times as questions about the style’s efficacy increase, popularity wanes, and entry point valuations improve. It is logical that low price multiple stocks have delivered market-beating results when their relative valuations are below average but not when their relative valuations are high. The relative valuation of global value was high leading into the recent performance headwinds and performance has been poor. This is not a new phenomenon. This is the normal cycle of capital markets—always has been, always will be.
The Bottom Line
Value strategies are on the negative side of the relative performance ledger today, but the current experience is well within the range of historical outcomes. As with past cycles, the recent downturn may serve to reset the deck for future success. Investors should remember the benefits that have occurred from sticking with the style during past challenging periods. How long will value’s underperformance last? No one can say, but the valuation picture for value equity, which had been neutral relative to growth for some time, has improved slightly with recent market volatility. At this point investors would be well served to stay the course and watch closely, as the time to rebalance further into value may be on the horizon.
Kevin Ely, Managing Director
Michael Kellett, Senior Investment Associate
David Kautter, Senior Investment Associate
Footnotes