US REIT valuations are elevated, but the fundamental and technical picture does not support the underweights that many investors likely, though unintentionally, have
- Today, REITs are included in the financial sector of equity indexes and are often underweighted by active equity managers. In August, when REITs move out of financials and become their own sector, investors’ underweights to this sector will become more apparent.
- The commercial real estate market has marched upward since 2009, lengthy for any cycle, and it contains areas of weakness, such as suburban offices. But low levels of new supply, positive trends in vacancy rates, and wide spreads between capitalization rates and the ten-year Treasury yield suggest that prices are neither excessive nor poised for an imminent down cycle.
- Though valuations are elevated, in today’s environment where US equities and bonds are also expensive, REITs look more compelling on a relative basis. We are neutral on the sector and encourage investors to evaluate their exposure and determine whether an underweight is really warranted.
US real estate investment trusts (REITs) have delivered standout performance in recent years. With a little under $1 trillion in market capitalization across close to 200 listed names, REITs now represent about 4% of the US stock market, a level higher than the utilities, materials, and telecom sectors. Despite the industry’s size and breadth, many investors, perhaps unintentionally, hold significant underweight positions. According to one estimate, actively managed mutual funds are underweight the sector by around $100 billion.
In August, the visibility of any underweight REIT positions will increase, as MSCI and S&P Dow Jones indexes add a new headline real estate sector in the Global Industry Classification Standard (GICS). The sector addition—the framework’s first since its development in 1999—moves real estate companies out of the financials sector, where REITs previously mixed with banks, insurance companies, and diversified financials. Although the upcoming GICS change may prompt some benchmark-sensitive managers to adjust positions to more closely match the market weight, many portfolios may remain under allocated.
While investors need to consider portfolio objectives and any private real estate holdings in making an allocation decision, REIT fundamentals and valuations do not justify a sizeable underweight. Instead, investors are likely to benefit from an equal-weight position, particularly considering that recent tax changes in addition to the GICS reshuffling may result in new institutional demand. This research note reviews these issues and concludes that although there is reason for caution, REITs deserve to be more than an afterthought.
Performance
Since the end of the global financial crisis, the FTSE/NAREIT All Equity REIT Index, a leading US REITs benchmark, has consistently been among the top-performing marketable asset classes (Figure 1), helping it more than quadruple in market capitalization. The blistering pace set by US REITs during this period reflects a number of factors, including the economy’s steady growth, the Federal Reserve’s extensive monetary policy support, and a gradual strengthening in fundamentals across property types. The unique characteristics of the REIT structure have also been a boon to the industry.

Figure 1. US REIT Performance Relative to Other Asset Classes
2006–16 • US Dollar
Sources: Barclays, Bloomberg L.P., Frank Russell Company, FTSE International Limited, MSCI Inc., National Association of Real Estate Investment Trusts, and Thomson Reuters Datastream. MSCI data provided “as is” without any express or implied warranties.
Notes: “US Large-Cap” represents the performance of the Russell 1000® Index. “US Small-Cap” represents the performance of the Russell 2000® Index. “Non-US Dev Mkts” represents the performance of the MSCI Europe, Australasia, and Far East (EAFE) Index. “Emerging Mkts” represents the performance of the MSCI Emerging Markets Index. “US Bonds” represents the performance of the Barclays Aggregate Bond Index. “US REITs” represents the performance of the FTSE® NAREIT All Equity REITs Index. “Commodities” represents the performance of the Bloomberg Commodity Total Return Index. Total returns for the MSCI Emerging Markets Index are gross of dividend taxes. Total returns for MSCI developed markets indexes are net of dividend taxes. 2016 data are as of May 31.
Among the four major property types, the apartment and retail subsectors have delivered higher annual returns to investors in recent years than the industrial and office subsectors (Figure 2). Although each has benefited from the improved employment picture and the low levels of new commercial real estate construction—a point elaborated on later—demand in the apartment subsector has risen as the national homeownership rate has dropped, from 69.2% in 2004 to an estimated 63.5% today. The retail subsector has shown resilience in the face of the ecommerce boom, helped by strong demand for the limited space available for lease.
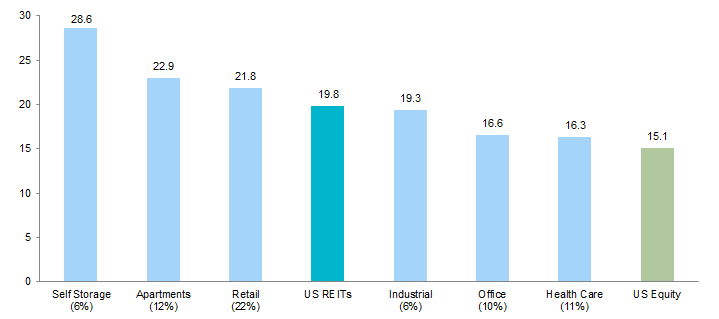
Figure 2. US REIT Sector and Subsector Performance Since the Global Financial Crisis
June 30, 2009 – May 31, 2016 • US Dollar • Average Annual Compound Returns (%)
Sources: Frank Russell Company, FTSE International Limitied, National Association of Real Estate Investment Trusts, and Thomson Reuters Datastream.
Notes: Data are monthly. “US Equity” represents the performance of the Russell 3000® Index. Percentages in parenthesis represent the sector or subsector weight in the FTSE® NAREIT All Equity REITs Index. “Retail” is a sector that includes the subsectors shopping centers, regional malls, and free standing. Subsectors not shown in the figure include data centers, diversified, infrastructure REITs, lodging/resorts, manufactured homes, single family homes, specialty, and timber REITs.
The industrial and office subsectors still posted solid returns, despite the relative underperformance. The lower returns in the industrial space are partly due to its generic nature, which has typically demanded a smaller premium, but demand has increased in recent years from online retailers looking to warehouse goods. The office sector has seen its vacancy rate decline the least among major property types, as employers have increasingly sought to shrink the average square footage per employee in recent years rather than lease additional space.
Beyond major property types, self-storage REITs have been the clear toasts of the town, returning an eye-popping 28.6% annualized return since the end of the global financial crisis. As facilities offering month-to-month access to a personal storage unit, the sector has grown dramatically. National companies have worked to consolidate the extremely fragmented mom-and-pop market, and with more professional management teams, the self-storage sector’s growth in same store net operating income—a key industry operating metric—has regularly been among the highest.
Across the various property types, the REIT sector’s growth was also fueled by investors increasingly recognizing the merits of the REIT structure—as a corporate entity that owns income-producing assets, a REIT pays no taxes at the company level and distributes at least 90% of its taxable income to shareholders annually. As a result, the return profile for REITs exhibits characteristics of equities and bonds, with both sensitivity to the economic cycle and a high level of steady income.
Despite its bond-like income, the volatility of the sector’s returns is firmly in the equity camp. Sensitive to the economic cycle, the REIT sector’s drawdown during the global financial crisis was nothing short of terrifying, returning -73.2% relative to the S&P 500’s -55.3%, as many questioned the solvency of real estate companies. While the sector continues to have a high beta today, meaning its volatility relative to the market is elevated, patient investors have historically been compensated for the level of risk.
Rich Prices, Solid Footing
The solid performance has come with a price—on an absolute basis the REIT sector is expensive compared to its history. At the end of May, the FTSE/NAREIT All Equity REIT Index offered a dividend yield of just 3.8%, down significantly from the index’s 20-year median of 5.1%. Similarly, the sector’s price-to-adjusted funds from operations ratio—an industry metric similar to the price-earnings ratio used to evaluate equities—is higher than its long-term level (Figure 3).

Figure 3. US REIT Valuation Metrics
January 31, 1995 – May 31, 2016
Sources: FTSE International Limited, Green Street Advisors, National Association of Real Estate Investment Trusts, Thomson Reuters Datastream, and UBS Global Asset Management.
Note: Adjusted funds from operations (AFFO) represents net income after the addition of real estate depreciation and amortization, the subtraction of property sales gains/losses, and the adjustment of non-recurring items.
But in the context of the broader investment landscape, much of which is expensive, the sector is much more attractively priced. Consider the sector’s price-to-net asset value, which compares public price levels to the estimated liquidation value of the underlying real estate in private markets. It suggests the sector is trading at a small premium, consistent with historical data. The benchmark index’s dividend yield spread over the ten-year US Treasury yield suggests the sector may even be cheap, as it is currently wider than 79% of month-end observations dating back to 1995.
The REIT sector is also well positioned financially. Overall leverage is modest, with the industry’s debt-to-market capitalization ratio near long-term lows and interest and fixed-charge coverage ratios near highs (Figure 4). Managers have refinanced debt at attractive rates and better “laddered” maturity schedules, improving liquidity positions. And even amid the turmoil in markets this year, REITs maintained easy access to capital, raising over $23 billion in equity and debt so far.
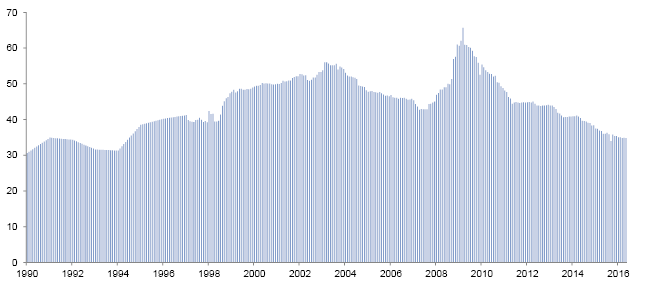
Figure 4. US REIT Leverage Ratio
January 31, 1990 – May 31, 2016 • Debt-to-Market Capitalization (%)
Source: Green Street Advisors.
This has helped the industry position itself for growth, albeit slower growth than years past. Consensus estimates indicate funds from operations will grow by close to a 5% annualized pace in the next three-year period, down from the high single-digit, low double-digit rate the sector has enjoyed since the global financial crisis. Certainly caution around the economic environment has increased of late, but the sector’s reasonable margins and low dividend payout ratio coupled with the commercial real estate backdrop should continue to drive growth.
Commercial Real Estate Backdrop
The commercial real estate market has enjoyed a mostly uninterrupted upward march since 2009, prompting us, and many investors, to question this cycle’s longevity. To be sure, there are clear areas of weakness, such as suburban offices or submarkets overly exposed to the energy sector. But low levels of new supply, positive trends in vacancy rates, and wide spreads between capitalization rates[1]The capitalization (cap) rate is the rate of return on a real estate investment property based on the income that the property is expected to generate. and the ten-year Treasury yield suggest that commercial real estate prices are neither excessive nor poised for an imminent down cycle (Figure 5).

Figure 5. Commercial Property Capitalization Rate vs Ten-Year Treasury Yield
First Quarter 1996 – First Quarter 2016 • Percent (%)
Sources: National Council of Real Estate Investment Fiduciaries and Thomson Reuters Datastream.
Notes: Data are quarterly. The cap rate is the equal-weighted cap rate for the NCREIF Property Index.
Following the global financial crisis, which saw the near-complete shutdown of commercial property construction, the low levels of supply growth probably initially failed to even offset supply reductions linked to obsolescence. Although construction levels have picked up in recent years, they remain below both historical levels and the growth in demand. This constrained supply picture worked to improve various property fundamentals, resulting in rising occupancy levels and strong same store net operating income growth (Figure 6).
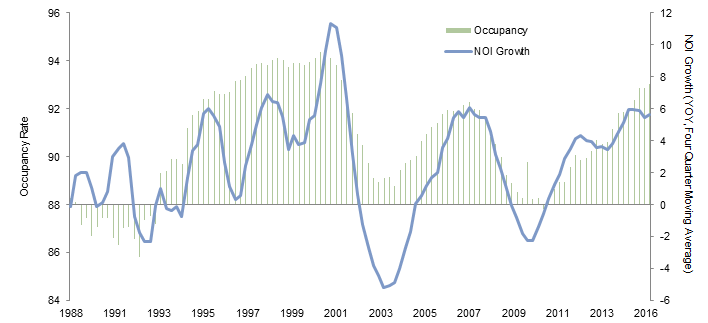
Figure 6. Commercial Real Estate Occupancy and Net Operating Income Growth
Fourth Quarter 1988 – First Quarter 2016 • Percent (%)
Source: National Council of Real Estate Investment Fiduciaries.
Note: Data are quarterly.
As a result of the supply/demand imbalance, commercial property prices recovered from the depths of the crisis, with values for core assets approximately 20% in excess of prior cycle peaks. But the pace of property appreciation appears to have slowed of late. Quarterly data from the NCREIF Property Index suggests commercial real estate property prices increased in the first quarter by only 2.2%, the lowest level since first quarter 2010, and monthly data from a few differently property indexes, including the Moody’s/RCA Commercial Property Price Index, suggest price levels may have even slipped slightly.
So have commercial property prices plateaued? Not according to Urban Land Institute’s April real estate consensus forecast. The consensus opinion from the semi-annual survey of economists and analysts indicates that prices will continue to grow over the next three-year period, albeit at a slower pace than long-term averages. Buoyed by an expectation of mild economic growth, those surveyed expect gains in rental income across all major property types to offset a modest rise in cap rates from 5.1% in 2016 to 5.5% in 2018.
Even if demand for commercial property space is softer than expected, supply pipelines continue to appear low. Although total net borrowing in commercial mortgages doubled in 2015 to $137 billion versus the prior year, according to data from the Fed, it is about half the level reached in the last cycle (Figure 7). And according to our data, there exists near $140 billion in aggregate dry powder—or uncalled capital committed to real estate private equity funds—available to support commercial property prices.

Figure 7. Net Borrowing of Commercial Mortgages
1995–2015 • As a Percent of GDP (%)
Sources: Federal Reserve, Thomson Reuters Datastream, and US Department of Commerce – Bureau of Economic Analysis.
Notes: Data are annual and as of March 10, 2016. Net borrowing of commercial mortgages is the Federal Reserve’s F.220 Commercial Mortgages borrowing estimate divided by GDP.
Potential Tailwinds
A recent change to tax law and an upcoming shift in industry classifications may also prove supportive to the REIT sector in the coming months and years. As a result of President Obama’s December 18, 2015, signing of the Protecting Americans From Tax Hikes Act (PATH Act) and MSCI’s and Standard & Poor’s decision to reclassify real estate as the 11th sector within the GICS structure, REITs may see increased investor interest, lower volatilities, and lower correlations to other equity sectors.
The PATH Act included provisions reforming the Foreign Investment in Real Property Tax Act of 1980 (FIRPTA), a law that potentially taxes non-US investors on gains realized from US real property, including direct holdings and interests in US real property holding companies, at rate of 30% or more. The FIRPTA reform (1) increased the ownership threshold from 5% to 10% before non-US investors that own publicly traded REITs would be subject to FIRPTA, (2) made it clearer and easier for a REIT to qualify as domestically controlled and thus be exempt from FIRPTA, and (3) exempted qualified non-US pension and retirement funds from FIRPTA.
Please see Meagan Nichols, “What Does US FIRPTA Reform Mean for Global Investors,” CA Answers, January 12, 2016.
As we wrote earlier this year, it is reasonable to expect marginal increased demand for REITs driven by incremental non-US interest in US real estate, particularly from investors seeking high-yielding assets in the current low-yield environment. Although it may be some time before this increase in demand occurs, as investors may be focused on other investment priorities, we see the increased demand as having the potential to drive cap rates lower, particularly for assets in prime locations, while also providing a new catalyst to REIT prices.
The GICS reclassification, which is set to occur on August 31, 2016, may have a similar impact, as many benchmark-sensitive investors are estimated to be significantly underweight REITs. To some extent, these underweight positions are the result of the unique characteristics of the REIT structure, which has helped gear it to industry specialists versus equity generalists, the sector’s historically small relative size, and preferences toward private real estate. According to investment firm Morningstar, actively managed mutual funds are more than 50% underweight REITs, as measured across all substyles of US equities (Figure 8). With REITs making up around 4% of the market and long-only equity funds representing $5 trillion in assets, near $100 billion of funds would be needed to move the position to market neutral.
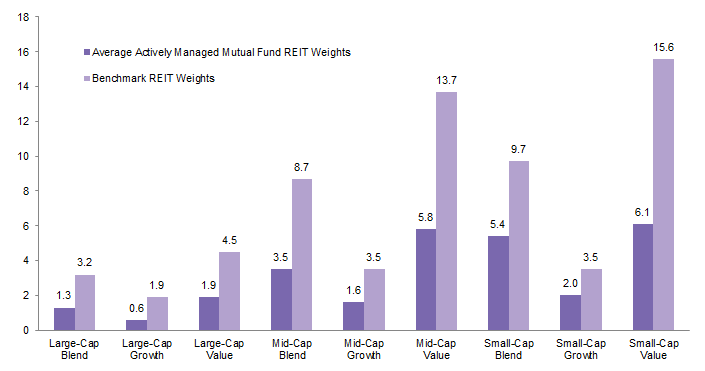
Figure 8. REIT Positions Across US Equity Asset Classes
As of May 6, 2016 • Percent (%)
Sources: Bloomberg L.P., Frank Russell Company, and Morningstar.
Notes: Benchmarks based on Russell indexes. Funds include open-ended funds. Data cited in Bloomberg article by Rani Molla, “REITs Are Coming of Age,” http://www.bloomberg.com/gadfly/articles/2016-05-09/reits-are-coming-of-age-for-investors.
The GICS change may also help lower the sector’s volatility and its correlation to other equity sectors. In past years, REITs have been impacted by the trading of exchange traded funds and mutual funds focused on the financial sector, as investors looked to speculate or hedge risks in the global financial system. As members of their own sector, REIT prices may be less impacted by non-real estate factors, focusing investors on more closely evaluate underlying business fundamentals. While the REIT sector’s correlation to the S&P 500 has tended to be low relative to other sectors, the GICS change could drive it lower, enhancing the sector’s diversification benefit (Figure 9).
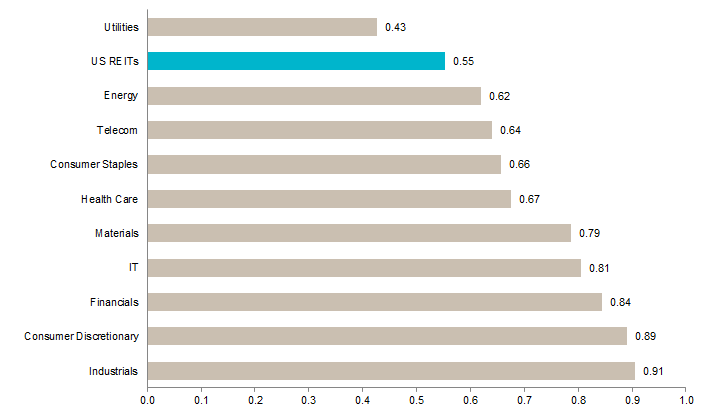
Figure 9. Correlations of US REITs and S&P 500 Sectors With the S&P 500 Index
1990–2015
Sources: FTSE International Limitied, National Association of Real Estate Investment Trusts, Standard & Poor’s, and Thomson Reuters Datastream.
Notes: Correlations based on monthly total returns from January 1990 to December 2015. Total returns are gross of dividend taxes. The financials sector includes REITs.
Concluding Thoughts
REITs should not be viewed as only retail oriented—the sector has developed in size and breadth, attracting top-tier talent, and has a lengthy track record of superior performance. Investors interested in the space would be well served by considering both active and passive strategies, the latter of which has often challenged fund managers thanks in part to low fees. While any near-term weakness in the market may represent a buying opportunity, allocation decisions should be viewed in the context of portfolio objectives, any private real estate holdings, and a recognition that current equity holdings may change following the GICS reclassification this summer.
Although we do not think investors should overweight the sector given current valuations, we also do not think a sizeable underweight is warranted. New construction has been easily absorbed by the market, and expectations for new supply continue to appear low relative to expected demand growth. This should continue to improve occupancy levels and support rental growth in the sector, if at a slower pace than recent years. Particularly in today’s low-return environment, the prudent investor should carefully evaluate all investment options.
Kevin Rosenbaum, Investment Director
Emily Thomas, Senior Investment Associate
Footnotes