Overview
US private equity and venture capital earned solid returns during first quarter 2015, outpacing the S&P 500 but trailing the Russell 2000® small-cap index, as indicated by the Cambridge Associates LLC benchmark indexes of the two alternative asset classes. Over the first three months of the year, venture capital outperformed private equity, and in the public markets, the small-cap and technology-heavy indexes bested large cap. In more recent periods, the private equity and venture capital indexes have had mixed results against public markets, but on a ten-, 20-, and 25-year basis they have handily outperformed.
First quarter’s 2.6% return for the Cambridge Associates LLC US Private Equity Index® was an improvement over its 0.8% performance in the previous quarter, while the 3.8% return for the Cambridge Associates LLC US Venture Capital Index® was a 6.1 ppt drop from results in the prior quarter. The private equity benchmark has earned positive returns in 11 straight quarters, and the venture capital index has produced positive results in 14 straight. While public equities have had similar strings of positive returns, the IPO market had its worst quarter since first quarter 2013.
The Cambridge Associates LLC indexes are derived from performance data compiled for funds that represent the majority of the institutional capital raised by private equity and venture capital partnerships. The Cambridge Associates LLC US Private Equity Index® includes funds raised between 1986 and 2014, and the Cambridge Associates LLC US Venture Capital Index® represents funds raised between 1981 and 2015. Based on the performance data collected, private equity and venture capital returns versus indexes tracking large- and small-capitalization public equities—the Nasdaq Composite, the Russell 2000® Composite, and the S&P 500—are shown in Table 1.
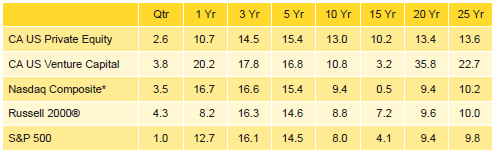
Table 1. US Private Equity and Venture Capital Index Returns
US$ Terms • Percent (%)
Note: Because the US Private Equity and Venture Capital indexes are capital weighted, the largest vintage years mainly drive the indexes’ performance.
* Capital change only.
First Quarter 2015 Highlights
- As of March 31, 2015, the private equity benchmark outperformed indexes tracking both small and large public companies in five of the eight time horizons listed in Table 1. The index underperformed both small and large public companies in only one of the other time periods, the three-year period. The venture index’s success against the Russell 2000® and the S&P 500 has been similar to the private equity index, in that it outperformed both small and large public companies in all but two of the time periods listed in the table. The most glaring exception was the 15-year period, which encompasses both the technology crash in 2000 and the global financial crisis later in the decade. The venture index’s performance against the tech-heavy Nasdaq has been strong, outperforming it in all periods.
- Public companies accounted for about 17.4% of the private equity index, roughly equal to the percentage at the end of 2014. Public company representation in the venture capital index was about 16.2%, down 1.5 ppts from the previous quarter. Non-US company exposures in the private equity and venture capital indexes have dropped slightly, and at the end of the first quarter they stood at 17.4% and 10.3% for the private equity and venture indexes, respectively.
Private Equity Performance Insights
- Returns for vintage years 2002 through 2014 (which represented 97% of the index’s value) were positive for the quarter.
- Among the six vintage years that were “meaningfully sized” (representing at least 5% of the index), returns ranged from 1.4% to 3.8%; the 2007 vintage was the best-performing, while funds formed in 2008 earned the lowest return of the group (Table 2). Led by 2007, the top six vintage years by size together represented 79% of the index’s value. The 2009 vintage nearly qualified as a key vintage year with 4.8% of the benchmark’s value during the quarter.
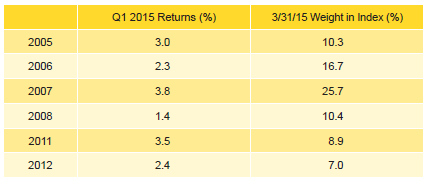
Table 2. Private Equity Vintage Year Returns: Net Fund-Level Performance
Note: Vintage year fund-level returns are net of fees, expenses, and carried interest.
- Vintage year 2007 had write-ups in all but three sectors, and the largest increases were in health care, consumer, financial services, and IT; media was the only sector with meaningful write-downs. For the 2008 vintage, write-ups in IT, consumer, and health care were partially offset by write-downs in energy and mining.
- During the first quarter, fund managers called $13.4 billion, a 34.2% decrease from the previous quarter. Limited partner (LP) distributions equaled $27.2 billion, a 40.0% drop quarter-over-quarter. The first quarter marked the 13th consecutive (and 16th out of the last 18) quarter when distributions surpassed contributions.
- In terms of contributions and distributions, the first three months of 2015 were much less active than the same period in 2014. The decreases from the prior year’s first quarter were almost $6 billion and more than $10 billion for contributions and distributions, respectively. Funds raised in 2007 and 2011–14 all called more than $1.8 billion, and these five vintages combined to call $10.7 billion, or 80% of total capital called. Vintage years 2004 and 2008 both distributed more than $2.2 billion during the quarter. The five vintages distributed $23.1 billion, or 85%, of the total. The largest vintage, 2007, alone distributed $8.9 billion during the quarter.
- All but one of the seven sectors representing at least 5% of the private equity index earned positive returns during the quarter; energy’s -0.9% return was the exception (Table 3). Health care earned the highest return at 5.9%. Energy company valuations were written down in most vintage years, with the most significant drops occurring in 2008 and 2012 funds. The biggest write-ups for energy were in the 2011 vintage. Write-ups in the 2007 vintage year were by far the largest contributor to the health care sector’s performance. The only other sector of note in the benchmark with a negative return was media, representing 4.4% of the index, which fell 2.4 ppts for the quarter.
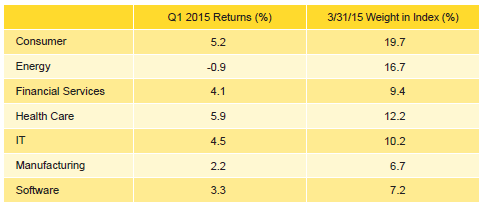
Table 3. Private Equity Sector Returns: Gross Company-Level Performance
Note: Industry-specific gross company-level returns are before fees, expenses, and carried interest.
- Energy companies attracted the most capital during the quarter, 27% of the total, which is nearly 10% higher than what has been invested in the sector over the long term.
Venture Capital Performance Insights
- Quarterly returns varied widely across the meaningfully sized vintages in the venture capital index (Table 4). The best return of the group (vintage year 2011) was 8.2%, while the worst (vintage year 2004) was 0.3%. All vintages earned positive returns over the quarter.
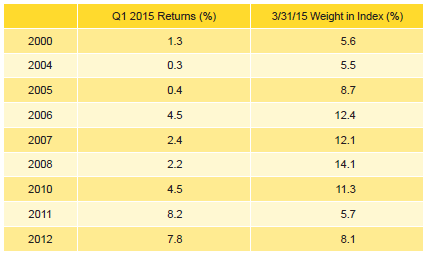
Table 4. Venture Capital Vintage Year Returns: Net Fund-Level Performance
Note: Vintage year fund-level returns are net of fees, expenses, and carried interest.
- For the best-performing vintage, 2011, health care and IT sector write-ups were the primary drivers of performance and for the lowest performer, 2004, large gains in health care were almost entirely offset by write-downs in software.
- Performance varied among the four largest vintage years, 2006–08 and 2010. Health care was the primary contributor to the 2006 and 2008 vintage year funds’ returns; alongside health care, electronics also drove the 2007 vintage. The 2010 funds’ write-ups were dominated by software and IT.
- Venture capital fund managers called $3.6 billion from investors during the first quarter, a 9.5% decrease from the previous quarter. Distributions from venture funds were $6.6 billion, a sizeable number but a 20.6% decrease from fourth quarter, which was the highest quarter for distributions in our data since fourth quarter 2000. Distributions outpaced contributions for the 13th quarter in a row.
- Funds formed in 2008 and 2011–14 were responsible for 79% of the total capital called during the quarter; each of these five vintages called more than $267 million. Distributions from vintage years 2000, 2004–08, and 2010 totaled $5.3 billion, representing 79% of the total from the quarter. Each of these seven vintages distributed more than $500 million in the quarter.
- The three meaningfully sized sectors together represented over 80% of the value of the index, and all three had positive returns in the first quarter (Table 5). The best return was earned by the health care sector. For the second quarter in a row, the lowest return was posted by information technology companies. Write-ups for health care companies were mainly driven by the 2006 vintage year funds, which had more than $1.0 billion of valuation increases in the sector. IT company valuation changes (either positive or negative) were modest across vintage years.
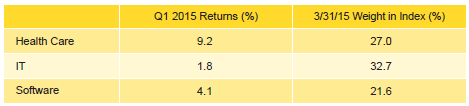
Table 5. Venture Capital Sector Returns: Gross Company-Level Performance
Note: Industry-specific gross company-level returns are before fees, expenses, and carried interest.
- In keeping with historical norms, IT, health care, and software companies attracted the lion’s share of the dollars invested by venture capital managers in the index. At 85% of capital invested, the amount is almost 9% higher than the long-term trend for the three sectors combined.
About the Indexes
Cambridge Associates derives its US private equity benchmark from the financial information contained in its proprietary database of private equity funds. As of March 31, 2015, the database comprised 1,206 US buyouts, private equity energy, growth equity, and mezzanine funds formed from 1986 to 2014, with a value of nearly $564 billion. Ten years ago, as of March, 31, 2005, the index included 587 funds whose value was roughly $161 billion.
Cambridge Associates derives its US venture capital benchmark from the financial information contained in its proprietary database of venture capital funds. As of March 31, 2015, the database comprised 1,576 US venture capital funds formed from 1981 to 2015, with a value of roughly $158 billion. Ten years ago, as of March 31, 2005, the index included 1,053 funds whose value was about $52 billion.
The pooled returns represent the net end-to-end rates of return calculated on the aggregate of all cash flows and market values as reported to Cambridge Associates by the funds’ general partners in their quarterly and annual audited financial reports. These returns are net of management fees, expenses, and performance fees that take the form of a carried interest.
Both the Cambridge Associates LLC US Venture Capital Index® and the Cambridge Associates LLC US Private Equity Index® are reported each week in Barron’s Market Laboratory section. In addition, complete historical data can be found on Standard & Poor’s Micropal products and on our website, www.cambridgeassociates.com.