Overview
Third quarter 2016 returns for the Cambridge Associates LLC US Private Equity Index® and the Cambridge Associates LLC US Venture Capital Index® were 3.7% and 3.3%, respectively. The private equity index equaled its performance for the previous quarter, and the venture index produced its first positive quarter of the year, bringing its year-to-date return into positive territory as well. Both private indexes underperformed the large-cap S&P 500, the small-cap Russell 2000®, and the tech-heavy Nasdaq Composite indexes in the third quarter (Table 1).

Table 1. US Private Equity and Venture Capital Index Returns
Periods Ended September 30, 2016 • USD Terms • Percent (%)
Sources: Cambridge Associates LLC, Frank Russell Company, Standard & Poor’s, and Thomson Reuters Datastream.
Notes: Private indexes are pooled horizon internal rates of return, net of fees, expenses, and carried interest. Because the US Private Equity and Venture Capital indexes are capital weighted, the largest vintage years mainly drive the indexes’ performance. Public index returns are shown as both time-weighted returns (average annual compound returns) and dollar-weighted returns (mPME). The CA Modified Public Market Equivalent replicates private investment performance under public market conditions. The public index’s shares are purchased and sold according to the private fund cash flow schedule, with distributions calculated in the same proportion as the private fund, and mPME net asset value is a function of mPME cash flows and public index returns.
* Constructed Index: Data from 1/1/1986 to 10/31/2003 represented by Nasdaq Price Index. Data from 11/1/2003 to present represented by Nasdaq Composite.
Over the past five years (20 quarters), the US private equity and venture capital indexes earned positive returns in 19 and 18 quarters, respectively, while posting double-digit returns of about 14% each. Despite the consistently strong performance over that time period, based on modified public market equivalent (mPME) returns, public market indexes have outpaced the private benchmarks. The private indexes continue to show superior long-term results. Cambridge Associates’ mPME calculation is a private-to-public comparison that seeks to replicate private investment performance under public market conditions.
Changes to the Sector Classification Methodology for CA Benchmarks
Historically, Cambridge Associates has categorized private equity and venture capital portfolio company investments using a proprietary sector classification methodology, and sector returns discussed in previous editions of these commentaries have been based on that proprietary system. Beginning with this edition of the US benchmark commentary, we will present sector performance based on the Global Industry Classification Standard (GICS). As a result of the shift to GICS, the sector breakdown of the various indexes has changed (Figures 1 and 2). One benefit of using GICS for private investments classification is that it enables more accurate sector comparisons to public indexes. GICS was developed by and is the exclusive property and a service mark of MSCI Inc. and S&P Global Market Intelligence LLC and is licensed for use by Cambridge Associates.

Figure 1. US Private Equity Index: Mapping the CA Sector Classification to GICS Sectors
As of September 30, 2016 • Percent (%)
Notes: Maps CA sectors to the GICS sectors that make up at least 5% of the US Private Equity Index. Old sector weights may not sum to new sector weights due to rounding. In several cases companies in the same sector under the old classification system mapped to different GICS sectors. Sectors making up less than 5% of the index under the GICS classification are not shown.

Figure 2. US Venture Capital Index: Mapping the CA Sector Classification to GICS Sectors
As of September 30, 2016 • Percent (%)
Notes: Maps CA sectors to the GICS sectors that make up at least 5% of the US Venture Capital Index. Old sector weights may not sum to new sector weights due to rounding. In several cases companies in the same sector under the old classification system mapped to different GICS sectors. Sectors making up less than 5% of the index under the GICS classification are not shown.
Third Quarter 2016 Highlights
- In a reversal of long-term trends, as of September 30, 2016, the private equity benchmark underperformed at least one of the public indexes tracking large and small public companies in six of the nine time horizons, based on mPME returns (Table 1). The exceptions were the time horizons longer than ten years. The venture capital index has also had mixed results against the public indexes, beating all three public indexes listed in the table in only the three-, 20-, and 25-year time periods ending in September 30, 2016.
- Public companies accounted for almost 15% of the private equity index and nearly 13% of the venture capital index. Non-US company exposure in the private equity index dropped slightly to about 17%, while the venture capital index’s percentage has remained fairly steady, hovering between 8% and 9%.
Private Equity Performance Insights
- During third quarter 2016, all but one of vintage years 2004 –15 (which represented almost 97% of the index’s value) were positive. Among the nine vintage years that were meaningfully sized (representing at least 5% of the index), pooled returns ranged from vintage year 2005’s -1.1% to vintage year 2014’s 5.7% (Table 2). Led by 2007, the top nine vintage years by size together represented 89% of the index’s value. The 2010 vintage continues to fall just shy of a key performance driver, representing almost 4.0% of the benchmark’s value.
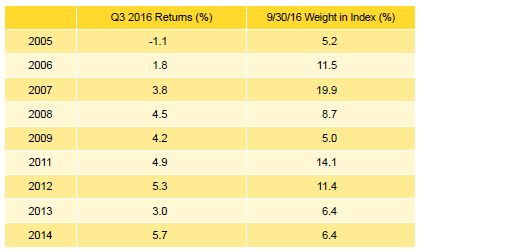
Table 2. Private Equity Vintage Year Returns: Net Fund-Level Performance
Note: Vintage year fund-level returns are net of fees, expenses, and carried interest.
- Top-performing vintage year 2014 had write-ups in all consequential sectors, and the largest dollar increases were in energy, information technology, and consumer discretionary (in rank order). For the worst-performing 2005 vintage, write-downs in consumer discretionary and staples more than offset the gains in energy, health care, and information technology. The largest vintage year in the benchmark, 2007, represented 20% of the index’s value. Valuation increases across sectors helped buoy its return, with the largest write-ups (in dollars) occurring in consumer discretionary and health care.
- During the third quarter, limited partners (LPs) in funds included in the US private equity benchmark contributed $26.0 billion and received distributions of $29.6 billion. Capital calls, which have risen incrementally over the course of the year, were 10% higher than in the second quarter, while distributions dipped about 16%. From fourth quarter 2010 through third quarter 2016, (six years or 24 quarters), distributions outnumbered contributions 21 times. In the preceding six years (2004–10), this happened six times. In the first nine months of 2016, LP contributions equaled about $70 billion, an increase of $10 billion from the same time period in 2015 (Figure 3). At roughly $83 billion, distributions in the first three quarters of 2016 were about $21 billion lower than during the same period in 2015.

Figure 3. Private Equity Contributions, Distributions, and Net Asset Value (NAV)
Periods Ending September 30, 2016
- Five vintage years (2011–15) each called more than $3 billion in the quarter for a combined total of $21 billion, or 80% of total capital called. Vintages 2005–07 each distributed more than $4 billion during the quarter. Combined, they distributed $16.3 billion, or 55% of the total.
- All six sectors representing at least 5% of the private equity index earned positive returns during the quarter (Table 3). Returns among the large sectors ranged from 3.4% (consumer discretionary) to 5.8% (financials). The largest write-ups in consumer discretionary companies were driven mostly by vintage years 2007, 2011, and 2014, while write-downs were mainly in vintages 2005 and 2006. The two largest sectors—consumer discretionary and information technology—earned a weighted dollar return of 3.9% for the quarter, underperforming the index’s total gross return by nearly 70 basis points.
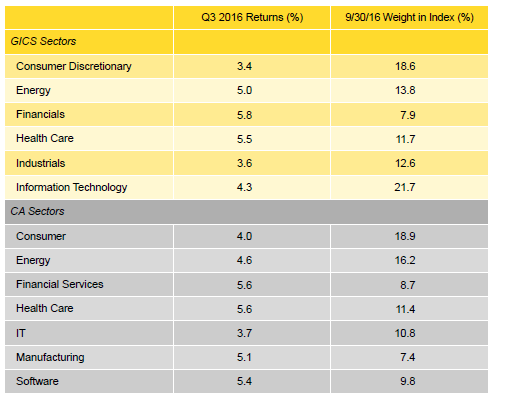
Table 3. Private Equity Sector Returns: Gross Company-Level Performance
Note: Industry-specific gross company-level returns are before fees, expenses, and carried interest.
- Three sectors—information technology, energy, and consumer discretionary (in rank order)—attracted about 63% of the capital invested during the quarter. Historically, those three sectors have garnered closer to half of the capital deployed by US private equity managers. Information technology investments represented a much larger percentage of third quarter activity than over long term.
Venture Capital Performance Insights
- With the exception of the 2006 vintage, the distribution of quarterly returns was fairly narrow across the venture capital benchmark’s nine top-sized vintages (up from eight last quarter), which represented about 82% of the index (Table 4). Vintage year 2006 had the best return of the group at 8.6%; vintage year 2012 had the worst at 1.3%. With the exception of 2016, no vintage from 2000 on earned a quarterly return below 1%.

Table 4. Venture Capital Vintage Year Returns: Net Fund-Level Performance
Note: Vintage year fund-level returns are net of fees, expenses, and carried interest.
- For the best-performing vintage, 2006, information technology and health care company write-ups were the primary drivers of performance, both with over $500 million in valuation increases. For the lowest performer, 2012, information technology was the only sector with substantial write-ups.
- Performance was somewhat modest among the four largest vintage years—2007, 2008, 2010, and 2012—ranging from 1.3% to 3.6%. Health care and information technology were the key positive contributors to all four vintages. Consumer discretionary also had a positive impact on the 2010 and 2012 vintage years’ performance.
- Venture capital fund managers called $3.1 billion from investors during the third quarter, a 9% decrease from the previous quarter and the second lowest quarterly capital call amount in the past five years (since third quarter 2011). Distributions from venture funds were $5.4 billion, a more than 16% increase over the second quarter and a 46% jump from the first. Distributions have outpaced contributions in every quarter since the beginning of 2012 (Figure 4).

Figure 4. Venture Capital Contributions, Distributions, and Net Asset Value (NAV)
Periods Ending September 30, 2016
- Funds formed from 2012 to 2016 were responsible for 80% of the total capital called during the quarter; each of these five vintages called more than $200 million, with an average of $492 million. Vintage years from 2004 to 2010 all distributed more than $250 million in the quarter and together represented 74% of the quarter’s total, with an average of $578 million. The 2006 vintage led all with almost $960 million in distributions.
- All three sectors that represented at least 5% of the value of the index had positive returns in the third quarter (Table 5). Among the three, health care earned the best return and information technology the lowest. Write-ups for health care companies were mainly driven by the 2006 and 2008 vintage years, both of which had more than $500 million of valuation increases in the sector. Information technology, the largest of the three sectors, posted a 3.6% return for the quarter, driven by fairly widespread gains led by vintages 2006 and 2010.

Table 5. Venture Capital Sector Returns: Gross Company-Level Performance
Note: Industry-specific gross company-level returns are before fees, expenses, and carried interest.
- In keeping with historical norms, information technology and health care companies (in rank order) attracted the lion’s share of the dollars invested by venture capital managers in the index. At 84% of capital invested, the amount is more than 4.5% higher than the long-term trend for the two sectors combined.
About the Indexes
Cambridge Associates derives its US private equity benchmark from the financial information contained in its proprietary database of private equity funds. As of September 30, 2016, the database comprised 1,334 US buyouts, private equity energy, growth equity, and mezzanine funds formed from 1986 to 2016, with a value of $630 billion. Ten years ago, as of September 30, 2006, the index included 724 funds whose value was $237 billion.
Cambridge Associates derives its US venture capital benchmark from the financial information contained in its proprietary database of venture capital funds. As of September 30, 2016, the database comprised 1,680 US venture capital funds formed from 1981 to 2016, with a value of roughly $190 billion. Ten years ago, as of September 30, 2006, the index included 1,163 funds whose value was about $70 billion.
The pooled returns represent the net end-to-end rates of return calculated on the aggregate of all cash flows and market values as reported to Cambridge Associates by the funds’ general partners in their quarterly and annual audited financial reports. These returns are net of management fees, expenses, and performance fees that take the form of a carried interest.
About the Public Indexes
The Nasdaq Composite Index is a broad-based index that measures all securities (over 3,000) listed on the Nasdaq Stock Market. The Nasdaq Composite is calculated under a market capitalization–weighted methodology.
The Russell 2000® Index includes the smallest 2,000 companies of the Russell 3000® Index (which is composed of the largest 3,000 companies by market capitalization).
The Standard & Poor’s 500 Composite Stock Price Index is a capitalization-weighted index of 500 stocks intended to be a representative sample of leading companies in leading industries within the US economy. Stocks in the index are chosen for market size, liquidity, and industry group representation.